
 | |||
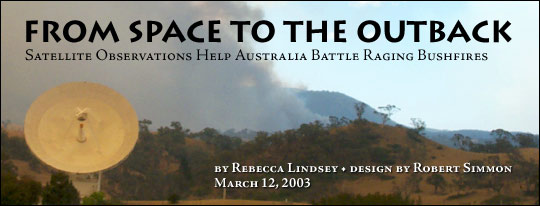
As 2002 drew to a close and summer approached in the Southern Hemisphere, parts of eastern and southern Australia were in the midst of one of the worst multi-year droughts on record. Precipitation was at an all time low, thanks in part to a strong El Niño. Daily temperatures regularly exceeded 100 degrees Fahrenheit (37.7 degrees Celsius) and 70-mile-per-hour (113-kilometer-per hour) winds ripped across the bush. To the west, central Australia was seeing the end of three years of above-average rainfall. In the wet season, pasture grasses were more luxuriant than they had been in 25 years. In the semi-arid environment, such lushness was destined to fade. During the dry season, the verdant fields of grass became millions of acres of tinder. Ironically, these opposite ends of the climate spectrum produced the same result: both the drought-parched landscapes of the southeast and the well-watered central portion of the country ended up in flames. | Title graphic: Smoke from bushfires in southeast Australia thickens the air behind an antenna at NASA’s Deep Space Network station in Tidbinbilla. Image courtesy Barry Davis. | ||
| |||
More than 500,000 square kilometers (123.6 million acres)—70 percent of the arid zone of Australia’s Northern Territory—burned in Central Australia between 2000 and 2002, as did large areas of the arid regions of South Australia and Western Australia. Fires threatened homesteads and devastated pasture, fences, and bores (artesian wells). In southeast Australia, fires exploded at the New South Wales-Victoria border in the Great Dividing Range and Snowy Mountains and grew in all directions. The fires encroached on dozens of communities and blazed through the natural bush corridors of Australia’s capital, Canberra. More than five hundred homes were destroyed, and with regional cotton, wheat and other winter crops at roughly half their typical yield due to drought, farmers suffered another blow: thousands of livestock were lost in the fires, and millions of acres of forest, rangeland, and tree plantations were scorched. | Over the past three years, record rains in central Australia (and the accompanying build up of pasture grass) and record drought in the east have produced widespread and severe bushfires across the country. In the map above, dark blue shows record-high rainfall; dark red shows record-low rainfall. | ||
| |||
This year’s devastating fire season is an echo of the 2001-02 season that climaxed in the bush on the outskirts of Sydney and drew international attention once again to the city that had hosted the 2000 Summer Olympics. In the aftermath of that season, Australian scientists and government agencies developed a new fire monitoring system that uses observations from NASA’s Moderate Resolution Imaging Spectroradiometer (MODIS) sensors on the Terra and Aqua satellites to identify fires in remote locations in Australia. The system provides a big-picture perspective of fires across the country and helps fire emergency agencies allocate resources to the areas where they are needed most. In remote areas, MODIS data are even being used to map large fire perimeters and monitor fire movement and growth. Sentinel On Guard for Australian Fires | The 2003 fire season around Canberra, Australia burned more than 2 million acres of land, destroyed more than 500 homes, and claimed at least 4 human lives. Flames destroyed the Stromlo Astronomical Observatory (top), and parts of the Canberra suburb of Duffy were almost leveled (lower).(Photographs copyright Simon Bennett.) | ||
The Australians harness the MODIS direct broadcast signal at three receiving stations: one near Alice Springs in central Australia, one in Perth, on the southwest coast, and one in Hobart, in southern Tasmania. The advantages of MODIS Direct Broadcast observations captured multi-agency attention. The Alice Springs and Hobart Facilities are operated by the remote-sensing division of Geosciences Australia (the Australian version of the United States Geological Survey); the Perth receiving station is run by Geosciences Australia in conjunction with the Department of Land Administration in Western Australia and the Australian Bureau of Meteorology. Another MODIS receiving station is planned for Darwin, on the north-central coast. | Satellite data from the Moderate Resolution Imaging Spectroradiometer showed both immense plumes of smoke and the location of active fires (red dots). Firefighters used the data to allocate resources and map fire perimeters and burn scars, especially in remote areas. This image was acquired February 4, 2003. (Image courtesy MODIS Land Rapid Response Team at NASA GSFC) | ||
| |||
The direct broadcast signal includes all of MODIS’ observations—all 36 spectral bands (discreet segments of the electromagnetic spectrum ranging from visible to infrared wavelengths of light). Just five minutes of observations create a file that is about 400 megabytes—not something that could be easily sent via the Internet all over the country! For the Sentinel Hotspots project, a dedicated computer at the Alice Springs station analyzes the data stream up to four times in a 24-hour period, scanning for unusually high amounts of thermal and short-wave-infrared radiation detected by MODIS, which indicate possible fires. The computer automatically creates a small file that includes only these “hot spot” locations and in less than an hour of the satellite’s overpass, sends it across the continent to the Land and Water Division of Australia’s Commonwealth Scientific and Industrial Research Organization (CSIRO) in Canberra. Using this simple latitude and longitude information, the hot spots are incorporated into interactive maps that users can create from any Internet Web browser. The maps show important surface features near the fires, such as roads, rivers, topography, and towns. The data used in this study are available in one or more of NASA's Earth Science Data Centers. | MODIS direct broadcast receiving stations located across Australia provide coverage across the continent. Perth, Alice Springs, and Hobart have operating stations, and a fourth is being planned for Darwin. (Map copyright Stafford Mall) | ||