
 |
Scientists have known for decades that the Earth’s climate is driven by the exchanges of radiant energy between our world and outer space. Over the course of a year, the amount of sunlight entering the Earth system equals the amount of radiant energy reflected and emitted back through the top of the atmosphere (Harrison et al. 1993). The sun beams an average of 340 watts per square meter to the Earth and, in turn, our world reflects 100 watts (or the equivalent of one light bulb) per square meter back up to space. The remaining solar energy (240 watts per square meter) is stored as heat within the air, oceans, and land surface and, gradually, emitted back up through the atmosphere to space. |
Part 1: The Iris Hypothesis |
|
|||
Using satellite remote sensors to take global measurements of the amount of sunlight reflected by the Earth and the amount of heat emitted up through the top of the atmosphere, scientists can compute the “bottom line” on the Earth’s energy budget. Such measurements reveal which components of the Earth’s system are the key drivers of climate. In the early 1980s Richard Lindzen, a theoretician and professor of meteorology at the Massachusetts Institute of Technology, turned his attention to the “forcings” and “feedbacks” that water vapor and clouds exert on the climate system. He wanted to find out how the climate as a whole responds to changes in water vapor and cloud cover. “When the hullabaloo began over global warming, it became clear the answer depended a lot on the feedback from water vapor and clouds,” he observes. “We (scientists) didn’t know how to deal with them.” So Lindzen began working on the problem by examining the physics of how water vaporizes. Although carbon dioxide gets most of the bad publicity these days as the critical greenhouse gas, the
warming effect of carbon dioxide is minuscule compared to that of water vapor. Water vapor is present in
such abundance throughout the atmosphere that it acts like a blanket of insulation around our world,
trapping heat and forcing surface temperatures higher than they would be otherwise. At most wavelengths
within the thermal infrared energy spectrum (basically heat) that get trapped within Earth’s
atmosphere you barely even notice the effects of carbon dioxide because water vapor totally dominates
the signal. But what makes carbon dioxide so interesting is that the gas absorbs energy in some small
segments of the thermal infrared spectrum that water vapor misses. This extra absorption within the
atmosphere causes the air to warm just a bit more and the warmer the atmosphere the greater its capacity
to hold more water vapor. This extra water vapor then further enhances the Earth’s greenhouse
effect, far more even than the small warming forced by the added carbon dioxide. Scientists estimate
that doubling levels of carbon dioxide in the atmosphere would be about the same as a 13 percent
increase in water vapor, because water vapor is roughly eight times more effective than carbon dioxide
as a greenhouse gas (Hartmann 1994). In short, if water vapor is the 800-pound gorilla of the Earth’s
greenhouse effect, then carbon dioxide is the steroid pill that helps water vapor lift temperatures even
higher. |
Over the long term, energy that the Earth receives from the Sun must be balanced by heat that escapes back into space. In general, clouds reflect sunlight before it warms the Earth, while gases in the atmosphere such as carbon dioxide and water vapor trap heat, warming the Earth’s surface. (Photograph STS109-325-2 courtesy the Earth Sciences and Image Analysis Laboratory at Johnson Space Center.) | ||
 |
 |
The way in which humidity and rising air masses lead to saturation of the atmosphere and cloud formation in the tropics is a bit different from the way in which those dynamics occur at mid-latitudes. So, in his experiment, Lindzen decided to confine his focus to the tropics. But there is such an intimate relationship between clouds and water vapor in the tropics that it is difficult to get a clear picture of just what the water vapor is doing.
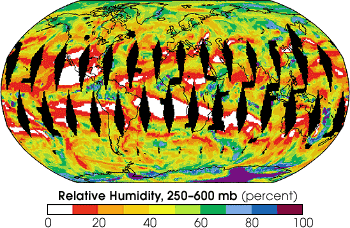
Lindzen says he was influenced by an image produced using data from the Special Sensor Microwave Water
Vapor Sounder (SSM/T-2), flying aboard a U.S. military satellite. “The image made it clear that in the tropics
you have regions of high humidity and regions of low humidity, separated by sharp boundaries,” he recalls.
“At first, we were looking at how humidity changed in the clear regions and we didn’t have a good handle
on how the relatively cloudy areas changed. Slowly, it dawned on us that, in the tropics, clouds moisturize the air
around them. Clouds are a major source of moisture.”
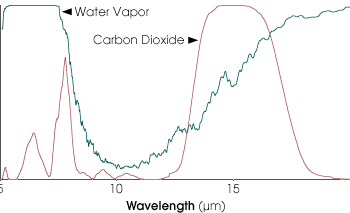
Carbon dioxide is the most frequently mentioned greenhouse gas, but water vapor absorbs infrared (heat) radiation much more strongly. Carbon dioxide is significant because it closes a “window” that would otherwise allow certain infrared wavelengths to escape the Earth’s water vapor blanket. The graph at left shows the percentage of energy absorbed in a clear tropical sky by water vapor (green) and carbon dioxide (brown). (Graph by Robert Simmon, based on model data from the NASA GSFC Laboratory for Atmospheres)

Humid and dry regions of the tropical atmosphere are very distinct. The image at left shows humidity measured by the SSM/T-2 Atmospheric Water Vapor Profiler at pressures ranging from 250 to 600 millibars (the mid-troposphere; note that the black areas in this image are where no data was collected). Lindzen reasons that areas of low humidity (white) opening and closing helps regulate the temperature of the Earth. Lindzen further hypothesizes that high sea surface temperatures would create storms that precipitated more efficiently, reducing the size of humid areas in the atmosphere. By linking the two ideas he came up with a mechanism that effectively offsets global warming due to a buildup of greenhouse gases by allowing more heat to escape to space. (Image from the IPCC report Climate Change 2001: The Scientific Basis)
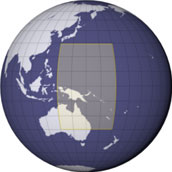
So Lindzen’s team shifted its focus to clouds instead of humidity and used the Japanese Geostationary Meteorological Satellite-5 to make their measurements. That satellite, they reasoned, would provide them the best resolution over both time and space to meet their objective. That satellite’s field of view concentrated their focus on a large patch of Earth ranging from 30°N latitude to 30°S, and 130°E longitude to 170°W. This patch spans an area bordered by the Indonesian Archipelago to the west, the center of the Pacific Ocean to the east, southern Japan to the north, and southern Australia to the south. This area contains the world’s largest and warmest body of water, known as the Indo-Pacific Warm Pool. Lindzen wanted to find out how the types and extent of clouds vary as a function of underlying sea surface temperature.
“We wanted to see if the amount of cirrus associated with a given unit of cumulus varied systematically with changes in sea surface temperature,” he says. “The answer we found was, yes, the amount of cirrus associated with a given unit of cumulus goes down significantly with increases in sea surface temperature in a cloudy region.”
This is the finding that led Lindzen’s team to propose that the Earth has an adaptive infrared iris—a built in “check-and-balance” mechanism that effectively counters global warming (Lindzen et al. 2001). Much like the iris in a human eye contracts to allow less light to pass through the pupil in a brightly lit environment, Lindzen suggests that the area covered by high cirrus clouds contracts to allow more heat to escape into outer space from a very warm environment.

Lindzen’s team studied the relationship between sea surface temperature and cloud extent in the area of the Indo-Pacific Warm Pool, shown above in yellow. (Map by Robert Simmon)
|
|||
“We argue that a plausible interpretation is that the results reflect a temperature dependence for the cirrus detrainment from cumulus towers,” the authors state in their paper. “This dependence appears to act as an iris—that opens and closes dry regions so as to inhibit changes in surface temperature.” Lindzen admits that he still doesn’t know exactly how this infrared iris works, but his hypothesis is that the amount of cirrus “precipitated” out from cumulus depends upon what percent of the water vapor that is rising in a deep convective cloud condenses and falls as rain drops. Most of the water vapor condenses, but not all of it rains out. Sometimes the water vapor cannot form droplets into rain fast enough to avoid the strong updraft, and much of this moisture eventually goes into forming high, thin cirrus clouds. But the more moisture rains out of the cloud, the less there is available to form cirrus clouds. “It is well known that the warmer the cloud base is and the more water vapor there is rising in the cumulus cloud, the more efficiently precipitation forms,” Lindzen explains. “So this is consistent with what we saw—the warmer the cloudy region, the less cirrus you get. Conversely, as it gets colder, the cloud’s condensation efficiency goes down and the more ice crystals get entrained to form cirrus clouds.” |
Lindzen and his team used data from geostationary satellites to measure the amount of high clouds over the eastern tropical Pacific. The above images show GOES data near Hawaii, to the west of the orginal study area (GMS-5 was used in the original study but failed before this article was written). Thin cirrus clouds are streaming (from left to right) off the convective cores of a line of thunderstorms. The lower left image shows infrared data, which correspond to temperature. Cloud top temperatures less than 260K are colored light blue. The lower right image shows the difference between the 11 and 12 µm channels. Dark areas (in the upper lefthand corner) represent thick clouds. Clouds that were both cold and thick were included in the calculations of cloud-covered area. (Images by Robert Simmon, based on data from the GOES Project) small visible light animation (380 kb
Quicktime) |
||
|
|||
“This is a terrifically important feedback,” Lindzen concludes, “because if you double the amount of carbon dioxide in the atmosphere but don’t have any feedback within the system, you only get about 1 degree of warming (averaged over the entire globe). But climate models predict a much greater global warming because of the positive feedback of water vapor. Yet these models are missing potentially another negative feedback (the infrared iris) which can be anywhere between a fraction of a degree and 1 degree—the same order of magnitude as the warming.” (The net result would then be that the Iris’ negative feedback cancels the water vapor’s positive feedback. The warming for a doubling of carbon dioxide would then return to the 1°C that scientists predict would occur if there were no feedbacks.) Given the current political and scientific concerns about global warming, Lindzen’s colleagues in the Earth system science community were very interested in his findings. One litmus test for whether or not a new hypothesis is true is whether other scientists can reproduce the same experiment and arrive at the same findings as the original experimenter. Two teams of scientists—one based at NASA’s Langley Research Center (LaRC) and the other at the University of Washington—replicated Lindzen’s experiment and arrived at surprisingly different conclusions. (Only the LaRC team’s experiment is presented here in part 1.)
The data used in this study are available in one or more of NASA's Earth Science Data Centers. |
Strong convection redistributes heat and moisture in the tropical atmosphere. Distinctive anvil clouds form when hot, humid air (red) rises in a region called the convective core. As the air rises it cools, resulting in heavy precipitation. During the strong convection typical of the tropics the air can rise high into the troposphere (roughly 15 km altitude) where the column is truncated by high winds. This forms high-altitude cirrus clouds that stream out ahead of the storms. Cool air (still with a high relative humidity) drops out of the cap of cirrus clouds, which warms and dries as it falls. This process humidifies the air in the upper troposphere. Near the surface over the tropical oceans (beneath the boundary layer) the air is always humid and often filled with low-level clouds. (Image by Robert Simmon) | ||