

Because understanding of some important effects driving sea level rise is too limited, this report does not assess the likelihood, nor provide a best estimate or an upper bound for sea level rise. The projections do not include...the full effects of changes in ice sheet flow.
Intergovernmental Panel on Climate Change, 2007 Synthesis Report.
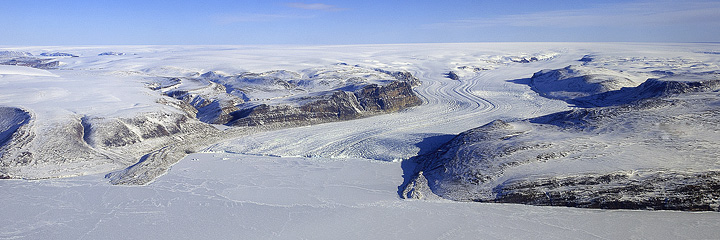
Thule Glacier, Greenland. (Photograph by Michael Studinger, NASA GSFC.)
Sophie Nowicki bristles as she reads that statement from the IPCC to an auditorium full of scientists at NASA’s Goddard Space Flight Center. As a scientist who builds computer models to study ice sheets and their impact on climate, Nowicki sees the statement as a challenge. It drives her to help lead an effort to build better models and provide better predictions.
What’s at stake is far more than reputation or intellectual satisfaction. “We want to know how sea level is going to change in our warming world,” she explains. And she wants to know in time to improve the sea level forecast in the next report from the Intergovernmental Panel on Climate Change, which gives governments information to plan for climate change.
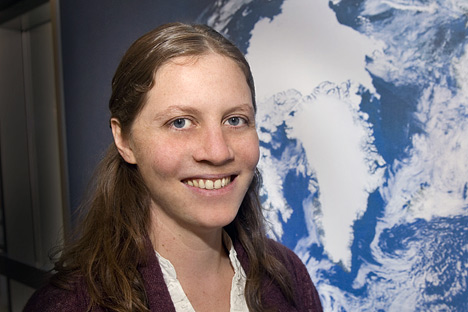
Sophie Nowicki. (Photograph courtesy NASA GSFC.)
The problem is that the world’s ice isn’t behaving like anyone thought it would. Instead of a slow and steady melt as temperatures rise, glaciers are spitting out icebergs in many places, draining the Greenland and Antarctic ice sheets at an alarming pace. In other places, glaciers are barely moving or are growing thicker. On the whole, ice sheets are dwindling far faster than predicted, and this means sea level could rise more quickly than previously thought.
Trying to understand what is happening on the ice is like climbing Everest in tennis shoes, says glaciologist (and sometimes mountain climber) Eric Rignot of the University of California-Irvine and NASA’s Jet Propulsion Laboratory (JPL). Without a solid understanding of what is happening now, how could anyone guess what might happen in the future?
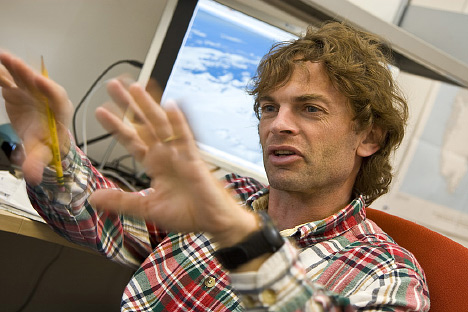
Eric Rignot. (Photograph courtesy Paul R. Kennedy/University of California-Irvine.)
But, Rignot notes, scientists just got some better climbing shoes. The mission known as IceBridge carries an array of instruments on airplanes to obtain the most complete picture of Earth’s ice cover to date. Though it’s not a satellite mission, IceBridge is more than a one-time field campaign. “IceBridge is the largest coordinated polar airborne campaign ever undertaken,” says Tom Wagner, NASA’s cryosphere program manager.
Funded and structured like a satellite mission, IceBridge is a six-year campaign to continue measurements started by NASA’s Ice, Cloud, and Land Elevation Satellite (ICESat). IceBridge also takes measurements no satellite could. These unique measurements are providing new insight into the processes that drive the melting of ice sheets and the condition of Arctic sea ice.

NASA’s P-3 over the Beaufort Sea, north of Alaska. (Photograph courtesy U.S. Navy.)
And all of this new information feeds back into models like Nowicki’s, making them more accurate predictors of things to come.
“IceBridge exists because we need to understand how much ice the Greenland and Antarctic ice sheets will contribute to sea level rise over the next couple of decades,” says project scientist Michael Studinger. “In order to do this, we need to measure how much the ice surface elevation is changing from year to year.”
The second major goal of IceBridge, says Wagner, is to track how Arctic sea ice is changing, which will help scientists understand its critical role in climate and weather.
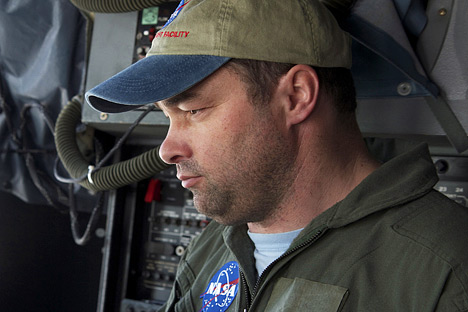
Michael Studinger. (Photograph courtesy Jefferson Beck, NASA GSFC.)
Such measurements began three decades ago with laser altimeters flown on airplanes, and then expanded with the launch of ICESat in 2003. Its main instrument, the Geoscience Laser Altimeter System, or GLAS, worked by sending out short pulses (40 per second) of green and infrared light. The light bounced off particles in the atmosphere or on Earth’s surface and returned to a one-meter wide telescope. The amount of light that returned, and the time it took to return, depended on the height of the surface that reflected it. For instance, high ice clouds reflected light faster than ice on the ground or ocean.
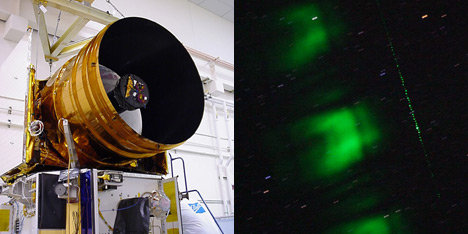
ICESat’s GLAS instrument used a 1-meter (3.3-foot)-wide telescope (left) to collect green laser light (right) reflected from the Earth’s surface. (Photographs courtesy ICESat Mission Team, NASA.)
The measurements gave scientists a picture of the elevation of Earth’s ice sheets and the thickness of Arctic sea ice. Repeated measurements, year after year, completed the picture of how ice was changing and where the biggest changes were happening.
But ICESat was turned off in 2009 when its last laser stopped working, just as plans were developing to launch a second ICESat in 2016. To bridge the gap between the two missions, NASA returned to laser altimeters on airplanes and set up IceBridge. The first series of flights flew over Antarctica in October and November 2009, and the team has flown annual campaigns over the Arctic and Antarctic ever since.
The laser altimeters on IceBridge—the Airborne Topographic Mapper (ATM) and the Laser Vegetation Ice Sensor, or LVIS (pronounced elvis)—can measure the shape and height of the ice surface to within 10 centimeters. The ATM is similar to the ICESat laser altimeter, and has been flown on surveys of Greenland every year since 1993.
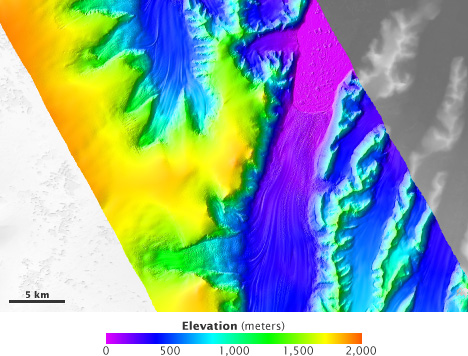
The Laser Vegetation Ice Sensor (LVIS) maps mountain ranges and glaciers with enough precision to show individual icebergs. This map shows the elevation of the Crane Glacier, on the Antarctic Peninsula. (Map courtesy LVIS Team, NASA GSFC.)
LVIS was originally built a decade ago to study vegetation. It flies at high elevations—more than ten kilometers (six miles) up—to measure large areas. LVIS records not only the time the laser takes to bounce back, but also the way the light is distorted when it returns. This helps scientists figure out the shape of rough surfaces.
IceBridge carries more than laser altimeters. “The biggest contribution from IceBridge will be the integrated analysis of a suite of cutting-edge instruments,” says Studinger. “We are flying eight different instruments on the P-3, and are collecting data that you typically can’t collect from a satellite.”
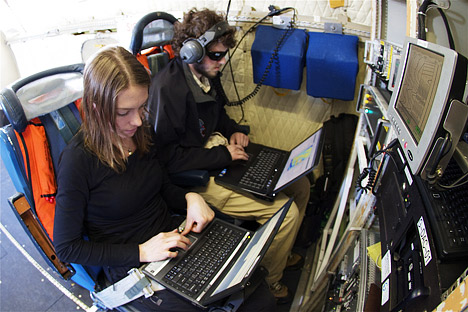
Researchers monitored instruments aboard the NASA P-3 as it flew above Greenland in spring, 2011. [Photograph courtesy Jefferson Beck, NASA GSFC]
The instruments on IceBridge include a gravimeter, a magnetometer, a digital camera, and a collection of radar instruments. The gravimeter, provided by Columbia University, records minute variations in gravity to map the ocean floor along the edge of the ice. The magnetometer measures variations in Earth’s magnetic field, which will help scientists map the seafloor geology beneath the ice and water, since some rocks are stronger magnets than others. The Digital Mapping System is set up to take very high-resolution photographs of the landscape beneath the plane throughout each flight.
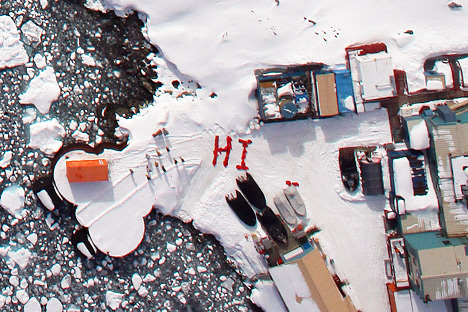
The Digital Mapping System camera captured this photograph of Palmer Station, Antarctica. Crew aboard NASA’s DC-8 saw this greeting from members of the station as the plane flew over the Antarctic Peninsula during Operation Ice Bridge in October 2009. (Photograph courtesy Airborne Sensor Facility, NASA Ames Research Center.)
The radar instruments, provided by the University of Kansas, bounce radio waves off the ice to measure its elevation and shape. The snow radar, the only instrument of its kind, records in fine detail the depth of fresh snow on top of the ice. The Multichannel Coherent Radar Depth Sounder, on the other hand, penetrates the ice to map the shape of the ground beneath it.
The Ku-Band Radar Altimeter sees through the fresh snow to locate the ice surface. The altimeter, when combined with the ATM and LVIS laser altimeters, helps scientists correlate measurements from the European Space Agency’s CryoSat to the ICESat elevation record.
CryoSat-2 uses a radar altimeter to penetrate the ice and measure a different surface than the laser on ICESat. The differences between the two methods kept scientists from knowing how to link the two records. But since laser and radar altimeters are making measurements simultaneously on IceBridge, the mission offers a type of Rosetta Stone to relate ICESat observations to those from CryoSat-2 and ICESat-2.
“If we tie all of these different time-series together, from the airborne platform to the satellites,” says Studinger, “we can see how ice sheets and sea ice change over several decades.”
Knowing how much the elevation of the ice sheets has changed is valuable because it tells modelers how ice is evolving. This, in turn, allows them to estimate how much it has contributed to sea level rise. But it’s only part of the calculation.
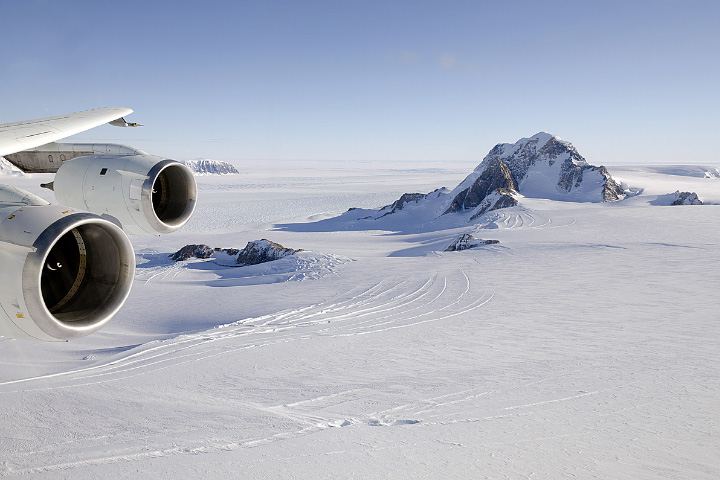
Although the polar ice sheets are largely flat, the bedrock beneath is often rugged. Radar instruments carried aboard IceBridge flights are designed to map the topography beneath the ice. (Photograph courtesy Michael Studinger, NASA GSFC.)
Nowicki points out a very basic problem when trying to predict sea level rise: “We don’t know the full volume of the Greenland ice sheet or the Antarctic ice sheet. We are lacking a good knowledge of what the bed looks like beneath the ice sheet. And if I don’t know what the bed looks like, I don’t know how much ice there is. IceBridge is going to give us that.”
Each radar instrument mounted on the P-3 bounces radio waves of different wavelengths off the ice. Some penetrate the top layers, while others travel all the way to the ground before reflecting back to receivers on the plane.
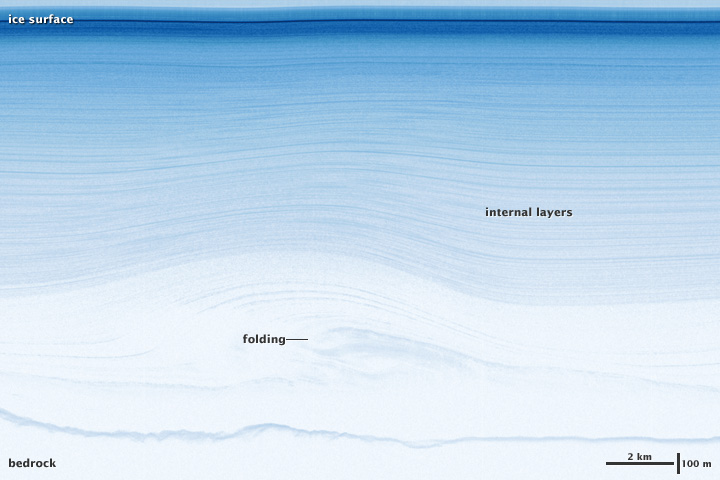
The structure of ice sheets over a kilometer thick is revealed by IceBridge’s radar instruments. This image reveals layers and folds in the Greenland Ice Sheet, measured in March 2011. (Image by Jesse Allen and Robert Simmon, using data from the Center for Remote Sensing of Ice Sheets.)
“We get a complete picture of the ice from top to bottom,” says Studinger. “We see how much snow has been deposited on the surface. And we see all the way to the bottom of the ice sheet—three or four kilometers down—to internal layers that formed hundreds of thousands of years ago. That tells us what is happening in the ice sheets and how they flow into the ocean.”
“People have thought about flying something like IceBridge for 30 or 40 years,” says Rignot. “This top-to-bottom view is a game-changer. IceBridge will provide the critical data that we need to improve ice sheet models.”
Solving the thickness problem turns out to be important for both land and sea ice. Unlike land-based ice, melting sea ice won’t contribute to sea level rise because the ice mass is already in the water. But understanding changes in sea ice is an important piece of the climate change equation. “Sea ice is one of the major knobs on global climate and weather, and we don’t know how turning that knob is going to affect things,” says Wagner.
Sea ice reflects light from the Sun. As it disappears, darker, open water will absorb more heat in the summer and sea ice will return more slowly in the winter. The additional heat in all seasons will moderate Arctic temperatures, and that will melt permafrost and change the Arctic landscape.
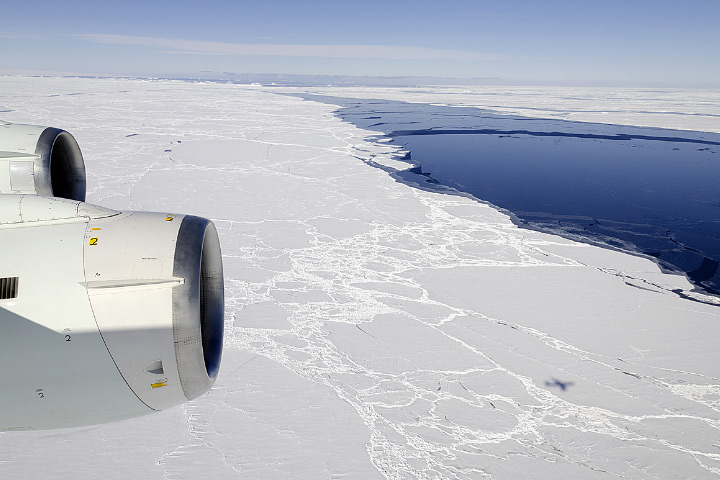
Leads of open water in the polar oceans are much darker than the surrounding sea ice, and absorb sunlight that would otherwise be reflected away. As global warming causes sea ice to decline, a vicious cycle may lead to more rapid melting. (Photograph courtesy Michael Studinger, NASA GSFC.)
“The Arctic is now warming faster than the rest of the planet, probably because of the loss of reflective sea ice,” says Ronald Kwok, a member of the IceBridge science team from NASA’s Jet Propulsion Laboratory.
The changes will extend beyond the Arctic. “As you take the ice away, you will change North American weather patterns, but no one knows how,” says Wagner. “It’s possible that you could radically alter precipitation maps of the United States.”
Melting sea ice could change global ocean circulation. In the far North Atlantic Ocean, surface waters cool and sink, forming deep water. This sinking helps drive the “global conveyor belt,” the ocean currents that move warm water from the tropics toward the poles. Conveyor-belt currents, like the Gulf Stream, influence weather patterns around the world.
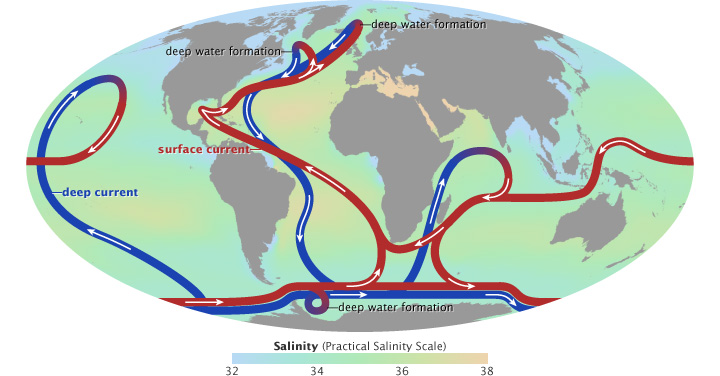
Warm surface currents (red) cool and sink in the Arctic, forming deep water. Fresh water from melting sea ice could weaken this global circulation. (Map by Robert Simmon, adapted from the IPCC 2001 and Rahmstorf 2002.)
Melting sea ice could weaken the conveyor belt. “Sea ice is relatively fresh water,” says Kwok. As it flows out of the Arctic and melts, it adds a layer of fresh water to the surface of the North Atlantic. The fresh water is less dense than salty water and may not be dense enough to sink, weakening the conveyor belt.
It’s not clear exactly how the loss of Arctic sea ice is affecting the planet today and what the future holds. Computer models can help scientists explore the connections between sea ice, ocean circulation, heat, and weather patterns. “The data from ICESat and IceBridge are critically important for improving those models,” says Wagner.
Models require measurements of both sea ice extent and thickness. Extent is a relatively simple measurement made from satellite instruments that use microwaves to see the ice through clouds. Thickness is calculated by measuring the amount of ice floating above the water surface, says Kwok. When sea ice floats, only a tenth of it stands above the water. “We know the density of ice, so we can calculate the thickness. If we measure 20-30 centimeters above the water, we know that the ice is two to three meters thick.”
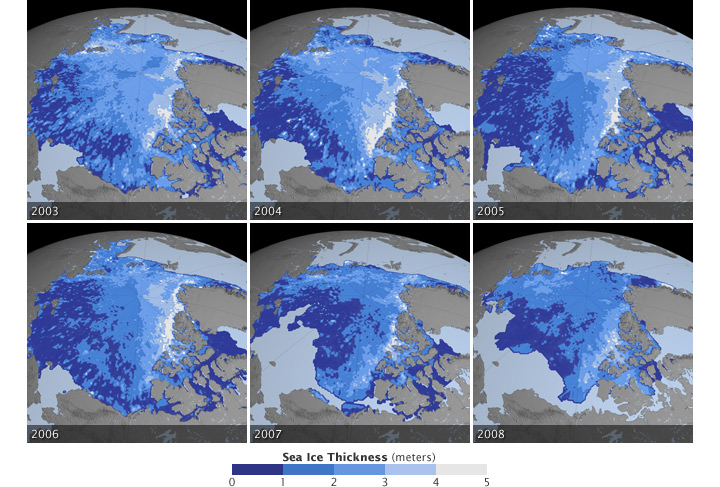
Scientists have been able to estimate sea ice thickness with ICESat and IceBridge by measuring the height of ice above the water and comparing it to the height of the water itself. The problem is snow: just a few centimeters on top of the ice can throw off the ice thickness estimate. But short of drilling holes and making occasional sonar measurements from a submarine or moored sonar instrument, scientists haven’t had many opportunities to figure out snow and sea ice thickness. Now IceBridge carries the instruments to separate the snow layer from the ice beneath.
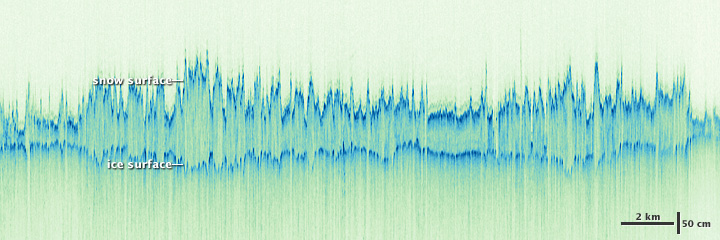
Radar instruments that distinguish snow from ice enable scientists to refine measurements of sea ice thickness. (Image by Jesse Allen and Robert Simmon, using data from the Center for Remote Sensing of Ice Sheets.)
Early results from the snow radar show that, on average, 30 centimeters of snow sit on top of seasonal ice (ice that melts and re-forms every year) at the end of the season. More snow sits on older, multi-year ice. By understanding how much snow is on top of the ice, scientists now have a more accurate estimate of how thick the ice actually is and how much it is thinning.
“Snow also indicates how much moisture is being delivered from lower latitudes to the Poles,” says Kwok, “which is an independent indicator of climate change.”
The new top-to-bottom view of the ice should help fill in the gaps in understanding why ice on land moves the way it does. Seeing the ground beneath the ice reveals why some areas are thinning rapidly, while others are holding steady. A smooth surface or water at the base of a glacier allows it to slide quickly, channeling large quantities of ice from the interior of an ice sheet to the ocean. A rough bed surface can anchor a glacier in place.
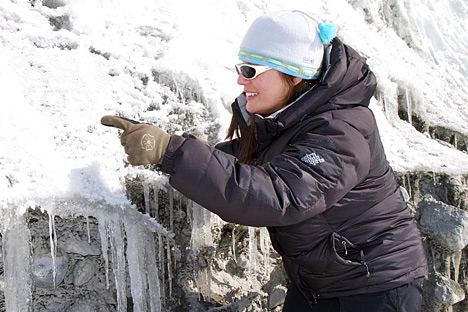
Lora Koenig, a NASA scientist, examines the contact between southern Greenland’s Russell Glacier and the ground. The interactions between ice, rock, and water govern how fast glaciers flow. (Photograph courtesy NASA IceBridge.)
The shape of the land where a glacier meets the ocean influences how the glacier will behave, says Nowicki. If the ground slopes downhill as you move inland from the ocean—or if the glacier is channeled through a deep canyon or fjord—then it’s a sure bet that the glacier will retreat quickly. In contrast, bumps or ridges beneath the glacier can act as pinning points and stop the retreat.
Glacier bed measurements from IceBridge are already improving the models for two important glaciers, Jakobshavn Isbrae in Greenland and Pine Island Glacier in Antarctica. Both are fast-flowing glaciers that channel vast amounts of ice into the ocean.
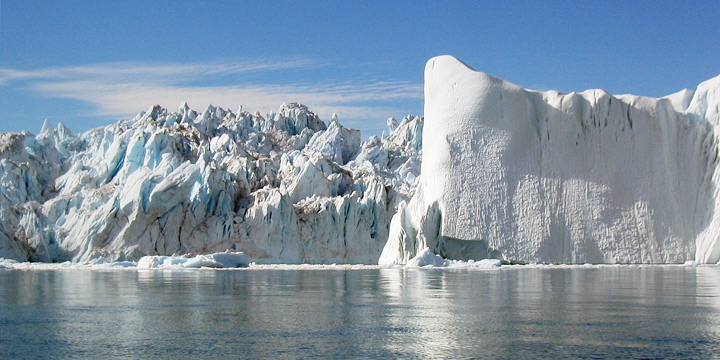
Jakobshavn Isbrae is the largest outlet glacier in Greenland, and affects the rate of ice loss from the Greenland Ice Cap. (Photograph copyright Spencer Weart, American Institute of Physics.)
“Before IceBridge, this measurement of Jakobshavn was the best bed we had,” says Nowicki, pointing to a crude figure (image below left) illustrating what was once the best picture of the ground beneath any glacier. “With much more data from the radar instrument (on IceBridge and earlier flights), we realized that the bed of Jakobshavn Isbrae is a channel that could be compared to the Grand Canyon. It’s the same width, the same depth.” Ice-flow models that use the new measurements of the Jakobshavn bed now match pretty closely with the real-world observations of its movements.
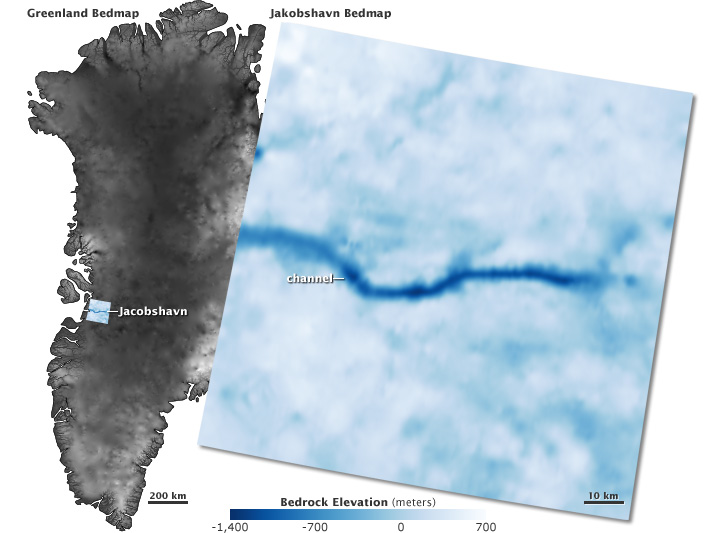
Before NASA’s intensive field studies, maps of the bedrock beneath Greenland’s Ice Cap had a maximum resolution of about 5 kilometers per pixel (left image). New maps improve that twenty-fold, to about 250 meters per pixel (right). (Map by Robert Simmon, using data from the Bristol Glaciology Centre and the Center for Remote Sensing of Ice Sheets.)
The models of Pine Island Glacier are improving as well. “The Pine Island Glacier and its neighbors are the most important glaciers in Antarctica,” says Rignot. “They are losing an enormous amount of mass.”
The end of the Pine Island Glacier hangs and floats over Pine Island Bay, and this poses a challenge for radar instruments that would otherwise image the ice from top to bottom. “Radar systems don’t penetrate water,” says Studinger.
Scientists knew that they needed to figure out the shape of the ocean floor beneath Pine Island Glacier because it controls the flow of water in the bay. And so the IceBridge team installed a gravimeter on the plane to measure variations in gravity. Because rock is denser than water, the gravity field over rock is a bit stronger. These minute variations allowed scientists to piece together a rough map of the ocean floor.
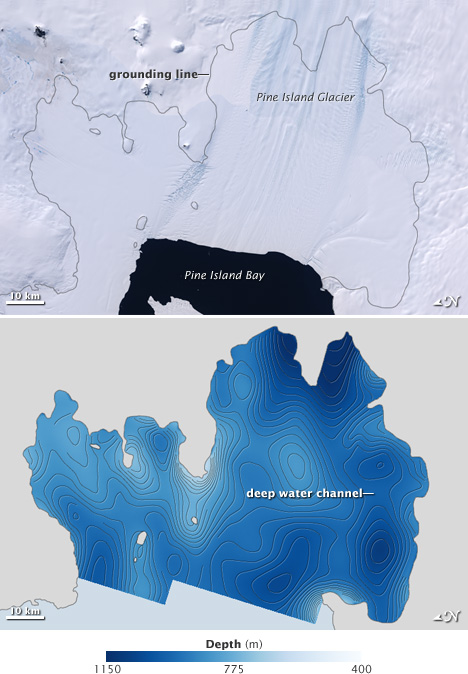
Flow of the Pine Island Glacier is guided by the shape of the sea floor beneath the ice. Gravimeter measurements made in October 2009 revealed a deep channel leading from the Antarctic coast to Pine Island Bay. (Image by Jesse Allen, using data from Michael Studinger, NASA GSFC and Columbia University.)
“The bathymetry explains right away why Pine Island Glacier is melting,” says Studinger. A deep channel snakes from the front of the glacier to the grounding line, where the land connects to the ice and holds it in place. Warm water has been reaching the grounding line and undercutting the glacier, forcing it to move and melt quickly.
“When we put this data into the ocean circulation models, they suddenly made sense,” says Studinger. “The melt rates that they produce are very close or almost identical to the melt rates that we are observing.”
Putting IceBridge measurements into small-scale models of single glaciers or sea ice prediction models is a first step toward improving global models that can predict sea level rise and climate change. To speed up the process, the IceBridge team did something unprecedented.
“We asked the community where to fly the airplane to make the models better,” says Studinger. The community responded with excitement and a bit of trepidation, says Nowicki. “It’s the first time that modelers were asked ‘what do you need?’”

Many IceBridge flights are designed to help verify and improve computer models of ice motion. (Photograph courtesy Michael Studinger/NASA.)
The collaboration has led to a new computer-based tool that tells mission planners where measurements are lacking and how much models will improve if they fly the plane over these locations. This allows planners to chart flight paths that will do the most to improve models. “It’s the first time that an observation campaign has this kind of strong link with the modeling community,” says Nowicki, who represents modelers on the IceBridge science team.
Antarctic IceBridge flights start in Punta Arenas, Chile, and continue over rapidly changing areas like the Pine Island Glacier and Antarctic Peninsula. [Web resolution animation (2.4 MB QuickTime). High definition animation (24 MB QuickTime)]. (Map by Lori Perkins, NASA GSFC SVS.)
The link to the modeling community will have ramifications long into the future. “In 2030, we’re going to have much more advanced computer models of the global climate and the ice,” says Wagner. “We’re going to need decades of data to test those models against. I’m hopeful that we’re collecting the right data sets so that 20 years from now, we’ve got a long enough record that we can use them to make accurate predictions about the future.”
In October 2011, the IceBridge team set out for their third series of flights over Antarctica. One long, tedious flight at a time, some as long as 20 hours, the team painstakingly peels back layers of new information about the ice. Studinger, Kwok, Rignot, and other IceBridge team members each express awe for the remote, fragile beauty of the place, but beneath that awe is a sense of obligation and urgency.
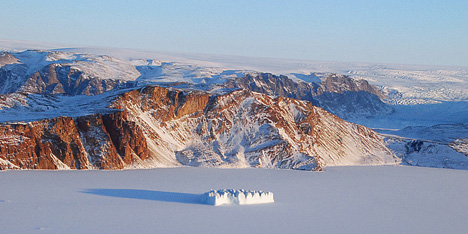
The early morning sun shining on coastal Greenland is one of the many beautiful landscapes seen by IceBridge scientists and crew. (Photograph courtesy Michael Studinger, NASA.)
“We feel pressure to come up with results, to find out what the ice sheets will do in a warming climate,” says Rignot. The IceBridge mission is flying at a time when ice is changing faster than anyone thought it could, and change provides opportunity. “We can learn a lot quickly because the system is changing so rapidly. We are in the golden age of glaciology, but we are also facing an immense challenge.”