
 |
Leaving aside for a moment the deforestation and other land
cover changes that continue to accompany an ever-growing human population, the last two decades of the
twentieth century were a good time to be a plant on planet Earth. In many parts of the global garden,
the climate grew warmer, wetter, and sunnier, and despite a few El Niño-related setbacks, plants
flourished for the most part. |
|
||

Numerous small-scale studies over the past twenty years suggested that patches of the garden were getting
greener, but that trying to paint a global picture would be a monumental project. A team of eight
scientists from across the country worked for almost a year and half to pull together satellite data on
vegetation and ground- and satellite-based climate observations. Their results show us not only how
vegetation productivity has changed during two of the warmest decades in the record books, but they also
reveal which of the many factors that influence plant productivity have been most important in those
changes. |
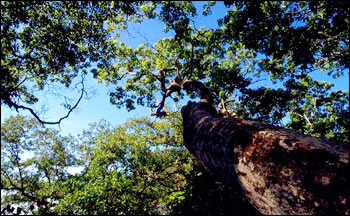
Over the past 20 years, scientists have measured an increase in the average growth rate of plants on a global scale. More sunshine may be benefitting this tree and others like it in the Costa Rican rainforest. (Photograph Copyright Phillip Greenspun) |
||
When scientists talk about productivity they are specifically talking about how much carbon ends up stored in the living biomass—roots, trunks, and leaves of plants—after they tally up carbon gains through photosynthesis and carbon losses through respiration. This tally of gains minus losses is called “net primary production.” Scientists estimate net primary production by observing how leafy vegetation is and how much sunlight it is absorbing, which can both be measured by satellite. Combined with climate data on rainfall, temperature, and available radiation, the satellite observations reveal where carbon intake increased—and biomass grew—across the globe. “Between 1982 and 1999, 25 percent of the Earth’s vegetated area experienced increasing plant
productivity—a total increase of about 6 percent,” says Ramakrishna Nemani, the study’s
lead scientist. “That increase occurred mainly in the tropics, and secondarily in high northern
latitudes. What’s interesting about our results is that they show how the increase in each of
these regions is due to a different climate factor. “In the tropics, Nemani and his colleagues
discovered that the increase in productivity was caused by lack of clouds and increased Sun exposure,
while in the northern latitudes, it was mainly due to increased temperatures and to a lesser extent,
water availability. |
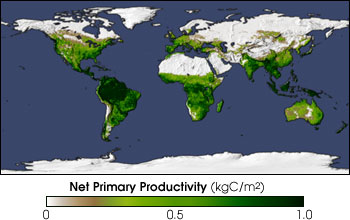
Changes in rainfall, temperature and sunlight between 1982 and 1999 increased the overall productivity of land plants by 6 percent. This map shows productivity increases in green, while decreases are shown in brown. Productivity increased the most in tropical regions, where climate change resulted in fewer clouds and more sunlight. [Image by Robert Simmon, NASA Earth Observatory, based on data provided by the University of Montana Numerical Terradynamic Simulations Group (NTSG)]
Global primary productivity has been rising since 1982. In contrast to the long-term upward trend, El Niño years and the eruption of Mount Pinatubo occasionally decreased overall plant growth. (Graph by Robert Simmon, NASA Earth Observatory, based on data provided by the University of Montana NTSG)
|
||
|
Increases in productivity are important in a practical sense, since plant biomass is the food and fuel for all animals—including humans—on the planet. It’s also important in the way that everything related to carbon has become important in recent years. Scientists and environmental policy decision makers across the world want to know what is happening to all the carbon in the carbon dioxide pumped into the atmosphere through fossil fuel and biomass burning, such as forest fires or firewood used as fuel. If carbon dioxide is “food” for plants, maybe more of it in the atmosphere caused plants to grow better. “Experiments conducted in places like the U.S and Europe, where scientists pumped extra amounts of carbon dioxide gas into forests, did seem to show that such ‘carbon dioxide fertilization,’ caused plants to grow better—up to a point,” says Nemani. “But this didn’t go on year after year. Most people agree that a doubling of carbon dioxide could increase plant growth between 0 and 25 percent depending on resource limitations such as soil nutrition. With the 9 percent increase in carbon dioxide that occurred between 1980 and 2000, even the upper limit cannot explain the productivity increases in Amazon.” Clearly, carbon dioxide fertilization couldn’t be solely responsible for the change; climate change must be playing a role as well. To reach these conclusions, Nemani, and colleagues from Scripps Institute of Oceanography, University of
Montana, NASA’s Goddard Space Flight Center, and Boston University used global climate data from
the National Center for Environmental Prediction to determine the relative importance for various
locations of the three key variables that influence plant growth: temperature, water availability, and
sunlight. They indexed areas based on which of those factors most limited plant growth across the Earth.
Lack of sufficient water limits the growth of 40 percent of Earth’s vegetation, temperature limits
33 percent, and lack of sufficient sunlight limits the remaining 27 percent. Of course, these factors
overlap in some cases; for example, both cold winters and dry summers limit plant growth in the western
U.S. |
This map shows which of three key climate factors most limits plant growth in an area (red is water; green is sunlight; blue is temperature). High northern latitudes are limited by temperature, while areas along the fringe of Africa’s Sahara Desert are limited by water. Across the tropics, regular cloudiness limits plant growth. In many places, these factors are co-limiting. (Image by Robert Simmon NASA Earth Observatory, based on data provided by the University of Montana NTSG) |
||
After identifying key regulators of plant growth across the globe, Nemani and his colleagues then looked
at how those climate conditions changed over the past two decades. They compared these changes to
satellite-based maps of vegetation collected by the National Oceanic and Atmospheric Administration’s
series of AVHRR (Advanced Very High Resolution Radiometer) sensors. The digital satellite observations
were processed and refined into maps by NASA’s Global Inventory Modeling and Mapping Studies
project headed by Compton Tucker at Goddard Space Flight Center. It was the comparison of
satellite-based vegetation and climate data that allowed them to pinpoint decreased cloudiness in the
tropics as the main driver of increased productivity, something that hadn’t been seriously
considered before. |
The growth of bristlecone pines in the Inyo Mountains of eastern California is limited by the extreme aridity of their climate, and by cold temperatures in the (relatively) damp spring. Increased rainfall or warmer winters would likely lead to a higher growth rate in these ancient forests. (Photograph Copyright Phillip Greenspun) | ||

The group of scientists who did this study have been working together off and on for many years. Nemani worked with University of Montana colleague Steve Running in 2001 on a study of whether good vintages could be scientifically tied to climate variation, and found that they could—even suggesting that good vintages might be predicted by observing sea surface temperatures off California and winter climate. Since the late 1990s, Ranga Myneni of Boston University has published a series of papers in collaboration with some of the same researchers on the impact of the last two decade’s climate changes on Northern Hemisphere vegetation, describing how lack of snow cover and warmer temperatures are lengthening the Northern Hemisphere growing season by almost two weeks and increasing productivity. After all these years of working together, it was natural for them to pool their expertise and interests to “go global” with the study of climate and vegetation. Nemani says it would be nice if the next decade were as favorable for plants as the past two seem to have been. “Unfortunately, we have no way of knowing yet whether climate changes will continue to have a positive effect on vegetation productivity,” he cautions. “India, for example, got a blessing from nature during the 1990s. For 100 years, there has been a strong relationship between El Niñoo and the monsoon season that brings rain to India and Southeast Asia; El Niñoo events interrupt the monsoon and create drought. In the 1990s, that relationship broke down, and the monsoon rains came despite a severe and persistent El Niño.” As a result, while much of the globe saw a decrease in productivity during El Niño events, India was one of the places where productivity increased. Whether the region can count on such a lucky break this decade can’t be predicted. That unpredictability means that in all likelihood, we shouldn’t be dismissing our worries about carbon dioxide in the atmosphere or congratulating ourselves on our green thumb just yet. “Humans claim about half of all the net primary production on Earth,” says Myneni. “Productivity may have increased 6 percent in the last 18 years, but human population has increased by over 35 percent over that same time. One half of a 6 percent increase in the net productivity compared to a 35 percent increase in population means that these net primary productivity changes have not improved global habitability in any significant way.” “This global study is a good foundation,” concludes Nemani. “It helps us decide where on the globe we should look more closely at what is happening with Earth’s vegetation. But as far as the whole carbon cycle goes, this is only part of the picture. We didn’t look at how climate changes might have influenced other ecosystem processes that release carbon dioxide back into the global system.” Warmer temperatures could increase the rate at which soil microbes decompose organic matter and release carbon dioxide. In the tropics, lack of cloud cover might temporarily increase productivity until the increased evaporation caused by all that extra sunlight makes water availability more important. Productivity could drop just as easily as it has risen. What this study does tell is that, so far, climate change is making the Earth’s vegetation more productive, but the impact is small compared to how quickly the human population is growing. This knowledge could be a key piece of information for societies around the world as they cultivate the global garden through agriculture, natural resource management and environmental policy.
The data used in this study are available in one or more of NASA's Earth Science Data Centers. |
Nearly 20 years of satellite observations of net primary productivity reveal the seasonal and yearly cycles of Earth’s vegetation. This image shows the net primary productivity during the month of December 1999. An animation reveals the dominant theme—the seasonal shift in productivity (shades of green) between the Northern and Southern Hemisphere over the course of a year. More subtle vegetation patterns include a decrease in productivity at high latitudes of the Northern Hemisphere following the eruption of Mt. Pinatubo in 1991, and global-scale decreases in productivity during El Niño events. (Image & animation by Robert Simmon, NASA Earth Observatory, based on data provided by the University of Montana NTSG) |