Trees cool and moisten our air and fill it with oxygen. They calm the winds and shade the land from sunlight. They shelter countless species, anchor the soil, and slow the movement of water. They provide food, fuel, medicines, and building materials for human activity.
They also help balance Earth’s carbon budget.
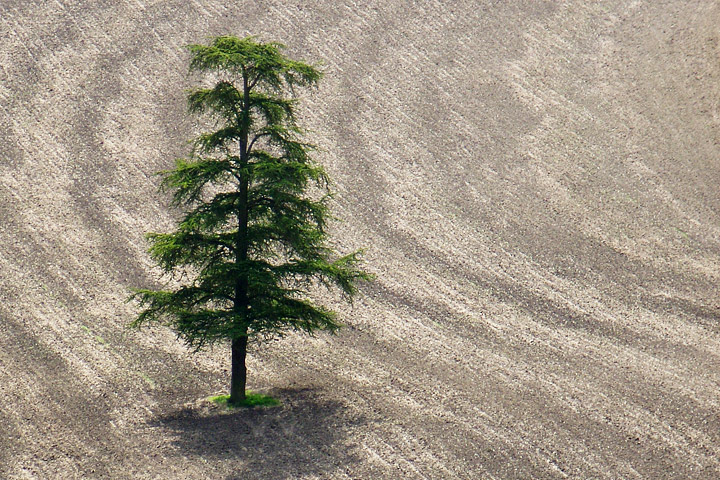
Can we grow our way out of carbon imbalance by making the landscape greener? Would it help to plant more trees or cut down fewer? And does it matter where they are? (Photograph ©2007 :Duncan.)
Scientists estimate that humans release about nine billion tons of carbon (mostly carbon dioxide) each year by burning fossil fuels and by changing the landscape. About four billion tons end up in the atmosphere and two billion tons dissolve in the ocean. The last three billion go into ecosystems on land, but exactly where these sinks are located remains an open question.
Forests are considered one of the world’s largest banks for all of the carbon emitted into the atmosphere through natural processes and human activities. They cover about 30 percent of Earth’s land surface, while accounting for 50 percent of plant productivity. As much as 45 percent of the carbon stored on land is tied up in forests.
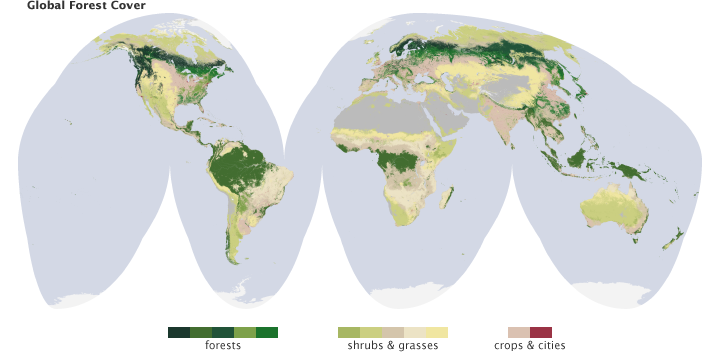
Forests cover 30 percent of the Earth’s land. (Map by Robert Simmon, based on data from the MODIS Land Cover Group, Boston University.)
Did forests hold more or less carbon in the past? Could they store more in the future? Scientists really don’t know exactly how much carbon our forests can hold.
What they do know is that human activities have moved a lot of carbon from long-term, stable storage—such as rocks, buried fossil fuels, and old-growth forests—into forms with short-term, direct impacts on the environment. For instance, when we clear forests, we remove tall trees that can store carbon in their trunks, branches, and leaves for hundreds of years. We often replace them with croplands or pastures that store less carbon for a shorter time. Paved developments store little to no carbon.
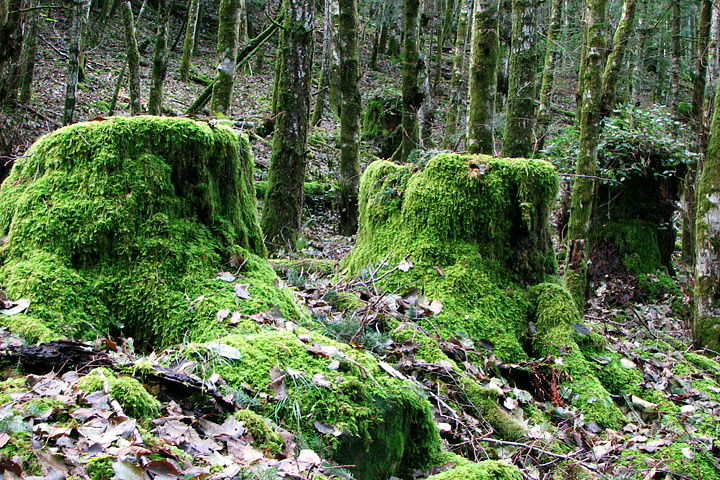
Eighty years after it was first cut, this forest in British Columbia still has not regained its former grandeur. (Photograph ©2007 Aviruthia.)
“The biggest natural sink of terrestrial carbon lies in our forests and trees,” says Steve Running, a forest ecologist at the University of Montana. “And the biggest natural source of carbon on land is also the forest. So one of the most important things we can do for understanding the carbon budget is to get a better inventory of the carbon we have in our trees.”
The key measurement is biomass, or the total mass of organisms living within a given area. A rule of thumb for ecologists is that the amount of carbon stored in a tree equals 50 percent of its dry biomass. So if you can estimate the biomass of all the trees in all the forests, you can estimate how much carbon is being stored on land. Repeating those measurements over years, decades, and centuries would then help us understand how carbon is moving around the planet.
Trees are often held up as a solution to our carbon budget problem. Making something like an economic argument, some people suggest that we can “grow” our way out of trouble by making (or keeping) the landscape greener. But would it help to plant more trees? To cut down fewer? And does it matter where those trees are?
The first step toward answering those questions is to figure out just how much carbon our trees store right now.
Scientists have used a variety of methods to survey the world’s forests and their biomass. They have systematically measured forests from the ground, venturing into the woods to count trees, measure trunks, and climb to the top of the canopy. Taking to airplanes, they have made photographic, radar, and lidar surveys of different types of forest.
With satellites, they have collected regional and global measurements of the “greenness” of the land surface and assessed the presence or absence of vegetation, while looking for signals to distinguish trees from shrubs from ground cover.
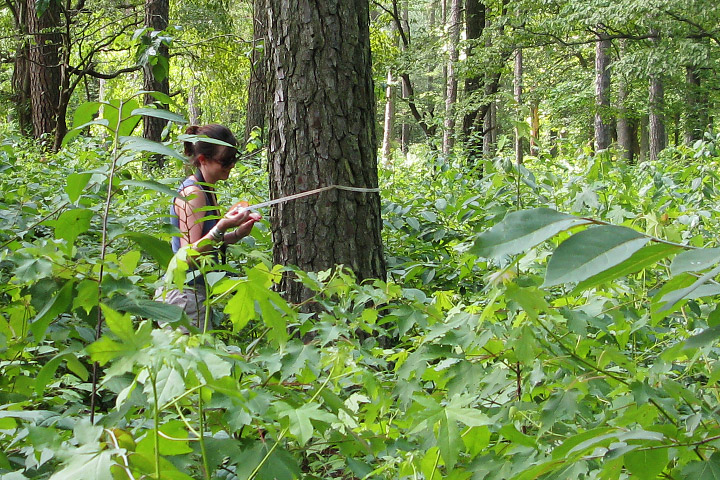
Student Kelly McManus measures the circumference of a tree in a coastal Virginia forest. Ground-based studies are crucial to ensure the accuracy of airborne and satellite-based studies of vegetation. (NASA photograph courtesy Lola Fatoyinbo.)
But to assess biomass, you have to know the area, density and, most importantly, the height of the trees. Researchers have achieved this on small scales, but to use the traditional methods on a global scale is prohibitively expensive and time-consuming.
“We need to see Earth’s vegetation in three dimensions,” says Jon Ranson, a forest ecologist based at NASA’s Goddard Space Flight Center. “By measuring the height of forests, we can then estimate above-ground biomass and estimate the carbon stored in that forest. The more accurate the measurements, the more certain our estimates of the carbon.”
The first map to estimate forest heights on a global scale came in 2010. Michael Lefsky of Colorado State University combined broad views of the horizontal land surface from the Moderate Resolution Imaging Spectroradiometer (MODIS) on NASA’s Terra and Aqua satellites with vertical height from NASA’s Ice, Cloud, and land Elevation Satellite (ICESat).
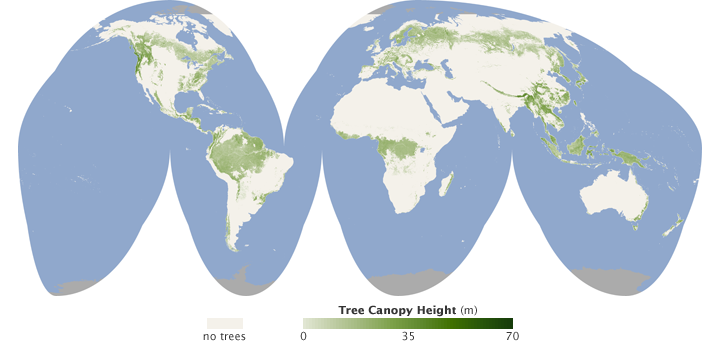
The height of the world’s forests range from over 40 meters in the U.S. Pacific Northwest, to just under 20 meters for the boreal forests that ring the Arctic. In this map, darker green relates to taller forests. [NASA Earth Observatory map by Jesse Allen & Robert Simmon, using data from Michael Lefsky, Colorado State University].
The result was a map showing the world’s tallest forests clustered in the Pacific Northwest of North America and in portions of Southeast Asia, with shorter forests covering broad swaths across Canada and Eurasia. The tallest tree canopies are the temperate conifer forests—full of Douglas fir, western hemlock, redwood, and sequoia—that often grow taller than 40 meters (131 feet). Boreal forests of spruce, fir, pine, and larch usually reach less than 20 meters (66 feet) into the sky. In the middle are the temperate, broadleaf forests of Europe and the United States and the undisturbed tropical rain forests, which both average 25 meters (82 feet) tall.
The backbone of the mapping effort was data from the Geoscience Laser Altimeter System (GLAS) on ICESat, which pulsed laser light at the planet’s surface more than 250 million times in its seven years of flight (2003-2009). Those pulses made direct measurements of 2.4 percent of Earth’s forest surfaces and measurements for 24 percent of the forest patches on surface. That left it to Lefsky to extrapolate and to work out mathematical model estimates for the forests surrounding the ICESat samples.
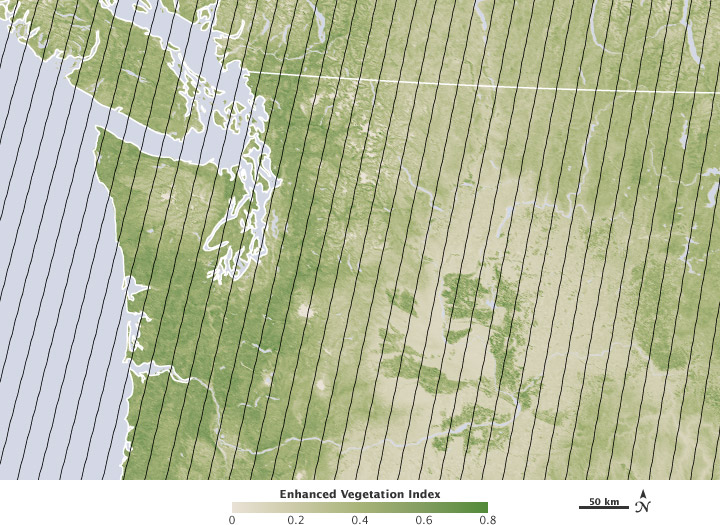
Michael Lefsky combined wide-scale observations of vegetation with precise laser measurements from ICESat, which were taken along narrow tracks (black lines), to construct a map of forest heights. (NASA map by Jesse Allen and Robert Simmon.)
The global map was the first of its kind, but Lefsky and colleagues knew there was still a lot of uncertainty to be cleared up with better instrumentation and coverage. “This is really a first draft,” said Lefsky, “and it will certainly be refined in the future.”
Sassan Saatchi, a remote sensing scientist at NASA’s Jet Propulsion Laboratory, is one of several collaborators and friendly competitors working on that next draft of forest maps. He is working with satellites to see the forests for the trees and the carbon. His focus has been the thick stands of trees around the mid-section of Earth.
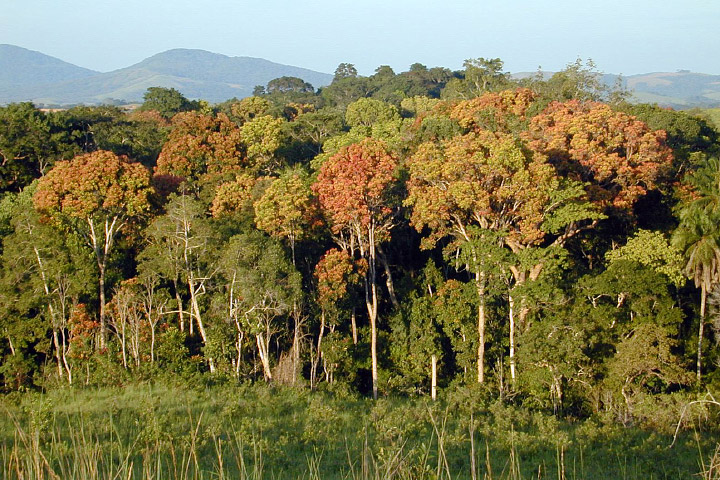
Tropical forests, such as those in Gabon, Africa, are an important reservoir of carbon. (Photography courtesy Sassan Saatchi, NASA/JPL-Caltech.)
“I first visited a tropical forest in 1994 for a project on the Bahian Coast of Brazil, and I was mesmerized by the complexity and beauty,” Saatchi says. “I fell in love with the landscape, with the biodiversity of plants and animals, and with the people. Every time you see a tropical forest, you find something new. For a person with a background in physics and mathematics, it is one of the most complex and challenging systems to understand and model.”
Because they grow year-round, tropical forests are believed to be the most productive on Earth. They store vast amounts of carbon in the wood and roots of their trees, though scientists have only been able to make broad, speculative estimates about just how much.
“In the northern forests of the United States, Canada, and Europe, there are usually sophisticated forestry systems to measure structure and biomass by state or region,” Saatchi says. “In the tropics, we often have no clue how forest carbon is distributed on a local level.”
What researchers do know is that tropical deforestation and forest degradation account for between 10 and 20 percent of all manmade emissions of carbon dioxide, a significant greenhouse gas. Images from satellites, the space shuttle, and the International Space Station have been showing the smoke plumes for decades. Deforestation is big business, as large-scale producers of palm oil, soybeans, beef, and leather add to the pressure on tropical forests from small farmers working to raise themselves out of poverty. Rising global demands for these commodities mean that these fires may not stop anytime soon.
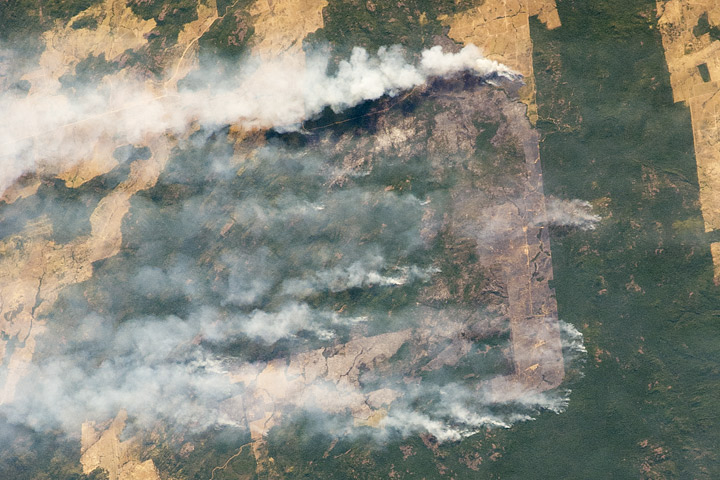
Fire is commonly used to clear forested land in the tropics. An astronaut aboard the International Space Station captured this photograph of burning in Brazil on August 14, 2010. (NASA astronaut photograph ISS024-E-11941, courtesy the NASA-JSC Earth Observations Lab.)
“Tropical forests have a high diversity of plants, and are extremely variable over the landscape and in their interaction with the climate, yet they are poorly measured and monitored,” Saatchi notes. “I have worked every measurement and mathematical tool I could muster to try to understand and map this complexity.”
Working with 14 colleagues from 10 institutions around the world (including Michael Lefsky), Saatchi set about compiling and analyzing measurements from four space-based instruments—the GLAS lidar on ICESat, MODIS, the QuikSCAT scatterometer, and the Shuttle Radar Topography Mission—and from 4,079 ground-based forest plots. The team mapped more than three million measurements of tree heights and correlated them to measurements of trees from the ground. They calculated the amount of carbon stored above ground and in the roots. And they extrapolated their results over forest areas where there is less ground sampling but some known characteristics.
The result, released in May 2011, was a benchmark map of biomass carbon stocks covering 2.5 billion hectares (9.65 million square miles) of forest in 75 countries on three continents. Though previous efforts have mapped tropical forests on regional or local scales, the new map is “the first effort to quantify the distribution of forest carbon systematically over the entire tropical region,” Saatchi says.
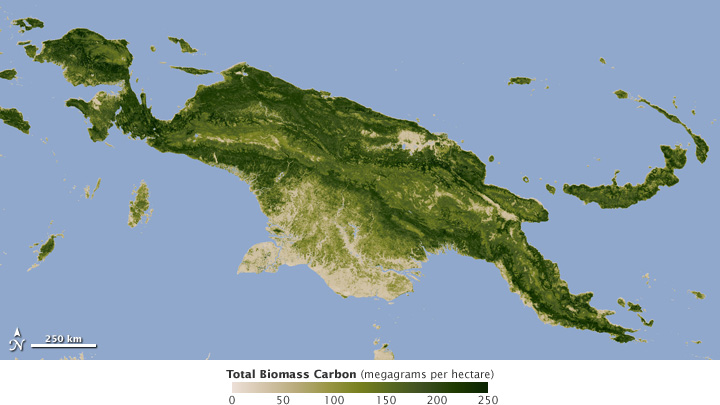
This map shows total carbon stored in biomass in New Guinea, a heavily forested island just north of Australia. (NASA map by Robert Simmon, using data from Saatchi et al., 2011.)
The researchers found that nearly 247 gigatons (billion tons) of carbon was sequestered in tropical forests, with 193 gigatons stored above ground in trunks, branches, and leaves, and 54 gigatons stored below ground in the roots. Forests in Central and South America accounted for 49 percent of the total, with Southeast Asia sheltering 26 percent and sub-Saharan Africa with 25 percent of the carbon storage.
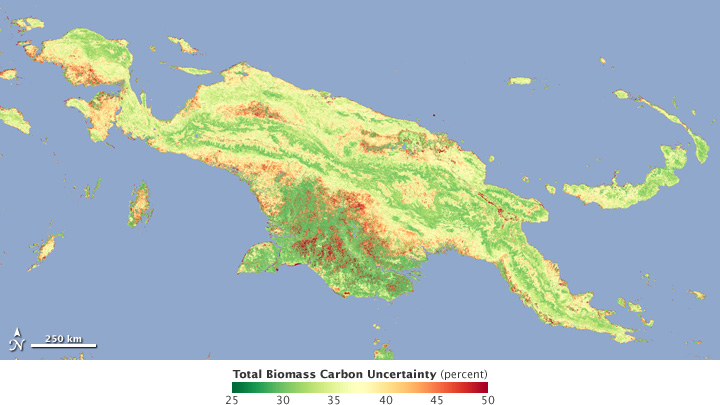
Almost as important as knowledge of the amount of biomass in an area is information about the uncertainty of the data. Areas of New Guinea where the carbon biomass is relatively well known are shown in green, while more uncertain measurements are orange and red. (NASA map by Robert Simmon, using data from Saatchi et al., 2011.)
Saatchi is most proud that his map not only assesses the carbon stock, but also gives a clear picture of the quality and certainty of the assessment. “Our map tells us the carbon at any location in the tropical forests and how certain we are about our estimation,” Saatchi says. The research team created mathematical models to show the margin of error in their carbon assessments. On the national and regional level, Saatchi says, the uncertainty is between 1 and 5 percent. “Given that biomass estimation from ground measurements has about a 10 to 20 percent error over large plots, our uncertainty in global mapping is very reasonable.”
Knowing something about the error bars is important for building confidence with resource managers and economists who are trying to assess the needs and values of forests. It is also important for pointing researchers to the areas where more work is needed.
“We can advance science by studying uncertainty, and the land part of the global carbon cycle is very uncertain,” Saatchi asserts. “Data collection on the ground is extremely limited because of the difficulty of access and the lack of infrastructure in most tropical regions—though that is something we do not necessarily want to change. Still, we really need more systematic and transparent measurements of tropical forest.”
“Resource managers need to see forests down to the disturbance resolution—the scale at which parking lots or developments or farms are carved out by deforestation,” says Josef Kellndorfer of the Woods Hole Research Center (WHRC). His research team recently took it down to that level when they released the National Biomass and Carbon Dataset (NBCD) for the United States in April 2011.
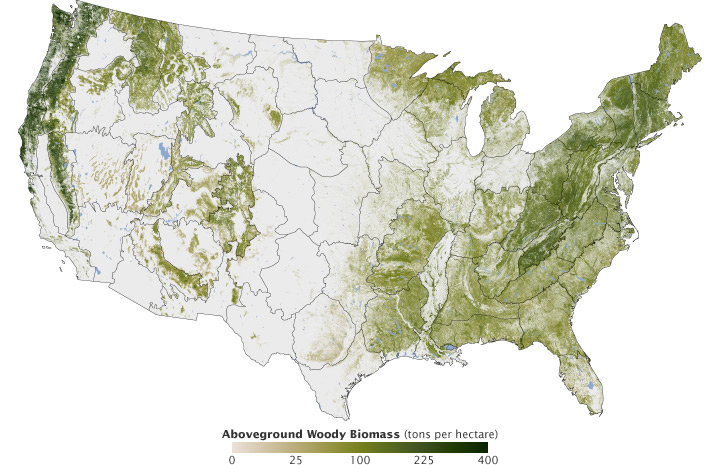
The National Biomass and Carbon Dataset (NBCD) is the largest high-resolution map of forest biomass yet assembled. Scientists at the Woods Hole Research Center created the map by combining satellite data with precise ground-based measurements. (Map by Robert Simmon, based on data from Woods Hole Research Center.)
“We are providing information on a management scale,” Kellndorfer notes. Forests in the U.S., as well as their carbon content, are mapped down to 30 meters, or roughly 10 computer display pixels for every hectare of land (4 pixels per acre). “This data set is a comprehensive view of forest structure and carbon storage, and it provides an important baseline for assessing changes in the future.”
Over six years, Kellndorfer, Wayne Walker, and their Woods Hole team collaborated with the U.S. Forest Service and the U.S. Geological Survey (USGS) to assemble a national forest map from space-based radar and optical sensors, computer modeling, and a massive amount of ground-based data. They divided the country into 66 mapping zones and ended up mapping 265 million segments of the American land surface. Kellndorfer estimates that the mapping database includes measurements of about five million trees.
The researchers started with data from the Shuttle Radar Topography Mission, which was flown on the space shuttle Endeavour in 2000. With that space radar, the USGS and NASA’s Jet Propulsion Laboratory constructed topographic maps of nearly all of Earth’s land masses from 60 degrees north latitude to 60 degrees south.
By 2005, Kellndorfer deciphered signals (the scattering surfaces) in the electromagnetic waves detected by the radar—data that revealed the height of the vegetation. Subtracting the height of the treetops from the elevation of the land, the scientists could estimate the height and density of the woody plants, trees, and shrubs covering the surface.
But those numbers were only the beginning. Kellndorfer’s team combined their data with the National Land Cover Database, which was built from Landsat satellite images of Earth’s surface. They examined the biology and geology of their picture. How do different land elevations affect the height and thickness of trees? What can and cannot grow at certain elevations?
The last piece of the puzzle was ground truth. Kellndorfer enlisted the aid of Elizabeth LaPoint and colleagues in the Forest Inventory and Analysis program of the U.S. Forest Service. The federal foresters keep a census of the nation’s trees, maintaining a survey plot for every 6,000 acres of woodland, and measuring the trees within that plot at least once every five years.
Those plots, however, are not available for direct survey or study by Kellndorfer or anyone outside the service—a safeguard to protect the integrity of the data set and the rights of private property owners. So the Woods Hole team prepared thousands of data sets with 15 to 20 variables that LaPoint could compare to the forest inventory.
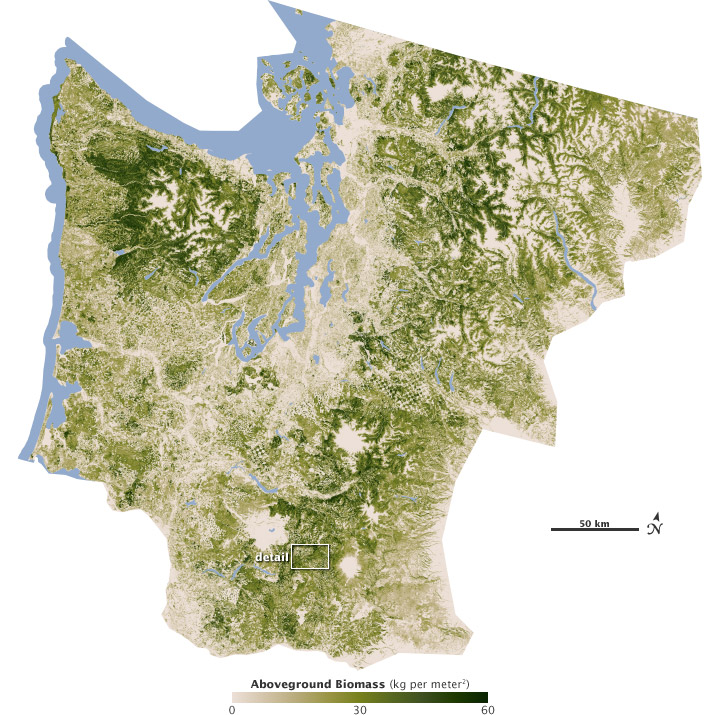
In the end, the research team was able to construct a map with higher resolution and more precise detail than any large-scale map of forest biomass ever made. The map reveals the checkerboard patterns of logging in the old growth of the Pacific Northwest and the highly managed tree farms of the Southeast. In the Midwest, trees outline the rivers and the edges between farms, while forests re-emerge on land that was once cleared for crops. In the Mid-Atlantic and New England, lands that were stripped bare in the early years of the nation are now tree-covered again—though with many urban developments amidst the forest.
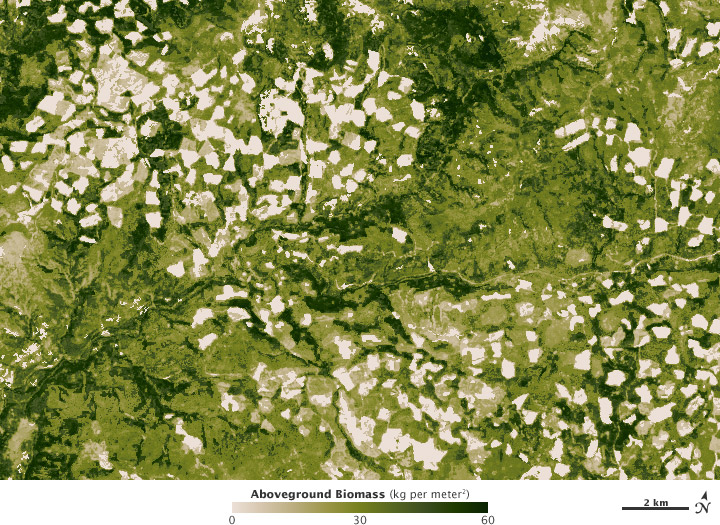
At full resolution, the NBCD shows logging on the scale of individual plots. (Map by Robert Simmon, based on data from Woods Hole Research Center.)
“Forests are a key element for human activity,” says Kellndorfer. “So we have to know how much we have, and where, in order to conduct sound management and harvesting. This map gives us another tool to see our precious resource.”
Lidar, radar, visible-light imagery, ground surveys, and computer models all bring slightly different answers to the same problem. Three different teams produced three different forest and carbon maps in a fifteen-month span. Groups at Stanford, the European Space Agency, Brazil, the U.S. Forest Service, and dozens of other institutions are pursuing similar questions, sometimes as competitors, sometimes as collaborators.
From a distance, the research can sometimes appear redundant. But parallel approaches and competition have always been the recipe for innovation and deeper understanding.
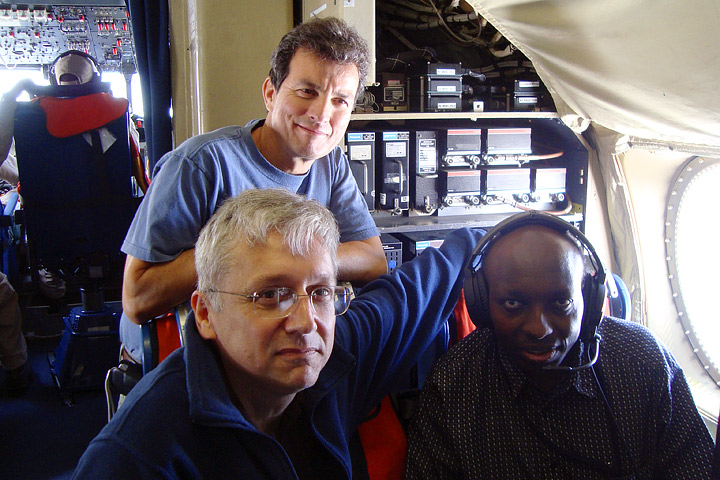
David Harding (left), Charles Gatebe (right), and Rafael Rincon (back) were three of the lead scientists on the Eco 3D field campaign. Each of the researchers was responsible for a different instrument. Understanding of the world’s forests is improved by multiple groups looking at the problem from varying perspectives. (NASA photograph courtesy Jon Ranson, GSFC.)
“It’s similar to cancer research, where you have different laboratories and different countries pursuing the same problem,” said Jon Ranson. “Everyone is looking with a slightly different angle and methodology. Groups are collaborating as much as they can, and taking the data that are available and making the best of it. In the end, it’s complementary and it improves the overall science.”
The ultimate prize is a uniform, standardized map of forest heights and carbon stocks on all continents at one time. And that map should be updated and revised as human activities renovate our planet.
“We have a pretty good handle on forest area worldwide, but not as great a sense of the structure or the changes,” says Steve Running, a member of the Intergovernmental Panel on Climate Change. “We need a better global, annual measure of our carbon stocks. We need to know how things change each year through fire, new growth and re-growth, desertification, and deforestation.”
“How do we cover the whole world,” Running adds, “and do it every two to three years, which is what the science needs?”
The number of options for space-based mapping has gotten smaller. The ICESat mission ended in 2009. Its follow-on, ICESat II, is slated for launch in 2016, but will not necessarily be able to view forests in the same way as its predecessor. The synthetic aperture radar used for the Shuttle Radar Topography Mission provided a global picture of Earth’s landscape structure in early 2000; but the space shuttle was retired in July 2011. A similar technology could provide forest structure and cover globally every year if launched on the space station or another satellite.
Many forest researchers and ecologists were counting on a mission that was proposed years ago and recommended by the National Research Council in 2007—the Deformation, Ecosystem, Structure, and Dynamics of Ice satellite. DESDynl would combine radar and lidar technologies to get a three-dimensional view of forests and their carbon stock. But that mission was put on indefinite hold in the spring of 2011 as the U.S. government made deep budget cuts. Researchers are now looking for other means to fly those instruments in space.
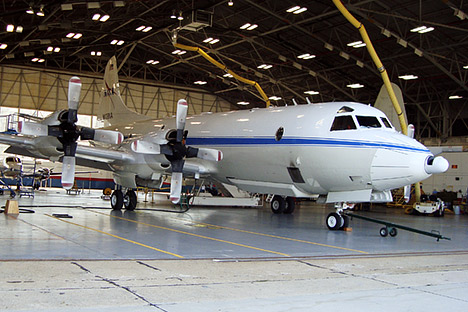
NASA researchers use instrumented aircraft—such as the P3 Orion—to make measurements that supplement and bridge the gap between satellite missions. (NASA photograph courtesy Jon Ranson, GSFC.)
Ranson and colleagues Doug Morton, Bruce Cook, Ross Nelson, and others at NASA Goddard have picked up the effort to find a way forward. Since August 2011, they have been flying developmental instruments on NASA research airplanes, crisscrossing the eastern United States and taking stock of everything from sub-tropical wetlands to boreal forests. The team has been flying over Forest Inventory and Analysis plots in Maine, New Hampshire, Pennsylvania, Maryland, Virginia, North Carolina, and Florida, while flying under the old satellite tracks of ICESat. The team intends to calibrate their data against measurements from ICESat, Cook says, “and see if we can detect changes as we re-fly over an area.”
In the summer of 2011, Ranson led the Eco-3D mission to measure forests in the eastern U.S. and Canada with three main instruments—radar, lidar, and a radiometer. The Digital Beamforming Synthetic Aperture Radar (DBSAR) provides a broad, horizontal view, distinguishing forest from other land cover and giving a sense of the biomass density. The Slope Imaging Multi-polarization Photon-counting Lidar (SIMPL) measures the forest canopy height and structure, while also providing clues about the types of trees being measured. The Cloud Aerosol Radiometer (CAR) measures the light reflecting properties of the leaves and landscape, which tells researchers about the composition and health of the forest.
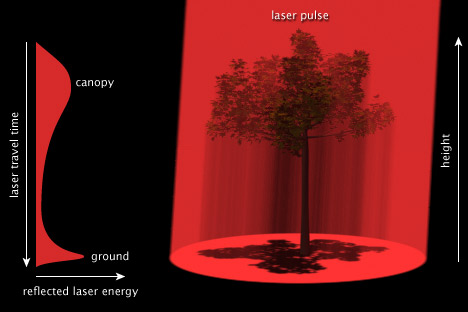
Lidar instruments measure tree height by bouncing laser light off the canopy. (NASA image by Robert Simmon.)
Beyond Eco-3D, the Goddard team has been working with partners in Canada and Brazil to improve airborne forest mapping, which may be the best method the world will have until a space-based lidar and radar can be flown again.
“It’s amazing how many people really need our data,” Saatchi notes. “I’ve been getting bombarded by emails from people who want these maps.”
Kellndorfer’s inbox is full, too. Hundreds of ecologists, forest managers, academic scientists, city planners, land conservation groups, timber companies, climate modelers, civil engineers, biologists, and fish and game managers have sought maps on an almost daily basis. More are likely to come as international negotiators move closer to treaties and economic markets for managing carbon emissions and storage.
New information about forests around the world will help society predict and respond to climate change, both natural and man made. (Photograph ©2006 *clairity*.)
“The work we’re doing can help put an economic value on forests,” says Goddard’s Doug Morton. “Policymakers and economists want to know forest carbon stocks at very fine spatial scales, and countries naturally need to improve their assessment of stocks to participate in a forest carbon market. This is a high-stakes game in the policy realm.”
Developing countries are taking stock of the carbon in their forests as part of an effort in climate change mitigation called Reducing Emissions from Deforestation and Degradation, or REDD+. Scientific partners from the United States and Europe are often called on for technological assistance.
“Carbon trading markets are going to be partly based on selling credits for forests,” says Running. “If there is going to be billions of dollars in carbon trading, then knowing where the carbon is and how much of it there is takes on huge political and economic importance. We need a coordinated, global monitoring plan in order to make it legitimate.”
