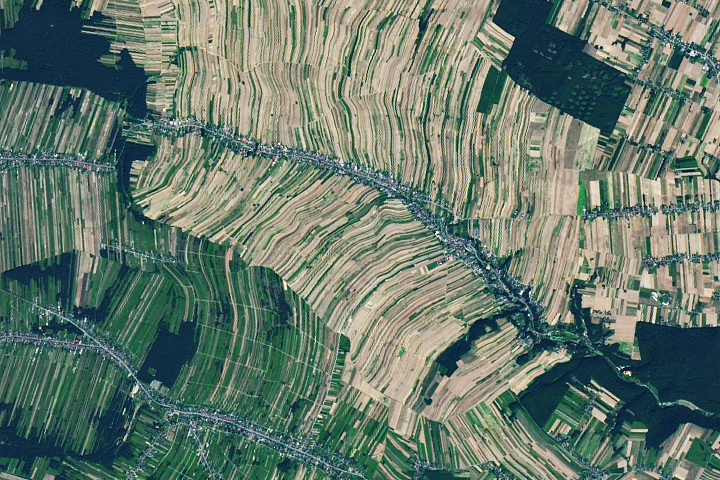
Repeated land divisions over centuries have created a complex mosaic of ribbon-like fields in southern Poland.

Abundant rain in Queensland overfilled rivers, flooded towns, and submerged livestock grazing lands.
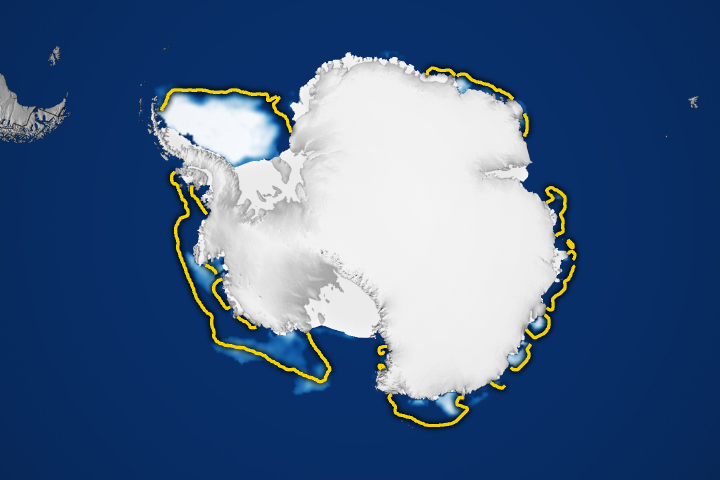
The region’s ice extent on March 1 tied for the second-lowest minimum observed in the satellite record.
Published Apr 2, 2025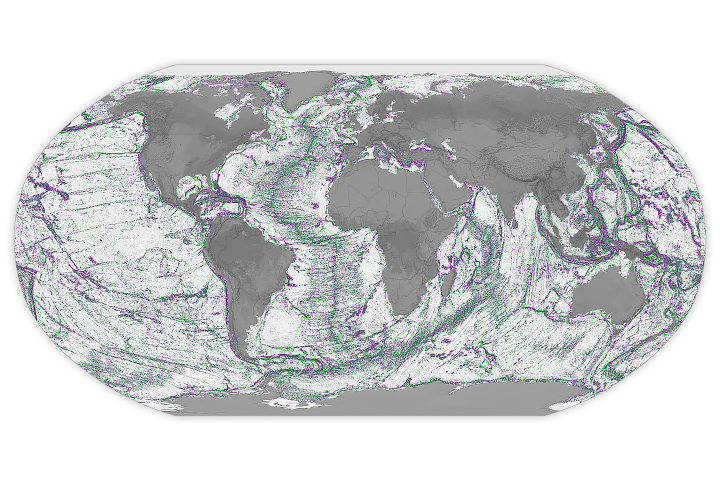
Depictions of the seafloor derived from satellite data can improve underwater navigation and increase knowledge of how heat and life move around the world’s ocean.
Published Apr 1, 2025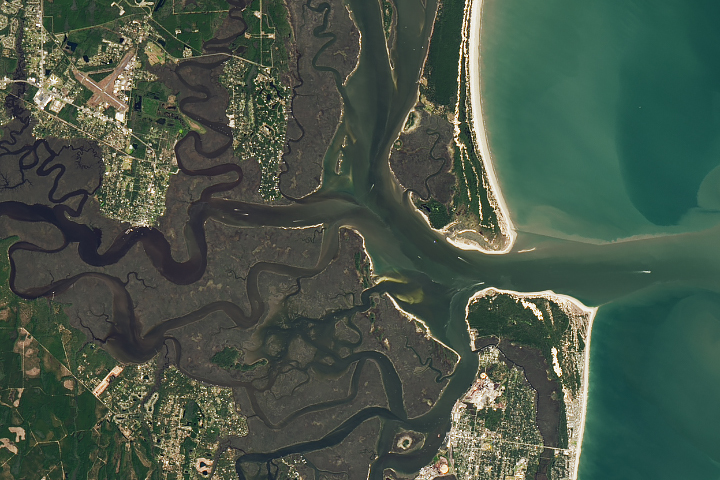
The right climatic and geographic conditions in the southeastern U.S. have allowed mangroves to migrate northward to Georgia.
Published Mar 31, 2025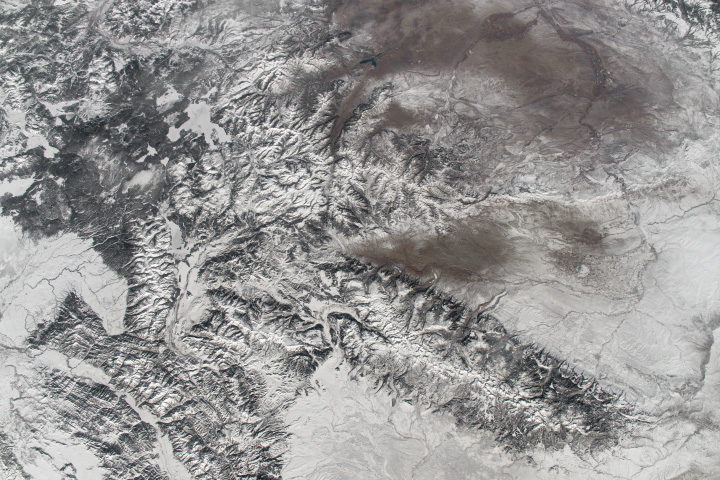
Gateway towns in Wyoming and Montana flank the Rocky Mountains and provide an access point to Yellowstone and Grand Teton national parks.
Published Mar 30, 2025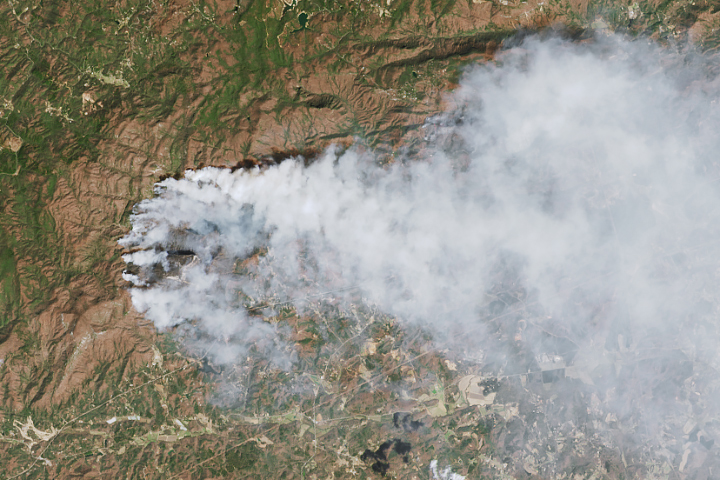
In late March 2025, several blazes burned in the western Carolinas and northeastern Georgia amid windy, dry conditions.
Published Mar 28, 2025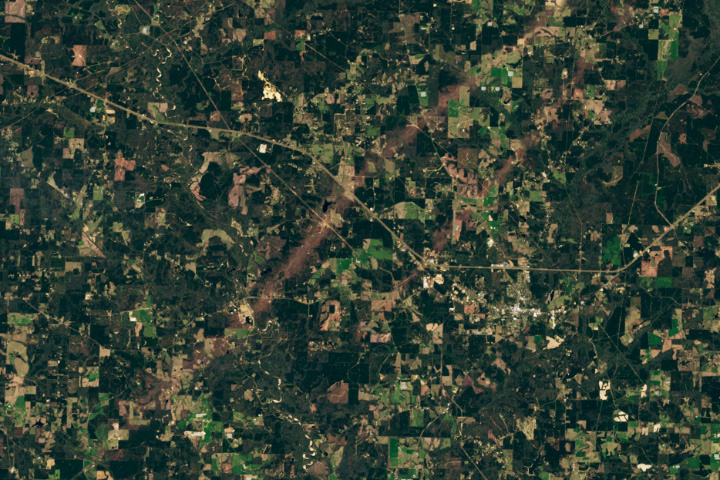
Tracks of damage extended dozens of miles after 18 tornadoes plowed through several parts of the state.
Published Mar 27, 2025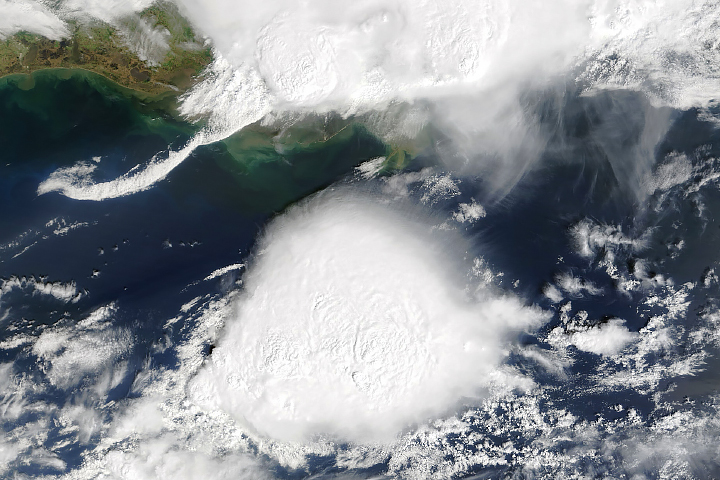
The severe weather delivered large hail and damaging wind to parts of the state.
Published Mar 26, 2025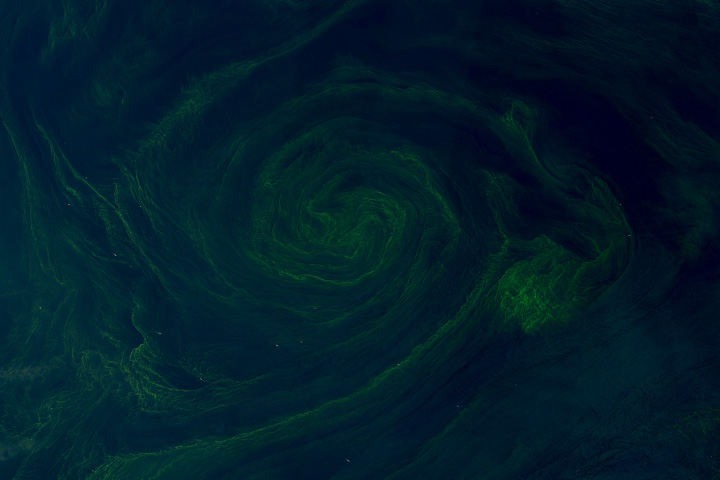
In the Gulf of Oman, eddies drew seasonal phytoplankton blooms into mesmerizing whirls.
Published Mar 25, 2025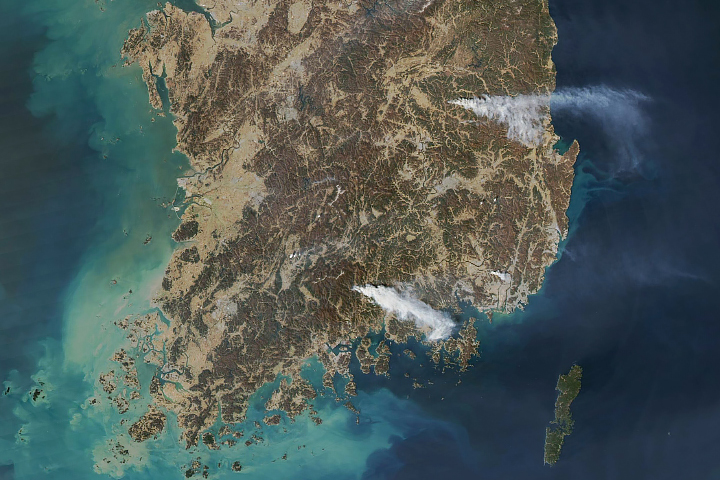
Several wildland fires burned amid dry and windy conditions in the country’s southeast.
Published Mar 24, 2025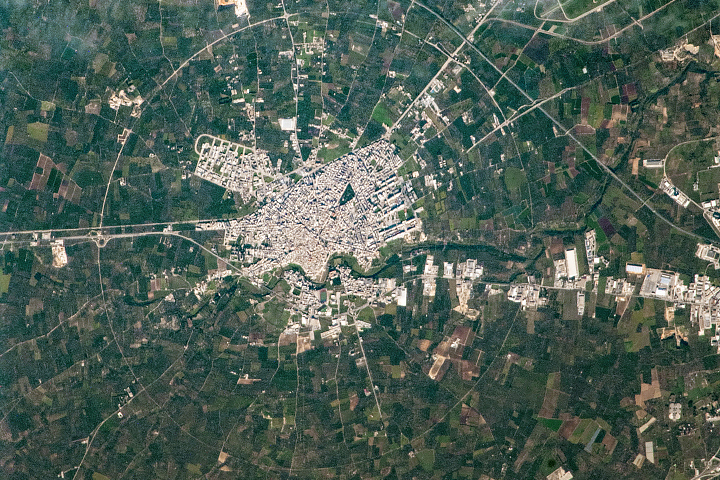
The Italian region displays a network of lines—and one nearly perfect circle—that connect inland settlements and agricultural areas with the bustling Adriatic coast.
Published Mar 23, 2025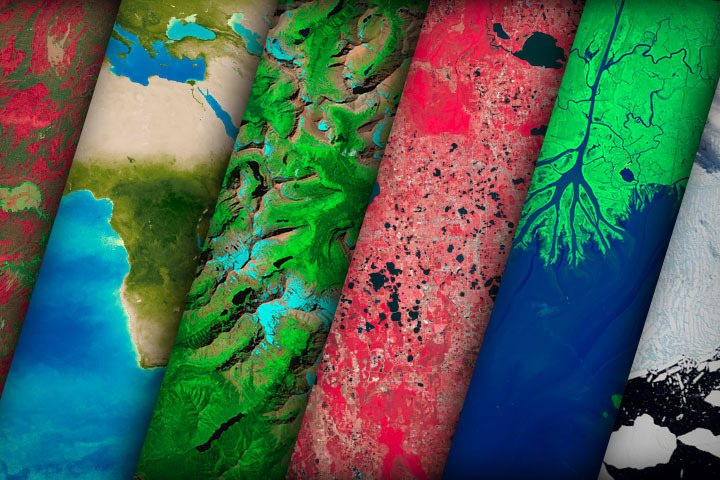
NASA satellites document how our world—forests, oceans, human landscapes, even the Sun—changes over months, seasons, and years.
Published Apr 29, 2009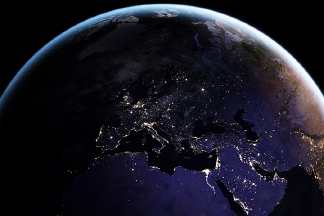
Satellite images of Earth at night have been a curiosity for the public and a tool of fundamental research for at least 25 years. They have provided a broad, beautiful picture, showing how humans have shaped the planet and lit up the darkness.
Published Apr 12, 2017
Chlorophyll is used by algae and other phytoplankton--the grass of the sea--to convert sunlight and carbon dioxide into sugars. These maps show chlorophyll concentrations in the ocean, revealing where phytoplankton are thriving.

These maps depict anomalies in land surface temperatures (LSTs); that is, how much hotter or cooler a region was compared to the long-term average. LST anomalies can indicate heat waves or cold spells.
Have you ever wondered what it would be like to live in a different part of the world? What would the weather be like? What kinds of animals would you see? Which plants live there? By investigating these questions, you are learning about biomes.
Published Aug 28, 2020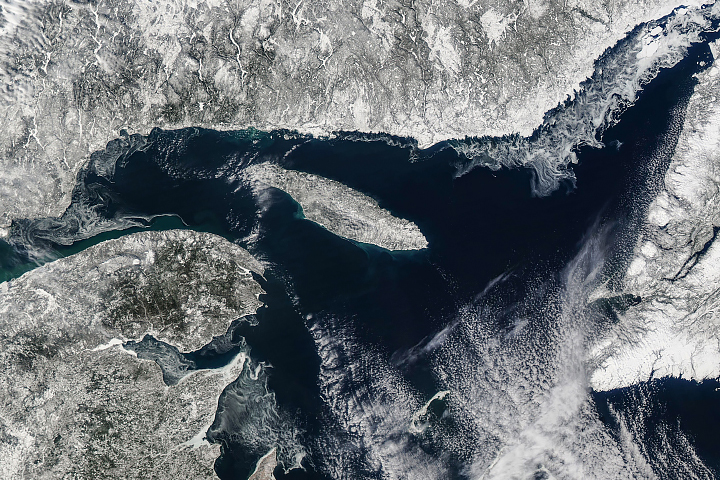
The body of water off eastern Canada is one of the southernmost locations where Arctic sea ice forms, but its extent in winter 2024-2025 was well below normal.
Published Mar 21, 2025
In addition to making rain and snow, clouds can have a warming or cooling influence depending on their altitude, type, and when they form. These maps show what fraction of an area was cloudy each month.
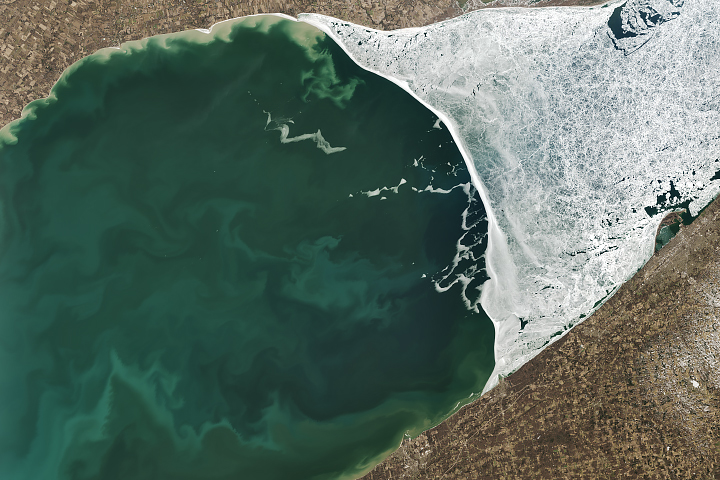
As winter turned to spring, ice cover on the lake diminished to reveal colorful billows of sediment and phytoplankton.
Published Mar 20, 2025
Your challenge is to tell us the location of the satellite image and why it is interesting.
Published Mar 11, 2025
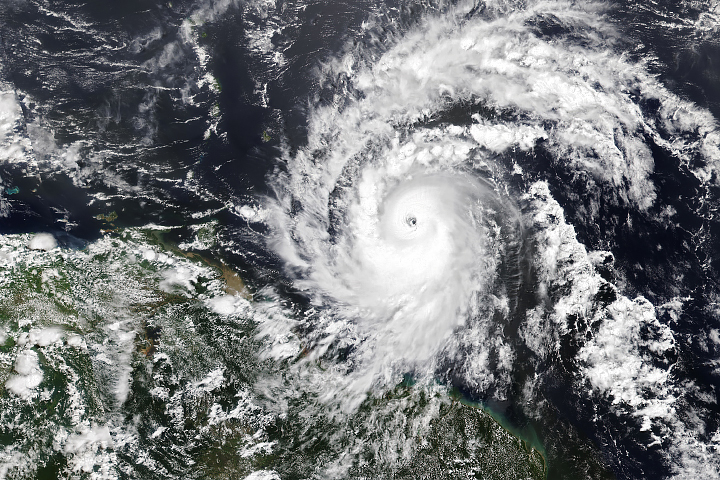
Hurricane season in the basin runs from June 1 to November 30.
Published Jul 1, 2024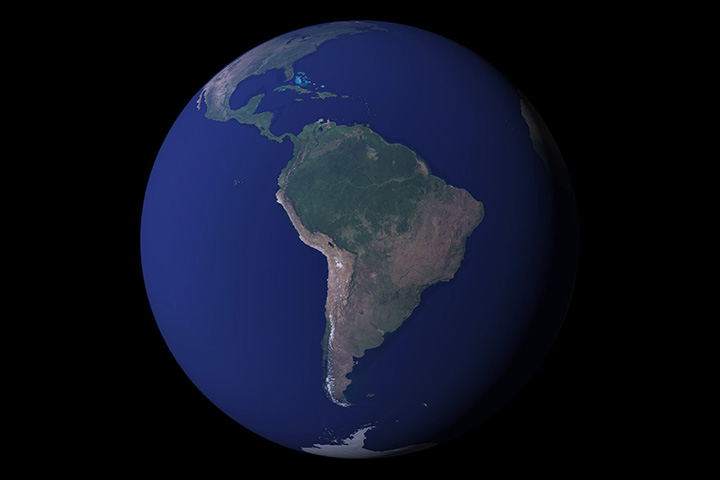
12 months of high-resolution global true color satellite imagery.
Published Oct 13, 2005
These maps depict how much hotter or cooler an ocean basin was compared to the long-term average. Temperature anomalies can indicate changes in ocean circulation or the arrival of patterns like El Niño and La Niña.
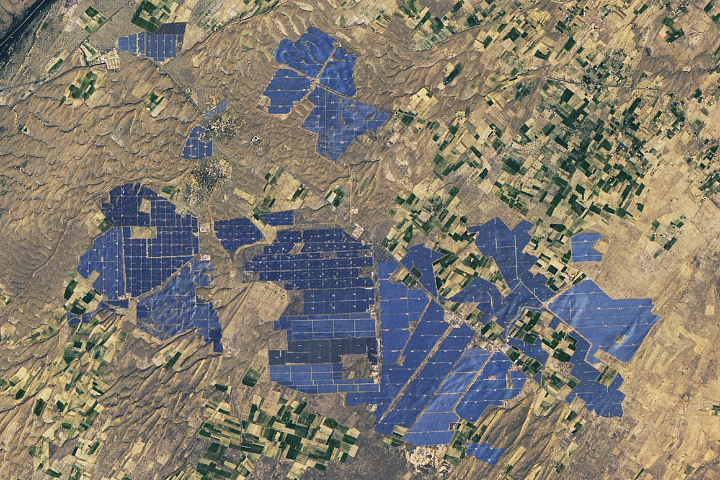
People have developed systems to harvest and store energy from sources such as wind, sunlight, and tidal action. Many of these installations are visible from orbit.
Published May 10, 2024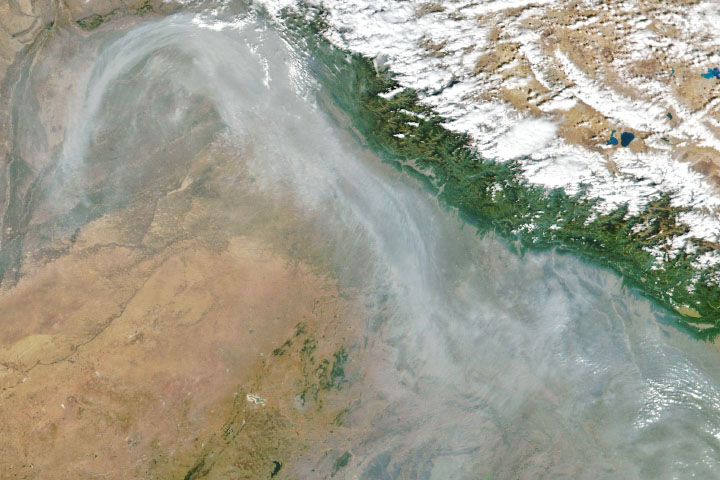
From ground-level ozone to particulate matter to nitrogen dioxide, an array of gasses and particles can affect the air people breathe, with implications for human health.
Published Apr 8, 2024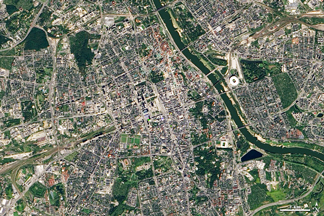
What do you do when presented with a new satellite image? Here's what the Earth Observatory team does to understand the view.
Published Nov 18, 2013
These maps show the average amount of water vapor in a column of atmosphere by month. Water vapor is the key precursor for rain and snow and one of the most important greenhouse gases in the atmosphere.
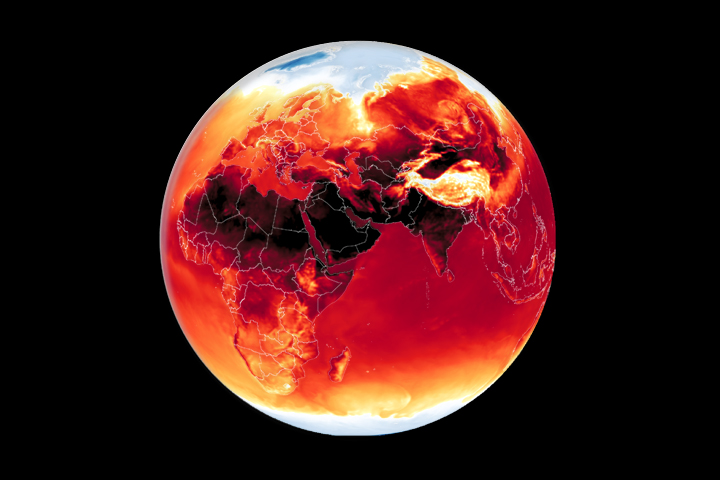
Warmer-than-average temperatures are showing up locally and globally, with consequences for people, landscapes, and ecosystems.
Published Mar 26, 2024
These maps depict monthly total rainfall around the world. Rainfall is the primary source of fresh water for humans, plants, and animals. Rain also moves heat between the atmosphere, oceans, and land.

Whether sparked by lightning, intentional land-clearing, or human-caused accidents, wildland fires are burning longer and more often in some areas as the world warms.
Published Feb 27, 2024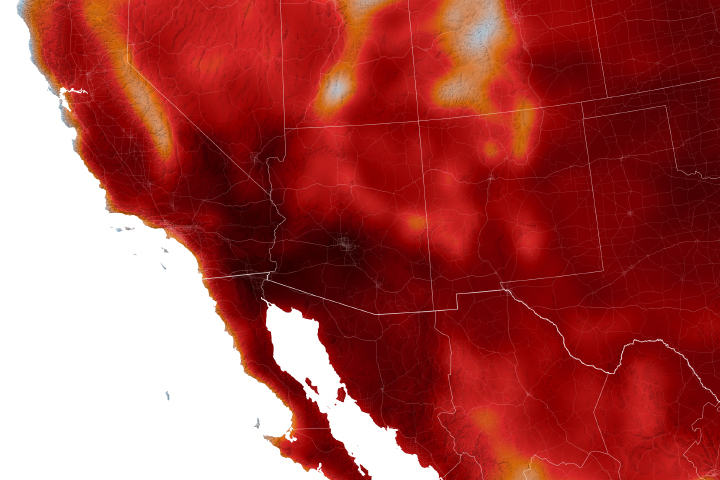
Warmer-than-average temperatures are showing up locally and globally, with consequences for people, landscapes, and ecosystems.
Published Aug 15, 2023


