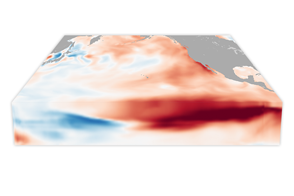
With its own forms of underwater weather, the ocean has fronts and circulation patterns that move heat and nutrients around its basins. Changes near the surface often start with changes in the depths.
Published Mar 21, 2017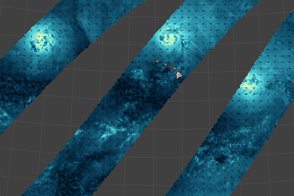
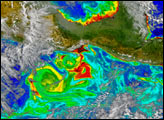
A map reveals the wind fields of storms that marched across the Pacific Ocean in late summer 2015.
Published Sep 4, 2015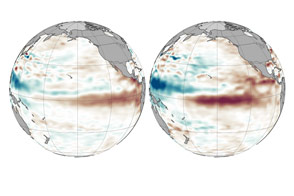
Weakening trade winds are allowing warm water to move east across the Pacific in a telltale pattern.
Published Aug 5, 2015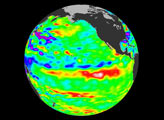
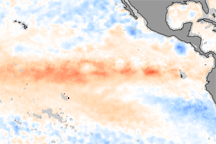
These color-coded images show the strengthening of El Niño between October and November 2009. In the November image, warm waters (indicated in red) have spread across the Pacific.
Published Dec 11, 2009
La Niña, the large area of cold water in the Pacific Ocean widely blamed for last summer's drought and often related to an increase in the number of hurricanes that make landfall, appears to be on its last legs.
Published May 10, 2000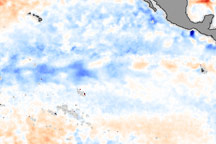
La Niña is an occurrence of unusually cold water temperatures in the Pacific Ocean along the equator (the precise area affected is outlined in black in the image above). La Niña and its opposite, El Niño, are linked to seesaw variations in air pressure over the tropical Pacific and affect weather patterns across the globe. NASA monitors developing El Ni&ntidle;o and La Niña events by observing sea surface temperatures. This image compares the water temperatures observed in late January 2006 to long-term average conditions for that time of year. The recent data were collected by the Advanced Microwave Scanning Radiometer for EOS (AMSR-E). Red shows where sea surface temperatures are warmer than normal and blue where they are colder than normal.
Published Feb 9, 2006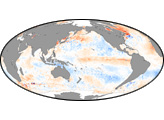
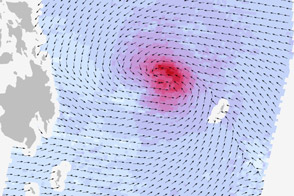
A radar on the Indian satellite Oceansat-2 measured the winds of the super typhoon on November 7, 2013.
Published Nov 13, 2013