October broke a 16-month streak of warmer than average temperatures in the contiguous United States. Nevertheless, 2012 was poised to go down as the warmest year on record.
Published Nov 16, 2012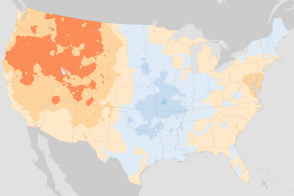
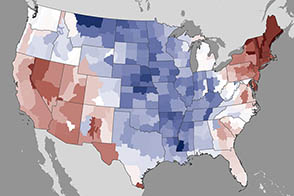
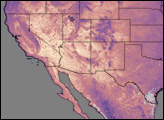
These maps compare January minimum temperatures and July maximum temperatures in the U.S. Climate Normals, a 30-year frame of reference. The new normal reflects a warming world.
Published Jul 6, 2011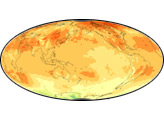
These images show temperature trends in two thick layers of the atmosphere as measured by a series of satellite-based instruments between January 1979 and December 2005.
Published Jul 6, 2007
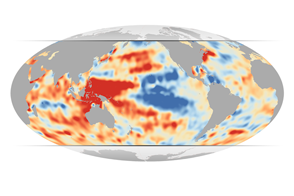
Examining temperatures from the depths of the ocean, JPL scientists have found that lower layers of the Western Pacific and Indian Oceans grew much warmer during a decade when surface temperatures cooled.
Published Jul 10, 2015
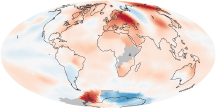
This color-coded map shows temperature anomalies for July 2010. Areas with above-average temperatures appear in shades of red, and areas with below-normal temperatures appear in shades of blue.
Published Aug 18, 2010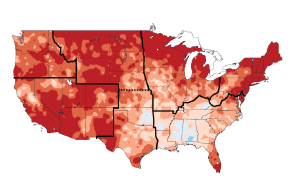
Climate change is already affecting the American people in far-reaching ways, says a new climate report.
Published May 8, 2014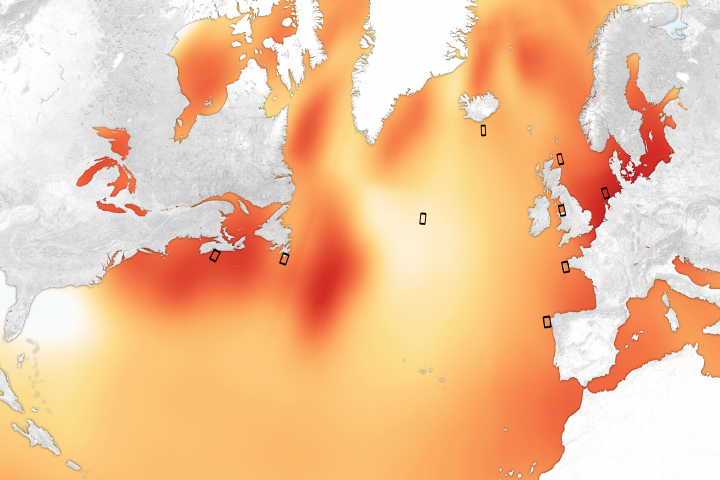
Increasing numbers of Vibrio infections could be a direct consequence of dramatic ocean warming over the past few decades.
Published Jan 17, 2018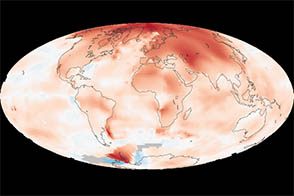
Temperatures are warming faster in the Arctic than anywhere else in the world. Here’s why.
Published May 26, 2013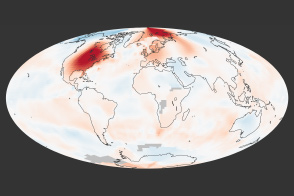
Temperatures were well above the norm for the month, setting records and rising well above the long-term trends.
Published Apr 17, 2012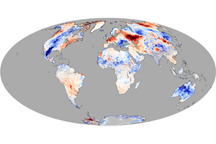
This color-coded map shows above- and below-normal temperatures in early July 2010, when a heat wave struck much of North America and Eurasia.
Published Jul 16, 2010