Satellites help land managers and city planners track city growth and ecosystem health around Portland, Oregon.
Published Aug 2, 2012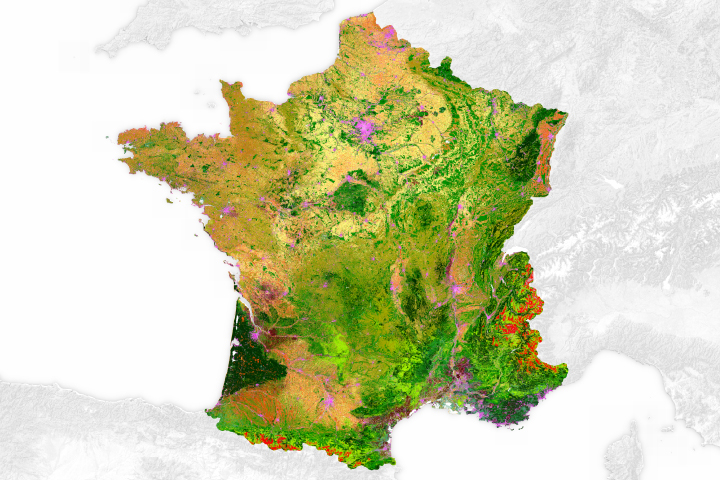
From vineyards to roadways, this map paints a detailed picture of surface types found across the country.
Published Aug 15, 2017
A series of maps showing land use in 1850 and 1920.
Published Feb 9, 2008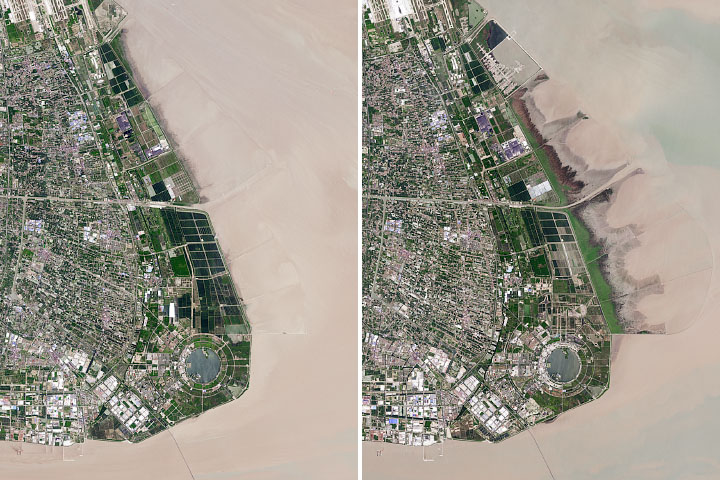
The Chinese city has reclaimed land from shallow coastal waters at a rapid rate.
Published Dec 11, 2019
This series of maps shows how much the landscape of the eastern United States changed between 1650 and 1992. The maps depict canopy height, the height of the tallest continuous layer of vegetation.
Published Feb 2, 2008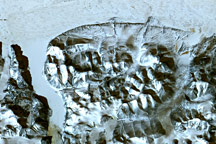

Unlike the vegetated tundra of its neighboring islands, Bunge Land is a barren sandy plain that also serves as a land bridge.
Published Oct 5, 2020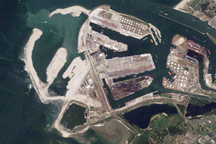
Acquired in 2006, 2009, and 2010, these natural-color images show the progress of land reclamation aimed at increasing the port capacity at Rotterdam.
Published Nov 28, 2010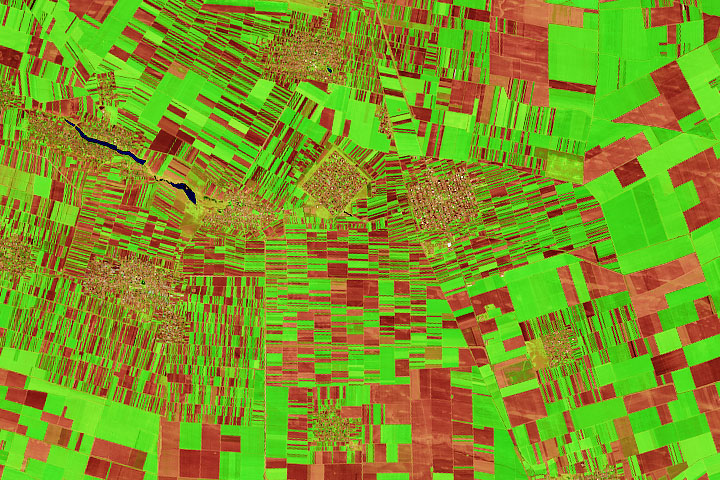
Farms in the historic Oltenia province display a compelling array of shapes and sizes.
Published Oct 14, 2020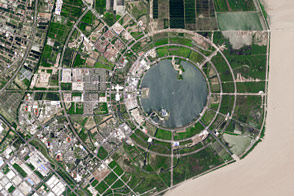
Seawalls and dredging have created new real estate along the city’s coastlines.
Published Mar 31, 2017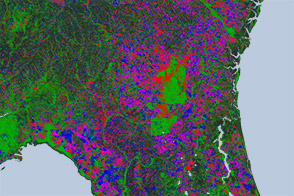
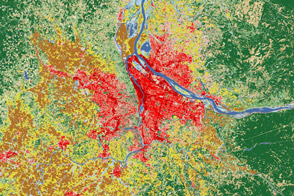
Open-access data from the NASA-USGS Landsat mission and cloud computing make for a highly detailed view of gains and losses in global and regional tree cover since 2000.
Published Nov 16, 2013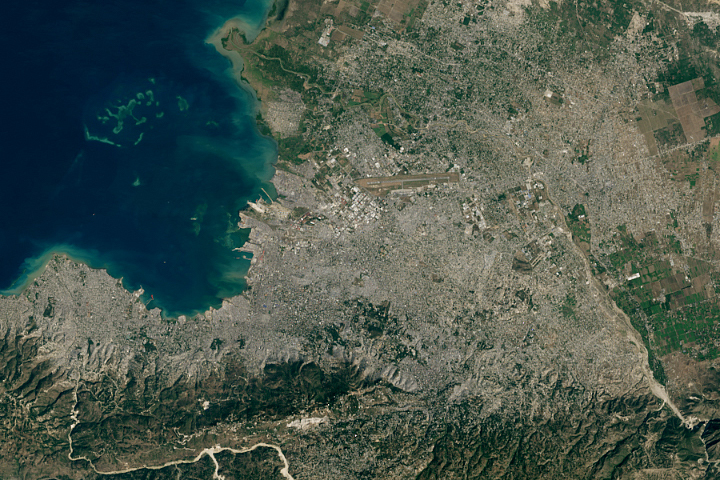
After a catastrophic earthquake left Port-au-Prince in a shambles, many people flocked to the new city of Canaan in search of a better life.
Published Jun 1, 2020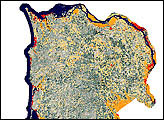
Scientists at the U.S. Forest Service and the Bureau of Land Management are using satellites -- Landsat 5 and Landsat 7 -- to determine where spotted owls are likely to nest.
Published Jun 23, 1999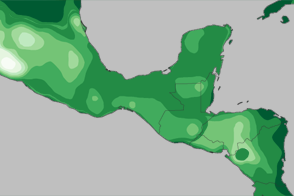
What did Central America look like at the height of the Mayan civilization? Probably different than you think.
Published Feb 2, 2012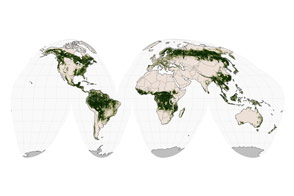
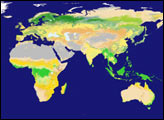
Differences in how international and national institutions classify forests can lead to large discrepancies in measurements of land cover.
Published Nov 17, 2015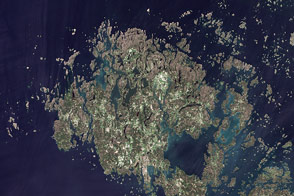
This summertime, natural-color image shows the Åland Islands between Sweden and Finland.
Published Sep 20, 2011
What does Landsat have in common with the Gutenberg Bible, Tolstoy’s personal library, and the Book of Kells?
Published Nov 24, 2011