New elevation measurements will give researchers an unprecedented understanding of the thickness of sea ice, which will be used to help improve climate modeling and forecasts.
Published Dec 18, 2018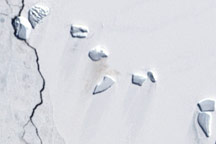
A guano stain betrays the location of an emperor penguin colony on Antarctic ice in this Landsat image from December 4, 2002.
Published Jun 5, 2009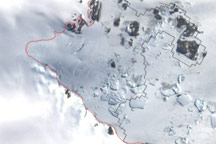
This image shows the latest estimate of the ice edge around Law Promontory, which juts out from East Antarctica’s coastline near Stefansson Bay.
Published Jul 23, 2010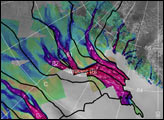
The image above depicts the region of West Antarctica where scientists measured ice speed. The fast-moving central ice streams are shown in red. Slower tributaries feeding the ice streams are shown in blue. Green areas depict slow-moving, stable areas. Thick black lines depict the areas that collect snowfall to feed their respective ice streams.
Published Jan 25, 2002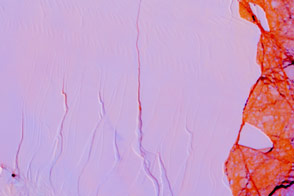
The impending birth of a big, new iceberg from Antarctica’s Larsen C Ice Shelf will not have an immediate effect on sea level, but it could be an indicator of future problems.
Published Apr 14, 2017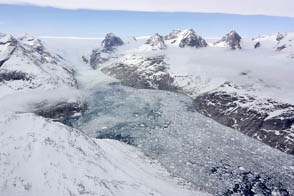
NASA aircraft return to the Arctic to assess the health of the region’s ice.
Published May 3, 2012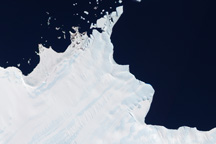
Located in East Antarctica, Astrolabe Glacier streams out from the interior of Antarctica to dump ice into the sea.
Published Mar 26, 2011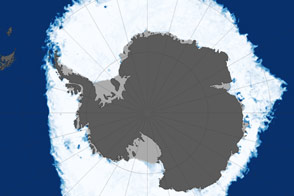
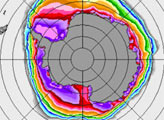
This map shows sea ice extent around Antarctica on September 22, 2013, when ice covered more of the Southern Ocean than at any other time in the satellite record.
Published Oct 1, 2013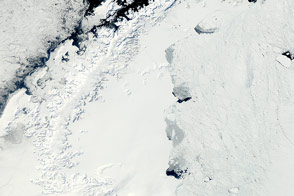
The MODIS instrument on NASA’s Aqua satellite captured this clear view of the Antarctic Peninsula, the Larsen Ice Shelf, and the sea ice covered waters around the region in October 2011.
Published Oct 15, 2011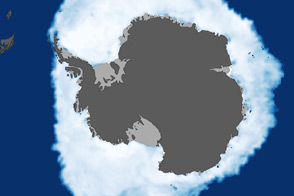
As the Arctic experienced a new record summer minimum for ice extent, the Antarctic set a new record for maximum winter sea ice.
Published Oct 11, 2012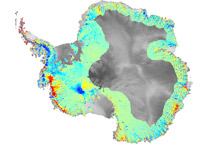
To understand how fast-moving glaciers are changing the ice sheets, scientists devised a method to map elevation change using data from ICESat.
Published Oct 3, 2009