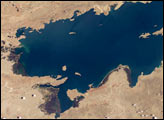
With a surface area of nearly 27,000 square miles (70,000 square kilometers), Lake Victoria is the biggest lake in Africa. It is also notoriously dangerous for more than 200,000 people from Uganda, Kenya, and Tanzania who fish these waters at night. Many fishermen lose their lives in violent storms on the lake each year.
The storms are caused by the circulation in the atmosphere above Lake Victoria. Daytime breezes flow outward from the relatively cool surface of the lake toward the sun-baked land. At night, the pattern reverses, and land breezes converge over the water. Combine that with evaporation from the vast lake and warm-air convection into the atmosphere, and you end up with thunderstorms.
According to Wim Thiery and an international team of climate scientists, this pattern is likely to intensify as the world grows warmer. The team analyzed satellite observations collected every 15 minutes from 2005 to 2013 and cataloged storm activity near the lake. Specifically, they examined the appearance and location of overshooting cloud tops, “dome-like protrusions atop a cumulonimbus anvil [cloud] induced by intense updrafts” like those present in thunderstorms.
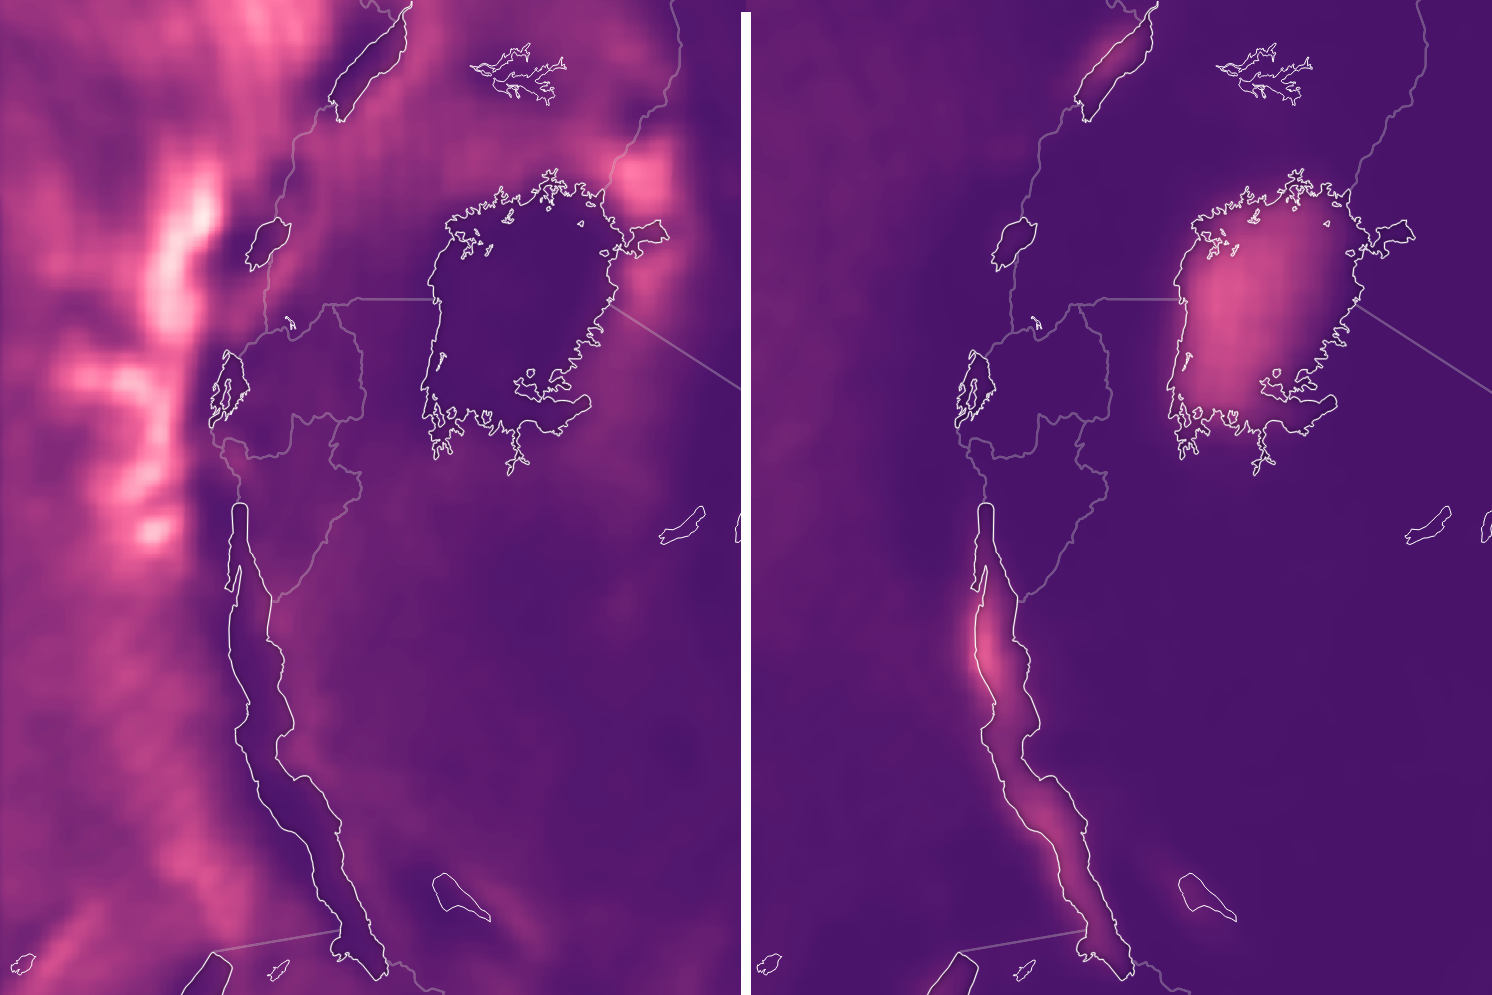
The maps above show a representation of the storm pattern as observed by weather satellites. Bright colors show areas where the scientists counted pixels filled with overshooting cloud tops associated with thunderstorms. The figure on the left shows the location of overshooting tops by day, while the right image shows how they concentrate over lakes at night.
“Thanks to new satellite-based storm detection products developed at NASA, we were able to map the number of hazardous thunderstorms and their locations in East Africa,” said Thiery, who is affiliated with KU Leuven (University of Leuven, Belgium) and ETH Zürich (Switzerland). “During the day, most storms rage over the surrounding land, especially the typical afternoon thunderstorms that are caused by local upsurges of warm air. At night, these storms concentrate above Lake Victoria.”
Along with teasing out details of the storm patterns around Lake Victoria, the research team ran computer models of how the circulation could change due to future global warming and increasing greenhouse gas emissions. They found that the amount of rainfall over Lake Victoria will increase by twice as much as the rainfall over the surrounding land.
Thiery and colleagues wrote in Nature Communications: “Given the projected increase in extreme over-lake thunderstorms, the current vulnerability of local fishing communities and their growing exposure driven by rapid urbanization along the lakefront, this lake is likely to remain the most dangerous stretch of water in the world.”
“Our results make it possible to better predict extreme storms over Lake Victoria and to reduce the vulnerability of the local fishermen,” said Thiery in an interview. “In the meantime, we have already developed a prototype of a new warning system.”
The same advanced computer modeling could be useful in predicting future impacts of climate change around inland bodies of water in the United States. “When performing climate simulations, it is very important to allow the body of water to accurately modify the atmosphere around it and vice versa,” said Kristopher Bedka, a climate scientist at NASA’s Langley Research Center and a co-author of the paper. “Lakes and wide rivers—such as Lake Michigan and the Mississippi River—generate air circulations that can impact where thunderstorms form over the surrounding land. If climate projections do not properly account for these detailed interactions between land and water, they will underestimate their impact.”
While studying the storm patterns around Lake Victoria, the research team developed methods to automatically identify hazardous thunderstorms in “any satellite image, anytime, anywhere across the world,” Bedka noted. Data sets drawn from those methods could be used to help uncover interactions between land and water.
NASA Earth Observatory maps by Joshua Stevens, using data courtesy of Thiery et al., (2016). Caption by Katrien Bollen and Ilse Frederickx (University of Leuven), Joe Atkinson (NASA Langley), and Mike Carlowicz.