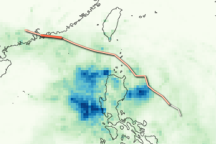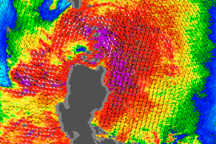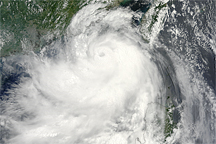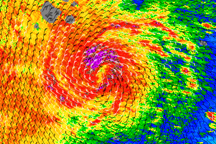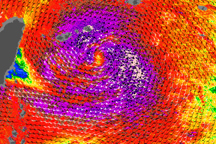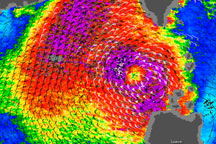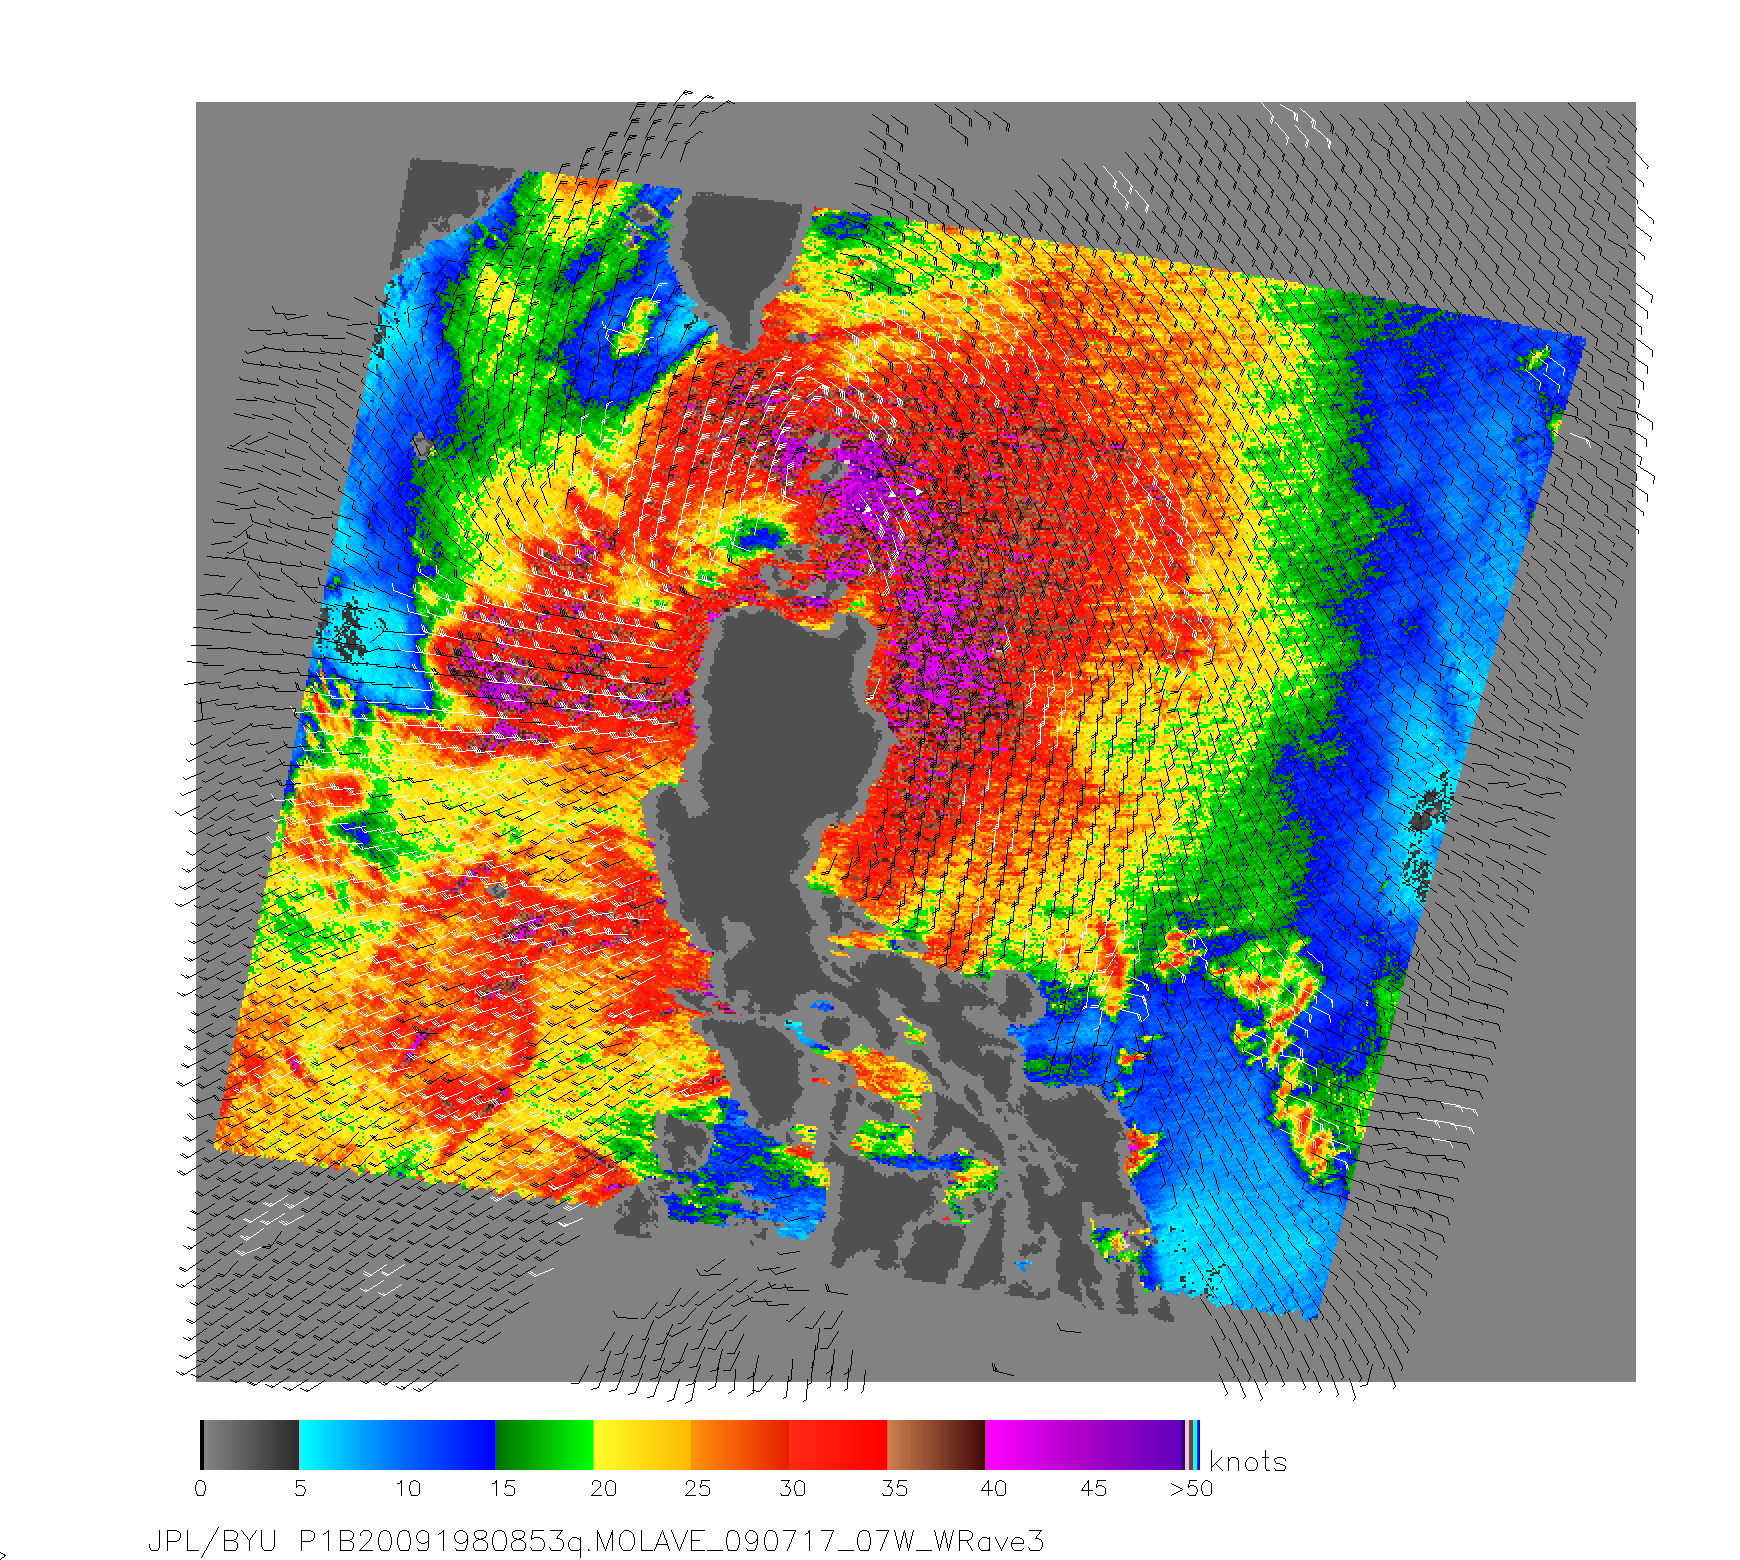
On July 17, 2009, when NASA’s QuikSCAT satellite captured the data used to make this image, Tropical Storm Molave hung over the northern Philippines, drenching the islands with heavy rain and causing widespread flooding. The image shows the structure of winds within the strengthening storm. Purple and red depict the highest wind speeds, while blues and greens point to calmer winds. Barbs indicate the direction of the wind, and white barbs indicate areas of heavy rain. The calm eye of the storm is a circle of blue surrounded by yellow and red. The strongest winds are close to the center on the east side of the storm.
QuikSCAT measures wind speeds over the ocean by sending pulses of microwave energy through the atmosphere to the ocean and measuring the energy that bounces back from the wind-roughened surface. The energy of the microwave pulses changes depending on wind speed and direction, giving scientists a way to monitor wind around the world. About the time that QuikSCAT acquired this image of Tropical Storm Molave over the Philippines, the Joint Typhoon Warning Center estimated the storm’s maximum sustained winds to be about 110 kilometers per hour (70 miles per hour or 60 knots).
At least three people in the Philippines died in the storm, reported the AFP news service on July 18. Molave briefly strengthened into a typhoon as it moved west away from the Philippines over the South China Sea on July 18. It weakened before coming ashore over China on July 19.
NASA image courtesy the QuickScat Science Team at the Jet Propulsion Laboratory. Caption by Holli Riebeek.