
Many scientists who study snow, ice, and climate look back on 2002 as an eventful year. Early in the year, they fixed their attention on the Antarctic Peninsula, where the Larsen B Ice Shelf had just disintegrated. By September 2002, eyes turned to the Arctic, where sea ice had just set a new record. At roughly 6.0 million square kilometers, the sea ice had reached a new record low.
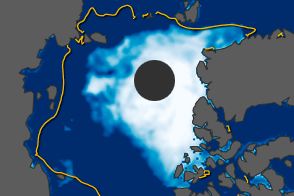
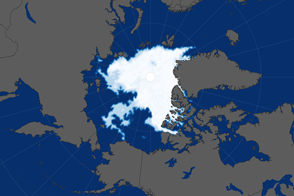
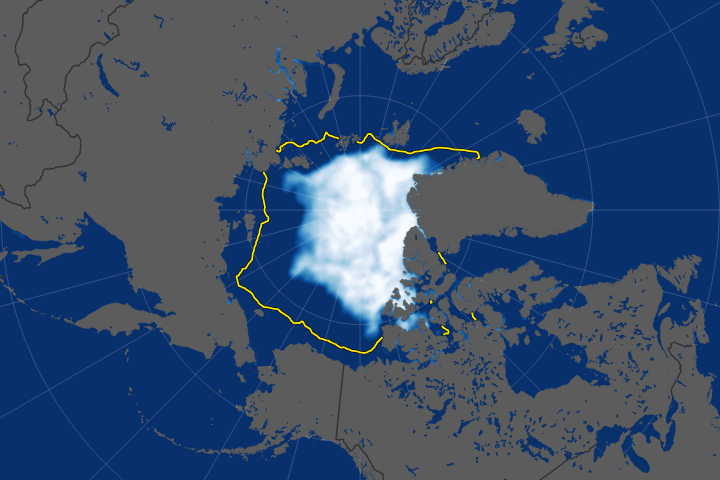
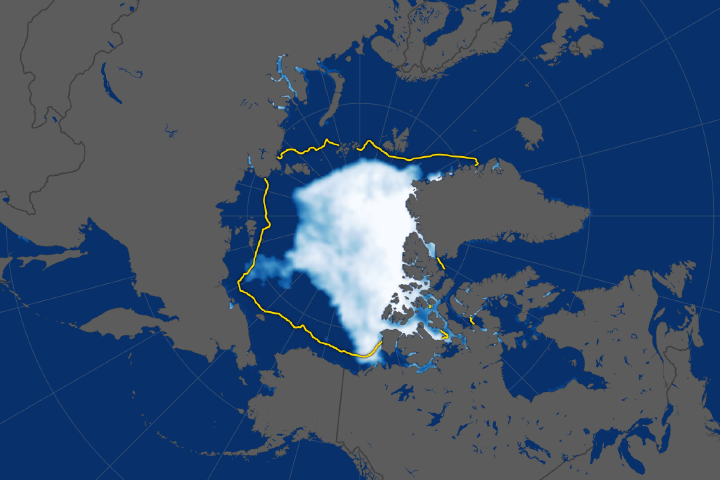
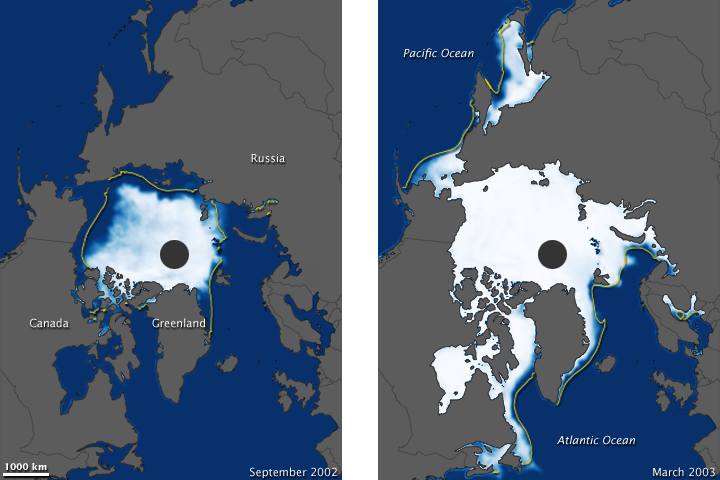
Arctic sea ice usually melts to its minimum each September, and grows to its maximum each March. This image pair shows monthly Arctic sea ice for September 2002 (left) and March 2003 (right). The yellow outline on each image shows the median sea ice extent observed by satellite sensors from 1979 through 2000. (The median is the middle value. Half of the extents over the time period were larger than the line, and half were smaller).
Since the satellite record began in late 1978, Arctic sea ice showed an overall decline, but the rate of decline was relatively small through the twentieth century. The record low from 2002 was only barely below previous record lows from the 1990s, and sea ice rebounded to 15.5 million square kilometers the following March. But the 2002 September low was the beginning of a series of record- or near-record-low sea ice extents in the Arctic. This series of record lows, combined with poor wintertime recoveries starting in the winter of 2004-2005, marked a sharpening in the rate of decline in Arctic sea ice. Sea ice did not return to anything approaching long-term average values after 2002.
Cycles of natural variability such as the Arctic Oscillation are known to play a role in Arctic sea ice extent, but the sharp decline seen in this decade cannot be explained by natural variability alone. Natural variability and greenhouse gas emissions (and the resulting rise in global temperatures) likely worked together to melt greater amounts of Arctic sea ice. Some models forecast an ice-free Arctic for at least part of the year before the end of the twenty-first century.
These images are made from a combination of observations from the Special Sensor Microwave/Imagers (SSM/Is) flown on a series of Defense Meteorological Satellite Program missions and the Advanced Microwave Scanning Radiometer for the Earth Observing System (AMSR-E), a Japanese-built sensor that flies on NASA’s Aqua satellite. These sensors measure microwave energy radiated from the Earth’s surface (sea ice and open water emit microwaves differently). Scientists use the observations to map sea ice concentrations. The resulting digital images are composed of pixels that represent an area up to 25 by 25 kilometers.
The National Snow and Ice Data Center (NSIDC), which serves as NASA’s archive for sea ice data, maps sea ice based on a concentration threshold of 15 percent. Any pixel with an ice concentration at or above this level is considered ice-filled, and the aggregation of ice-filled pixels is known as sea ice extent.
Some areas, such as places along the Greenland coast or in Hudson Bay, may appear ice-covered when they actually were not. Over the years, satellite sensor capabilities have steadily improved, but some residual limitations remain, often due to weather and mixing of land and water in the satellite sensor’s field of view. The gray circle at the center of each image is the “pole hole” north of which satellite sensors have historically been unable to collect data. NSIDC’s extent estimates assume that this hole is ice-filled.
For a time series of Arctic sea ice images from 1999 to 2009, see the Earth Observatory feature World of Change: Arctic Sea Ice.
NASA images by Jesse Allen, using data from the National Snow and Ice Data Center (NSIDC). Caption by Michon Scott, with input from Ted Scambos, NSIDC.