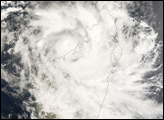
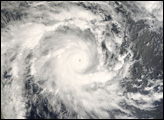
The Seychelles are a chain of islands stretching out north of Madagascar off the eastern coast of Africa. On December 20, 2006, these islands were on alert for the very intense tropical cyclone Bondo, which was predicted to strike the islands in the early hours of the next day. Cyclone Bondo was a Category 4 storm on the Saffir-Simpson scale, with sustained winds as high as 222 kilometers per hour (138 miles per hour), according to the Reuters news service.
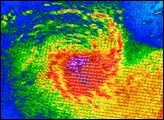
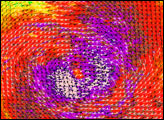
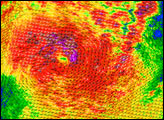
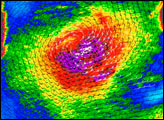
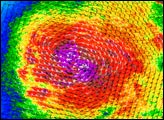
This data visualization shows Cyclone Bondo while it was two days away from the Seychelles. The image depicts wind speed in color and wind direction with small barbs. White barbs point to areas of heavy rain. The data were obtained by NASA’s QuikSCAT satellite on December 19, 2006, at 5:03 p.m. local time (14:03 UTC). Bondo appears as a well-formed symmetrical spiral of winds centered around a strong, relatively calm eye. This pattern is typical of tropical cyclones. Since Bondo is in the Southern Hemisphere, the Coriolis force (see glossary for a definition), which gives all cyclones their spin, turns the storm in the opposite direction to hurricanes and typhoons that form in the Northern Hemisphere: clockwise rather than counterclockwise.
Ground- or aircraft-based measurements of the wind strength of Tropical Cyclone Bondo would likely show sustained winds significantly higher than those indicated by QuikSCAT. QuikSCAT employs a scatterometer, which sends pulses of microwave energy through the atmosphere to the ocean surface, and measures the energy that bounces back from the wind-roughened surface. The energy of the microwave pulses changes depending on wind speed and direction.
Tropical cyclones, however, are difficult to measure. To relate the radar “return signal” to actual wind speed, scientists compare measurements taken from buoys and other ground stations to data the satellite acquired at the same time and place. Because the high wind speeds generated by cyclones are rare, scientists do not have corresponding ground information to know how to translate data from the satellite for wind speeds above 50 knots (about 93 km/hr, or 58 mph). Also, the unusually heavy rain found in a cyclone distorts the microwave pulses in a number of ways, making a conversion to exact wind speed difficult. Instead, the scatterometer provides a nice picture of the relative wind speeds within the storm and shows wind direction.
NASA image courtesy of David Long, Brigham Young University, on the QuikSCAT Science Team, and the Jet Propulsion Laboratory.