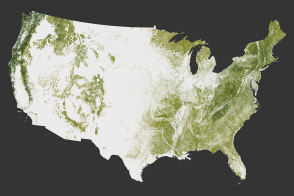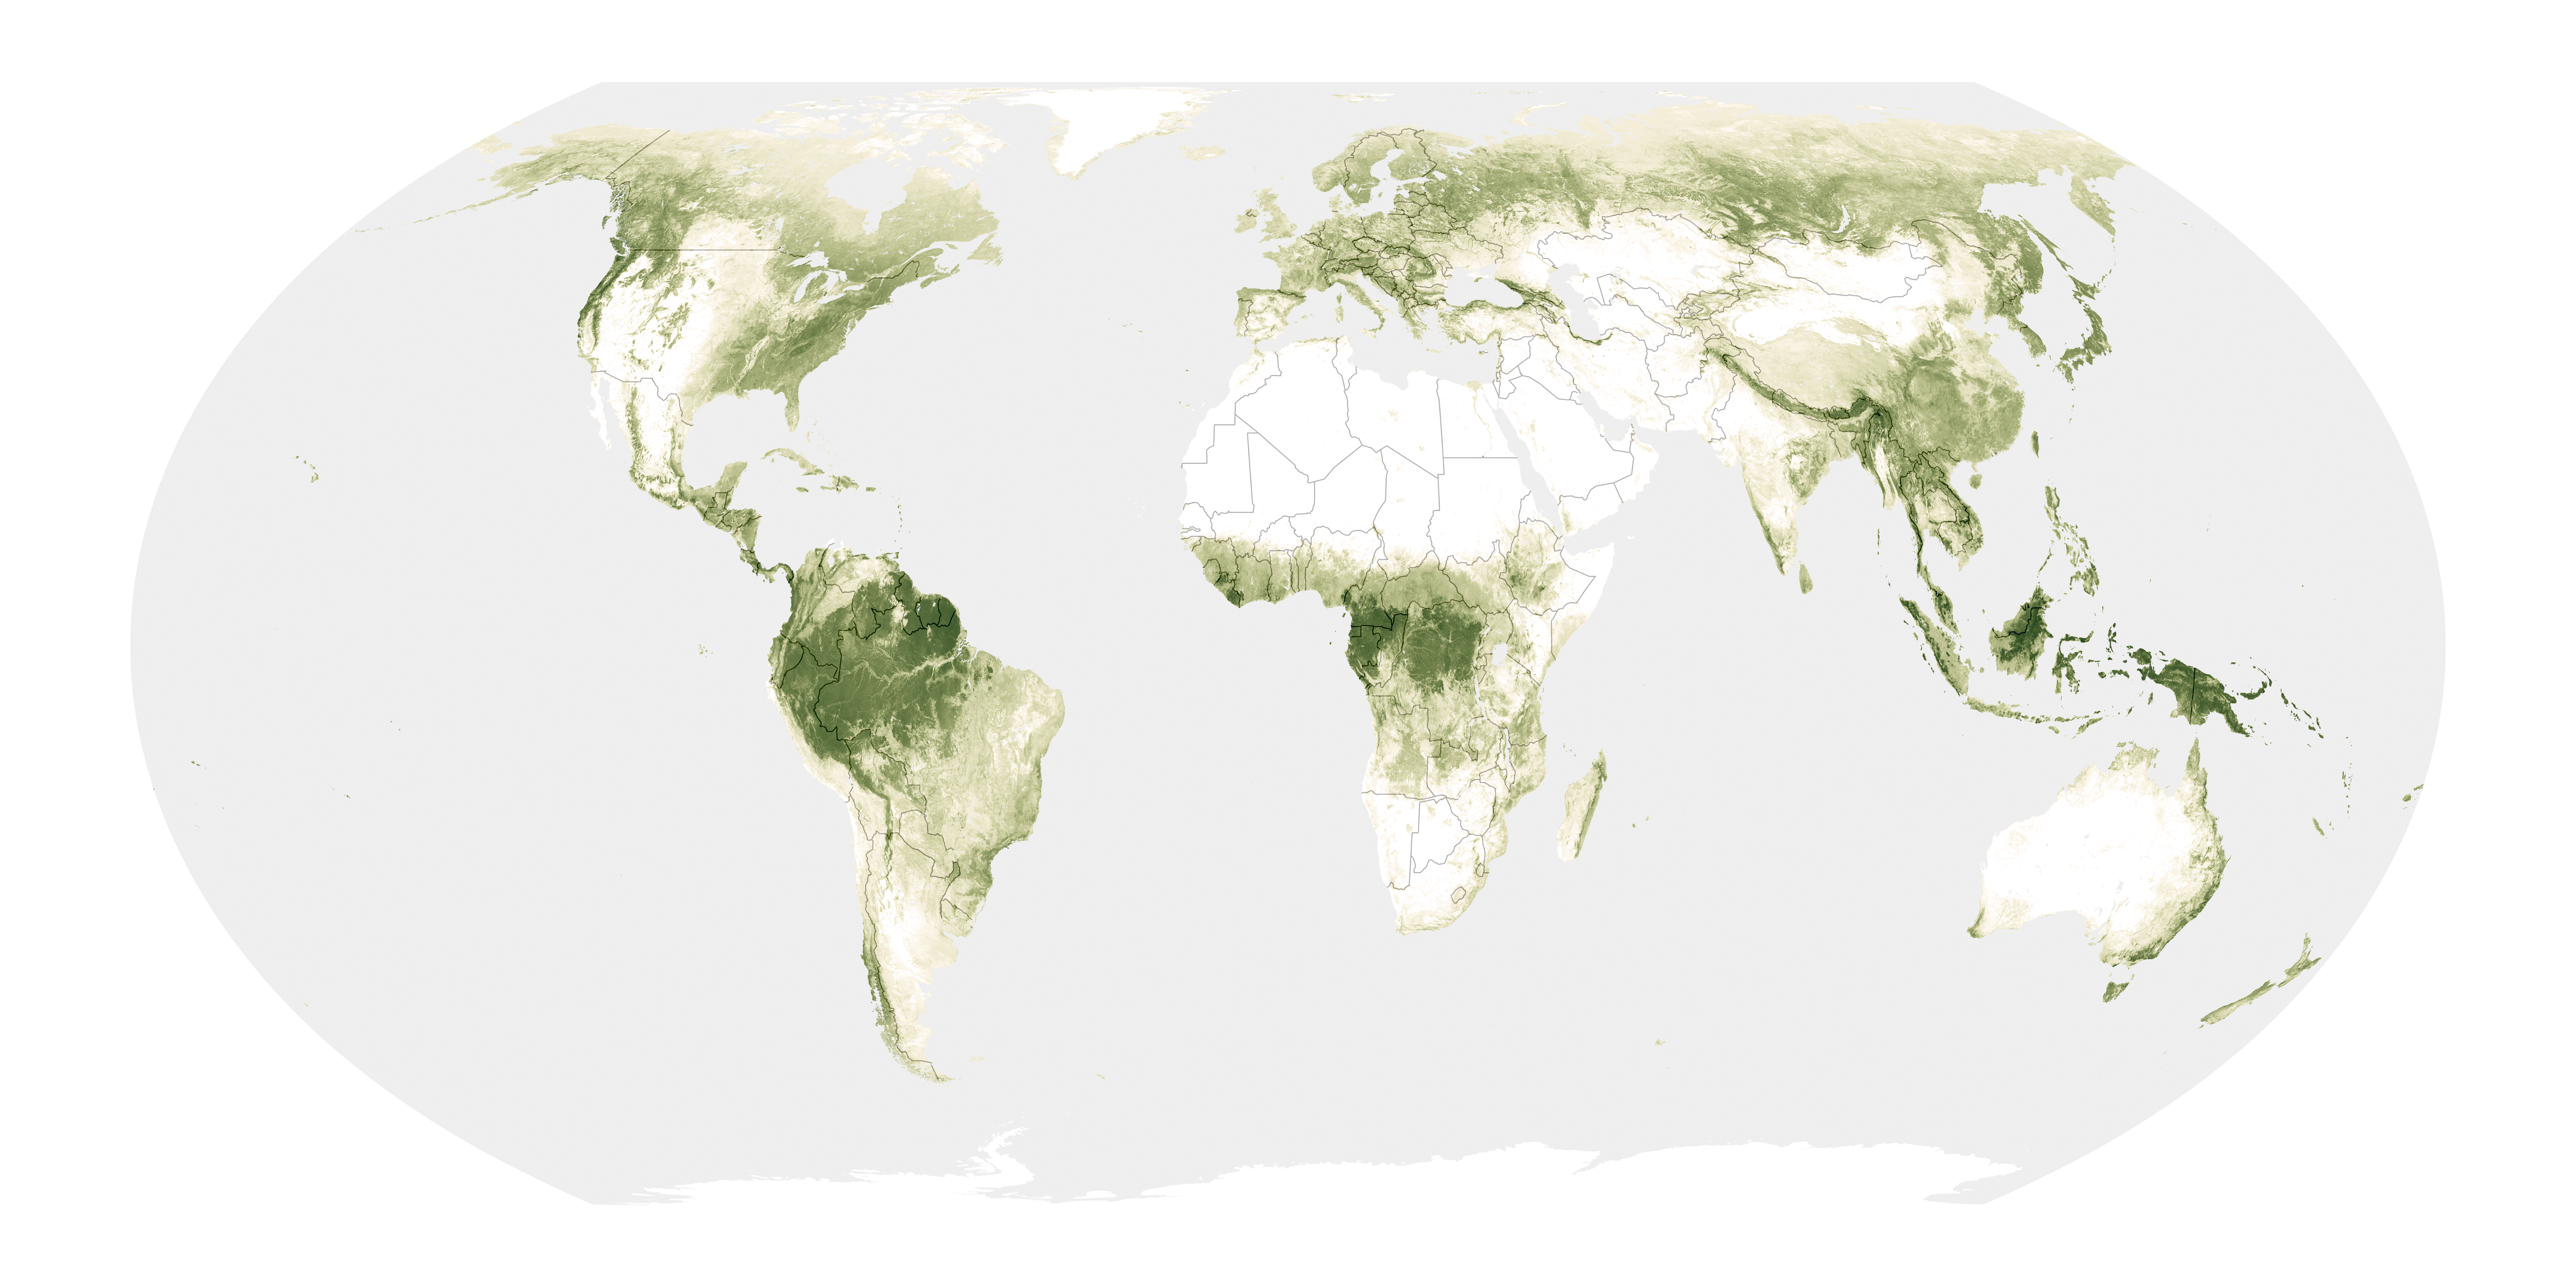
Every now and then, a new map changes the way we view our planet. This is one of those maps.
The map above shows the height of Earth’s forests, from stubby saplings to timbers towering more than 50 meters tall. It reveals some patterns you might expect, such as taller forests hugging the equator in the Amazon, central Africa, and Indonesia. But tall trees show up outside the tropics, too. For example, giant sequoias in California can grow to nearly 80 meters (260 feet) tall; Bhutan pines in the eastern Himalayas reach similar heights, exceeding the scale of this map.
But these astonishingly tall trees are the minority. According to a research team led by Nico Lang of the EcoVision Lab at ETH Zürich, only 5 percent of the Earth’s land area in 2020 was covered with trees standing taller than 30 meters.
Lang, together with colleagues Konrad Schindler and Jan Wegner, produced the map by merging lidar data from NASA’s Global Ecosystem Dynamics Investigation (GEDI) mission with optical imagery from the European Space Agency’s Sentinel-2 satellites. GEDI’s lidar profiles give detailed canopy heights, but the profiles cover limited areas; Sentinel-2 optical data has abundant coverage, but it is not designed to measure canopy height. The researchers used the GEDI data to train a deep-learning model capable of estimating canopy heights from Sentinel-2 images anywhere on Earth.
On a very basic level, it works like this: A computer examines millions of examples of brightness patterns contained in the pixels of Sentinel-2 optical imagery. The algorithm is then given the tree height at the central pixel of each example region, as precisely measured by GEDI’s lidar. The algorithm takes this information and teaches itself, learning which canopy heights are associated with certain textural and spectral patterns in the images. Once the model is trained, it only relies on the optical images to estimate canopy height.
“Our focus in this work was twofold: First, we wanted to reduce the error associated with tall canopies, as they typically store large amounts of biomass and carbon,” said Lang, a remote sensing scientist who developed the approach. “Second, our approach integrates probabilistic deep-learning techniques to estimate the uncertainty of each pixel estimate. This is an important aspect to inform downstream users about expected errors in the map.”
Scientists have mapped the planet’s tree canopy heights before, but current technologies and the novel approach have allowed Lang and colleagues to achieve more detail. The length of each pixel on these maps equates to 10 meters on the ground—detailed enough to show some interesting patterns on local scales.
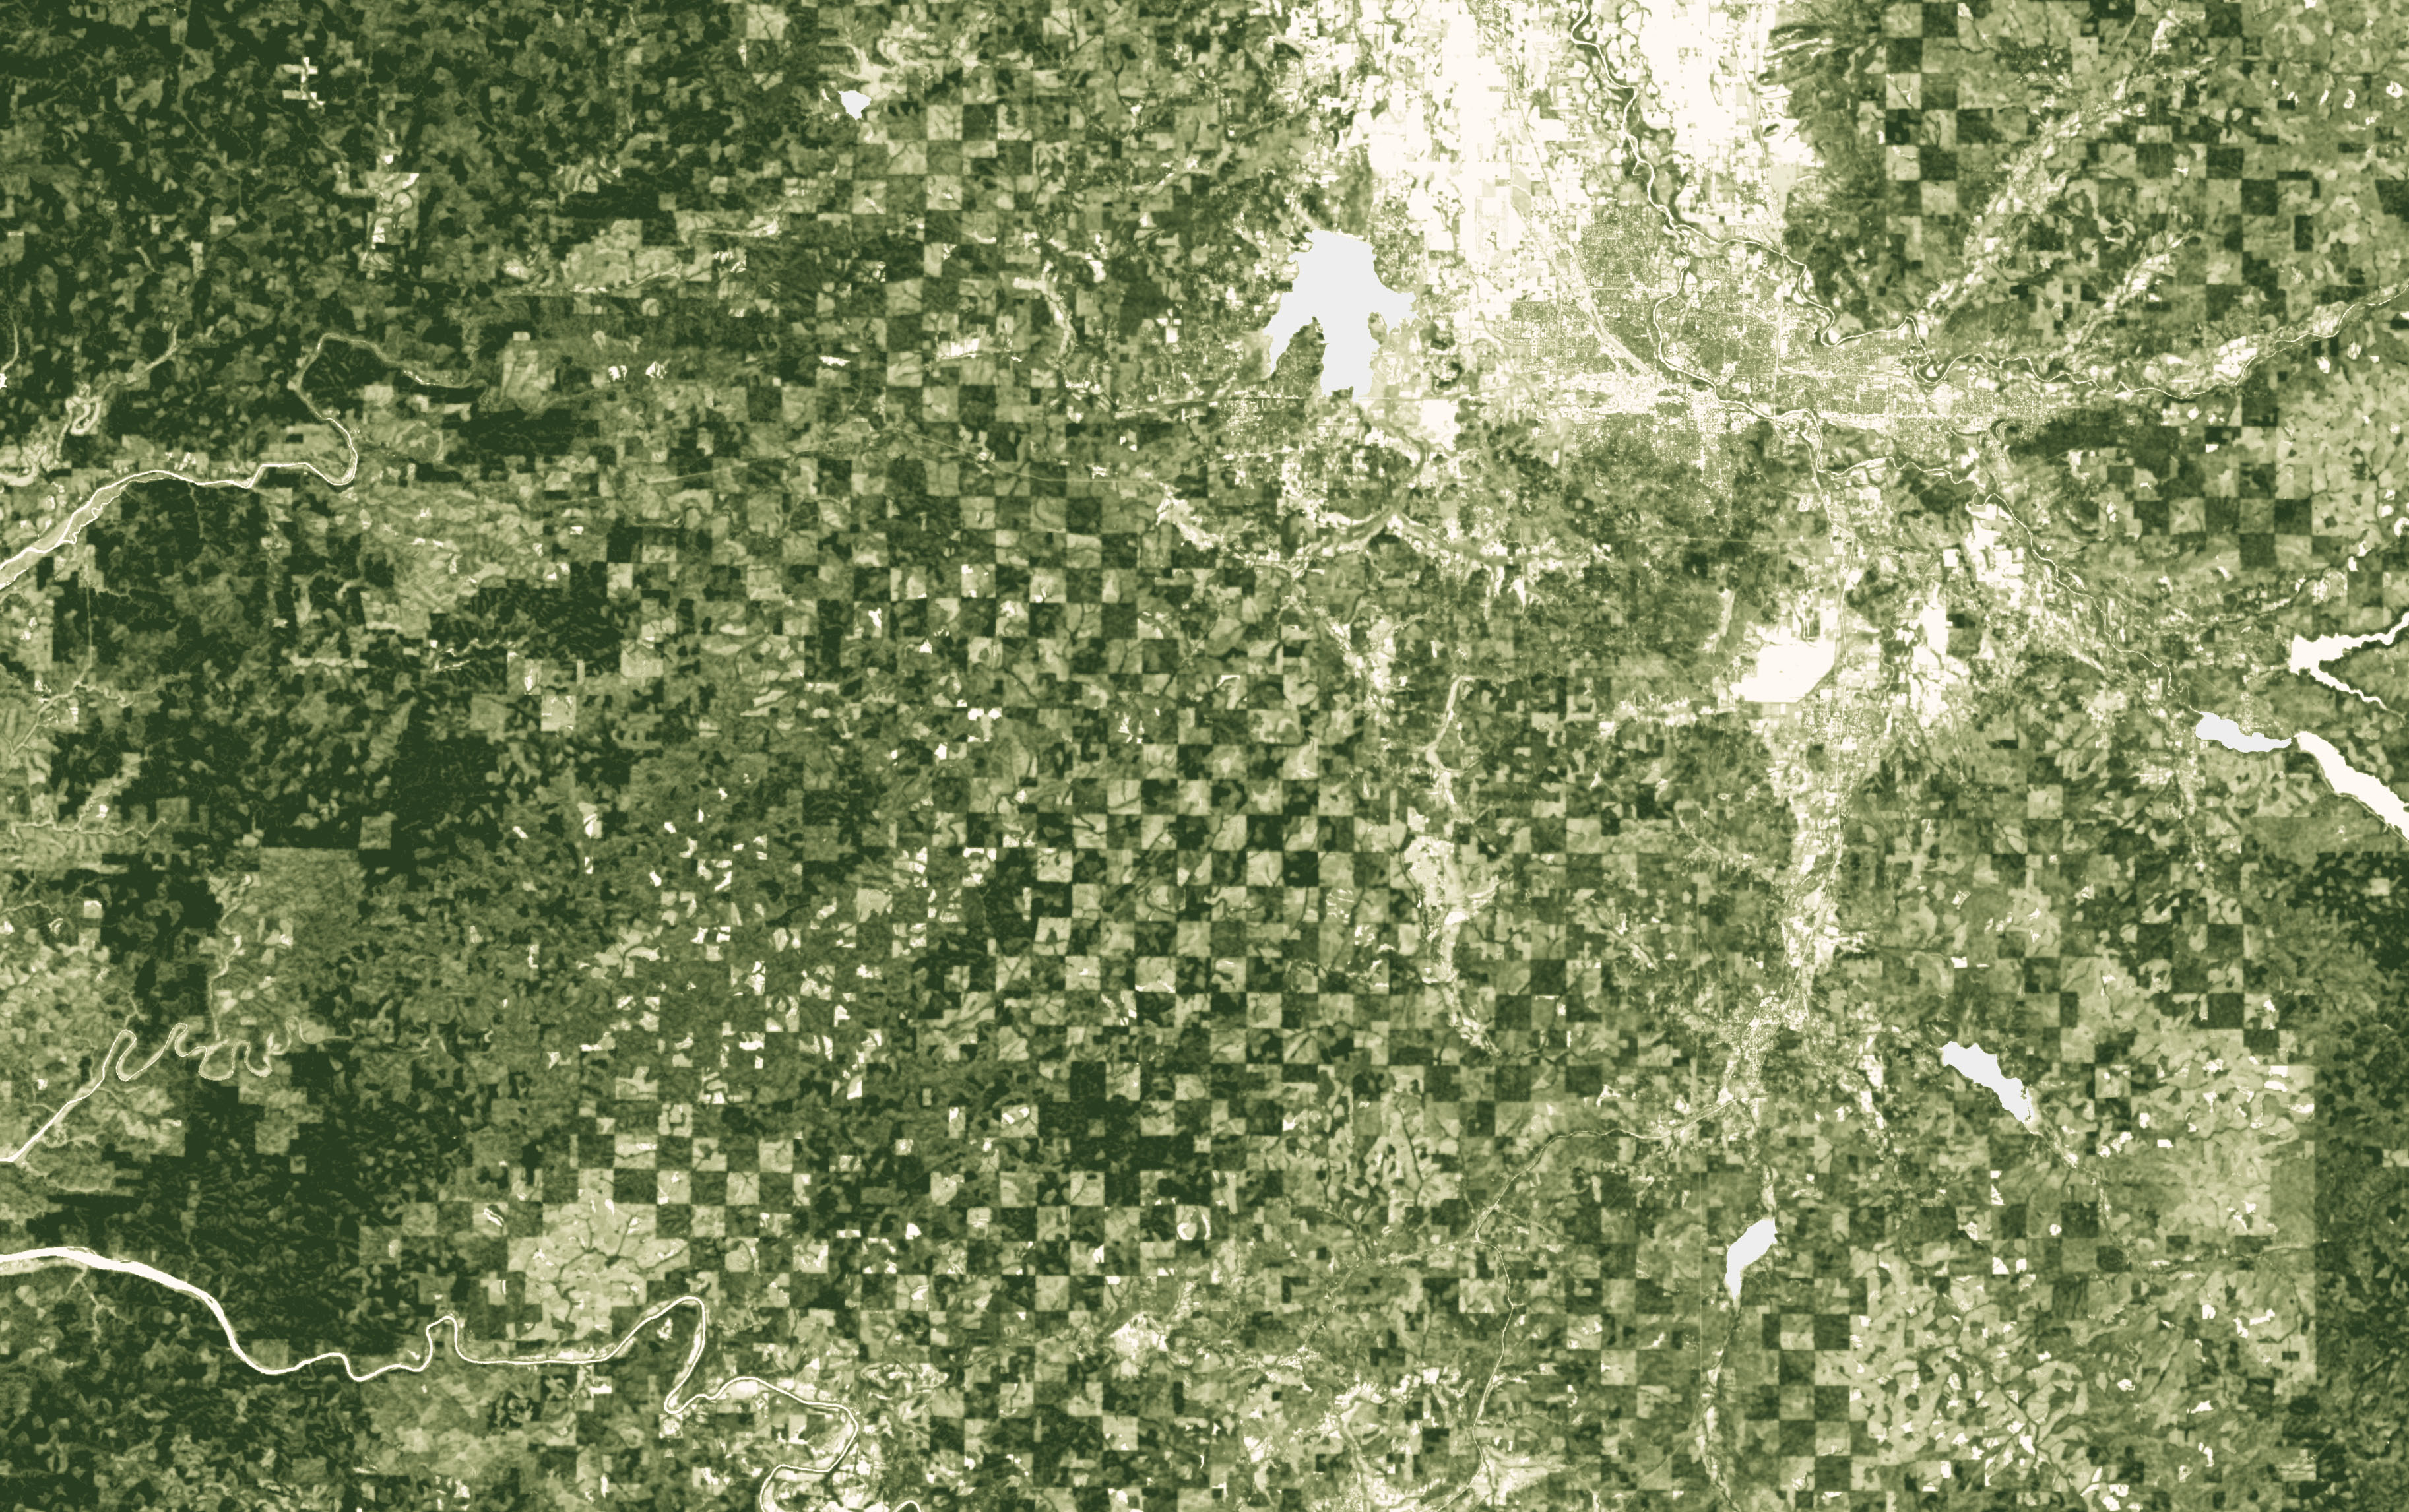
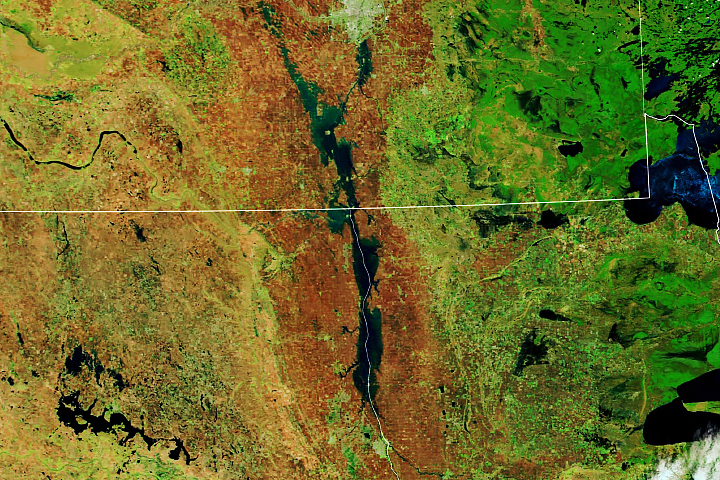
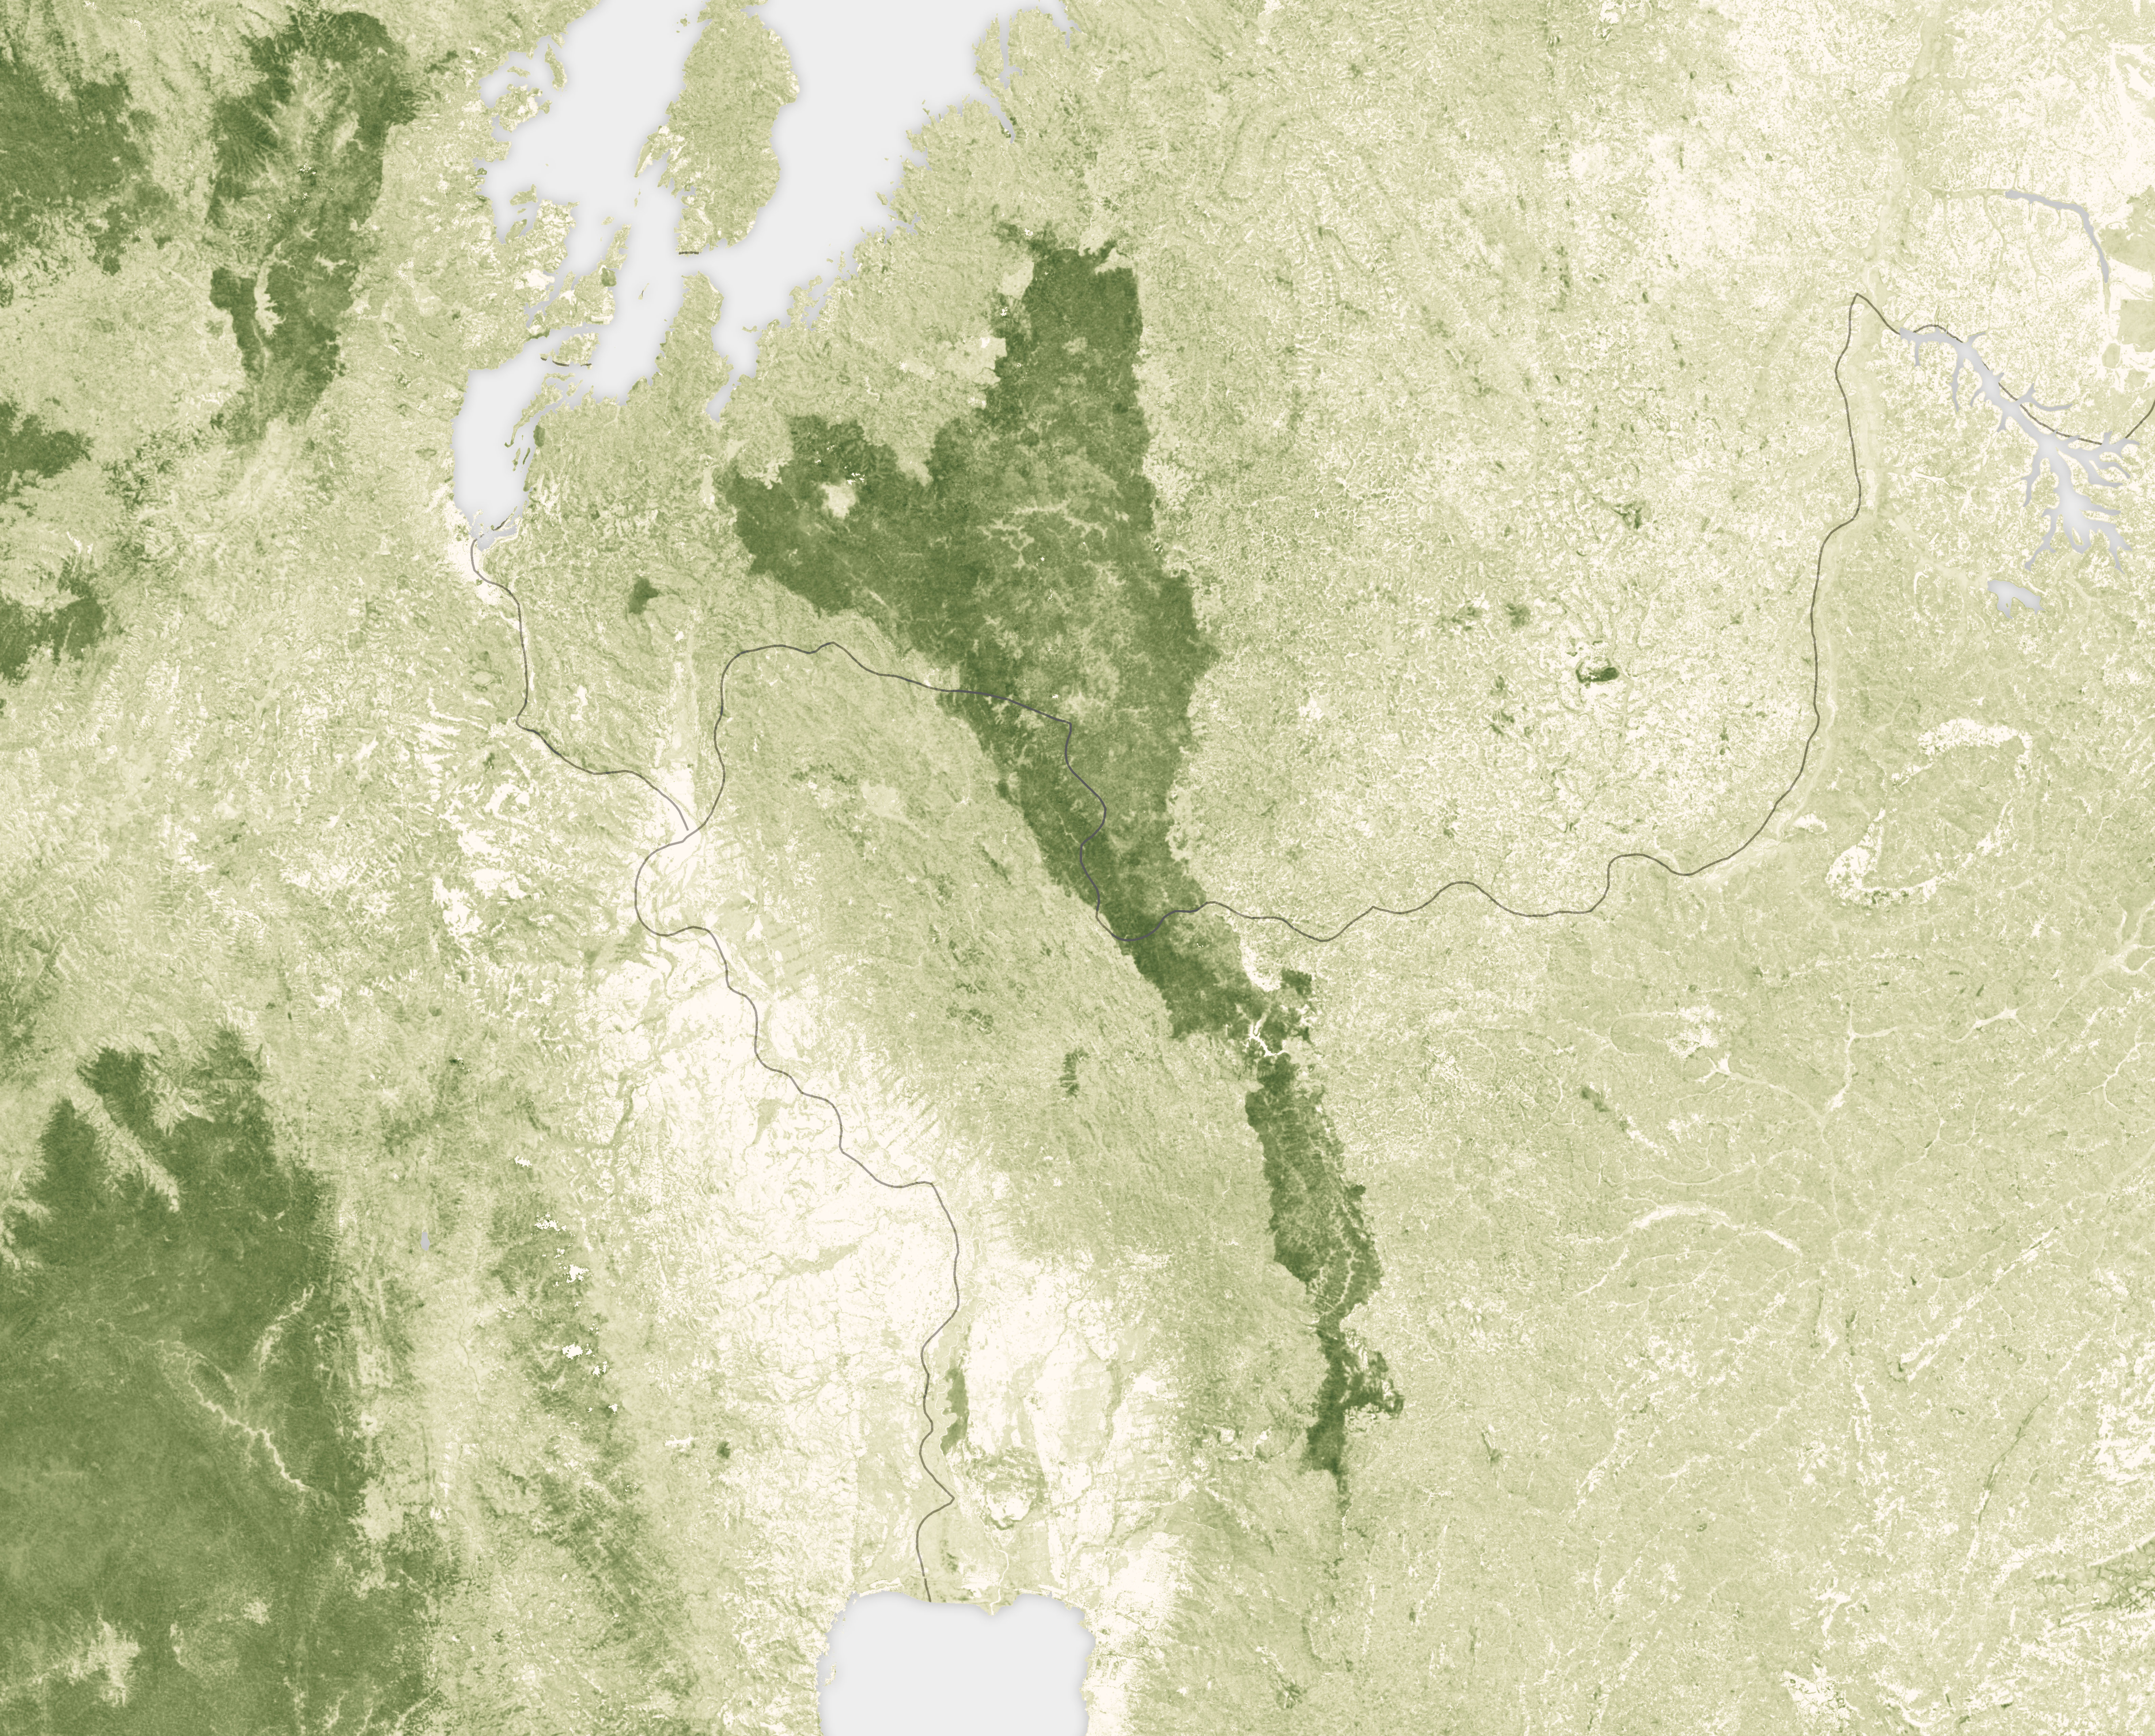
The detailed map above shows canopy heights near Eugene, Oregon. Notice the checkerboard pattern across the landscape, which reflects land management decisions made in the mid-1800s when the Oregon and California Railroad was granted square-mile parcels of land along a rail line between Portland and California. Now controlled by the U.S. Bureau of Land Management, these parcels remain mostly forested, while the privately owned parcels in between tend to be harvested for timber. Even amid the forested parcels, some trees are quite a bit taller than others.
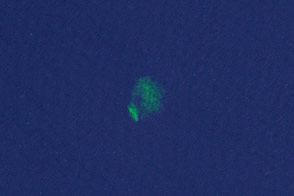
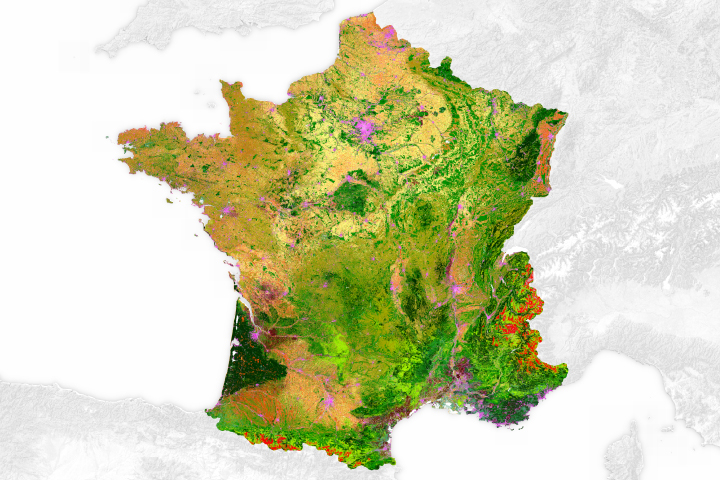
Detailed views also reveal that taller canopy heights often occur within the borders of protected areas. This map, for example, shows the comparatively taller trees of Nyungwe Forest in Rwanda. Declared a forest reserve in 1903, clearing was restricted but the law was not consistently enforced. In 2005, the forest was declared a national park. Since then, various projects have aimed to better protect the trees and to boost ecotourism and education on biodiversity in the park.
Not all tall trees have this level of protection. Analyzing the global map, Lang and colleagues found that only 34 percent of the planet’s tall canopies (above 30 meters) fall within protected areas.
Maps like these could contribute to future studies on forest ecosystems and perhaps inform forest management. For example, research has shown that spotted owls in California prefer tall trees, as opposed to shorter, denser stands. The maps could also aid in climate studies, given that tall trees store abundant amounts of carbon above the ground in their trunks and branches.
“We hope that this work will advance future research in climate, carbon, and biodiversity modeling,” Lang said. “We also hope that our freely available map can support the work of conservationists.”
NASA Earth Observatory images by Joshua Stevens, using data courtesy of Lang, N. et al. (2022). Story by Kathryn Hansen.