Levels of methane in Earth’s atmosphere are soaring. In April 2022, NOAA reported that concentrations of the potent heat-trapping greenhouse gas averaged 1,895.7 parts per billion (ppb) over the past year, a new record. The 17 ppb increase in 2021 was the largest recorded since systematic measurements began in 1983. That followed a 15 ppb increase in 2020.
“The growth we’ve seen in 2020 and 2021 is totally surprising and unexpected,” said NASA atmospheric scientist Benjamin Poulter. “What really worries me is that we don’t understand what’s causing this increase, whether it’s human activities or climate-change feedbacks, or a combination of both.”
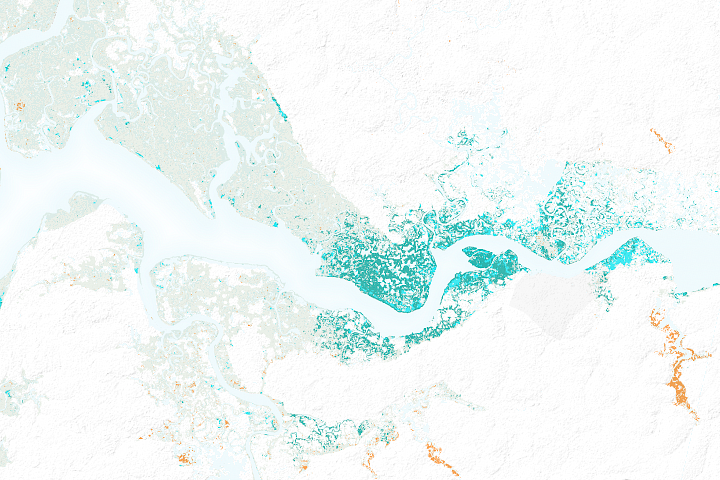
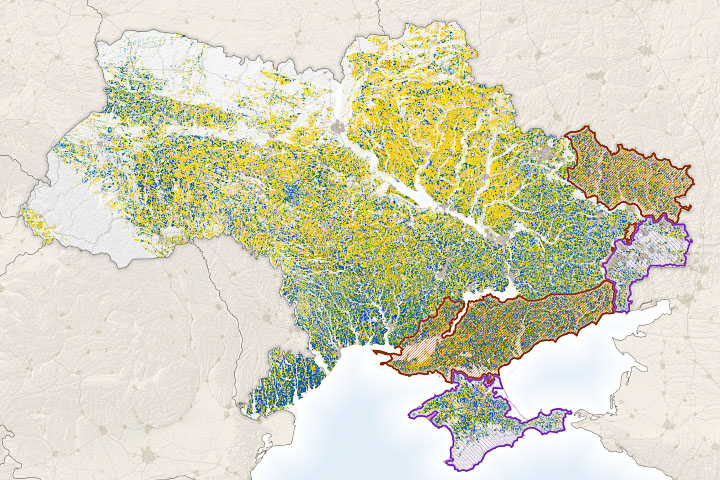
Several activities and processes—some natural, some human-caused—affect methane levels. The list includes fossil fuel production, agriculture, fire activity, precipitation, and the presence of methane-scrubbing chemicals (hydroxyl radicals) in the atmosphere. But the global network of monitoring stations only offers a measure of methane that has dispersed throughout the atmosphere; it does not show where the methane is coming from or what specific activities have pushed levels so high.
Poulter recently returned from an expedition to the Florida Everglades, where he was part of a NASA Carbon Monitoring System team studying an important piece of the methane puzzle—wetlands. Globally, scientists estimate wetlands are responsible for about one third of methane emissions, though they are less confident of the absolute number and how it changes from year to year.
Methane is released from wetlands by armies of anaerobic bacteria that thrive in waterlogged soils and help break down decomposing vegetation. Recently, a growing
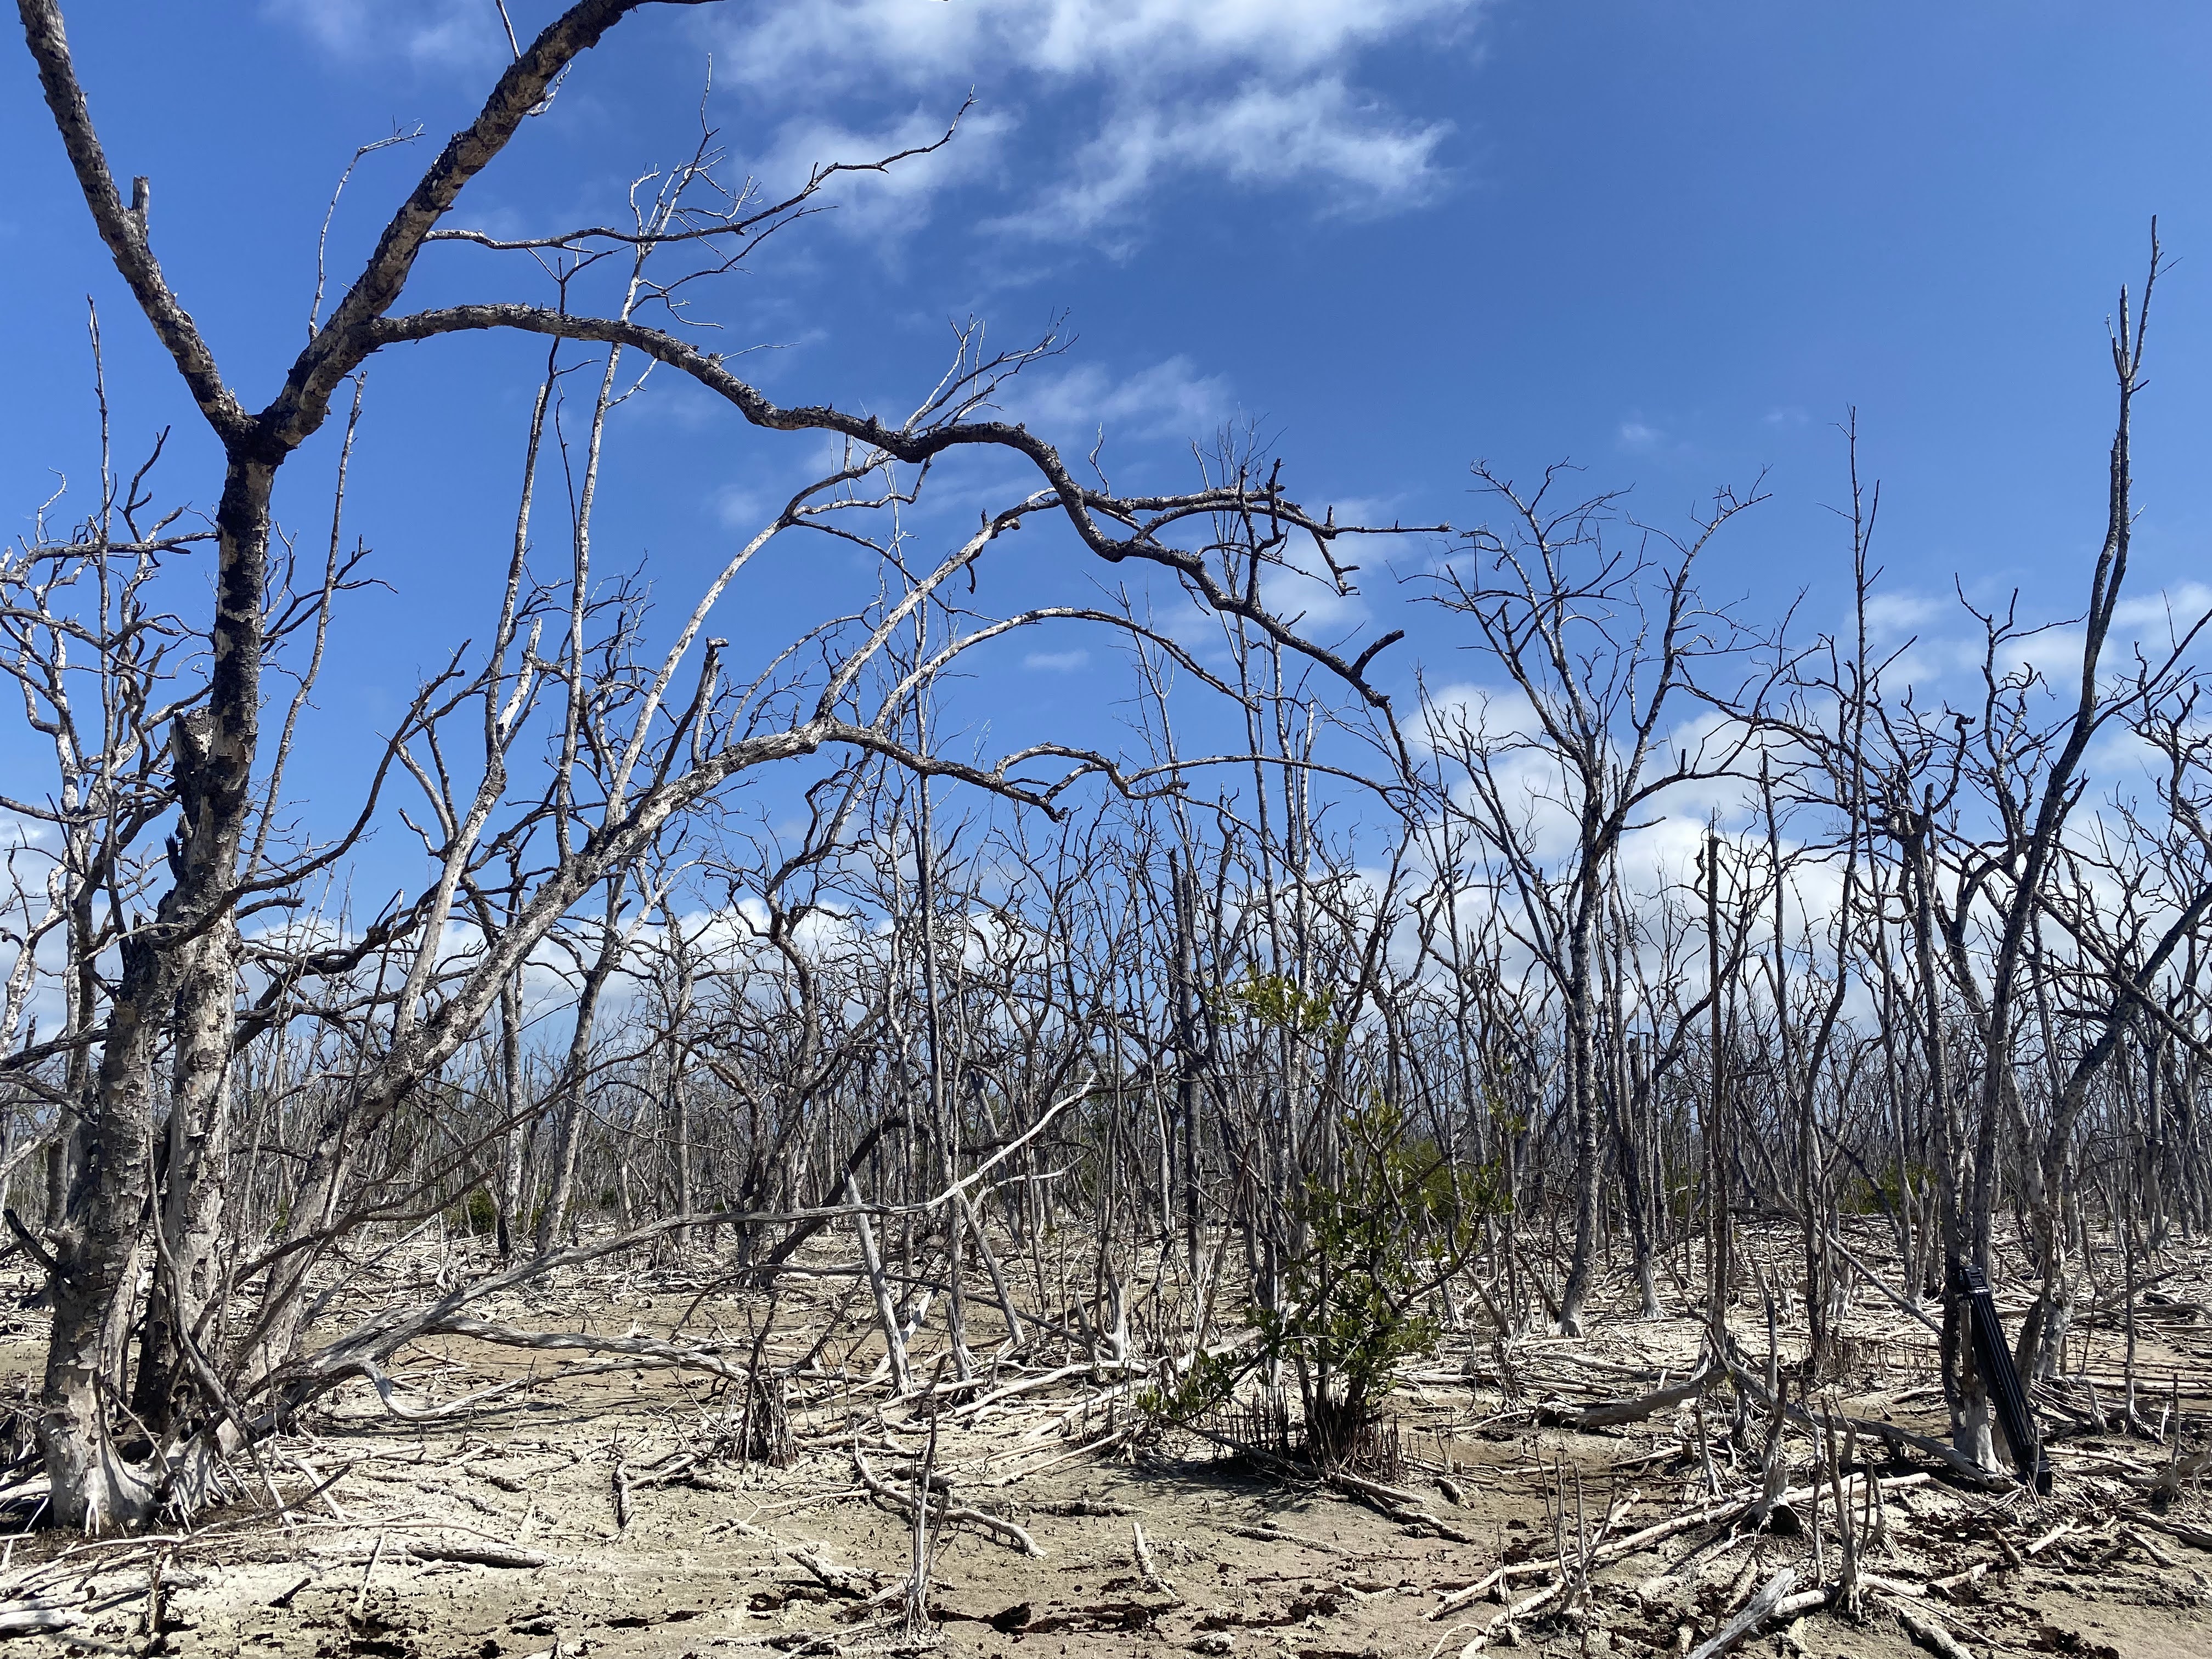
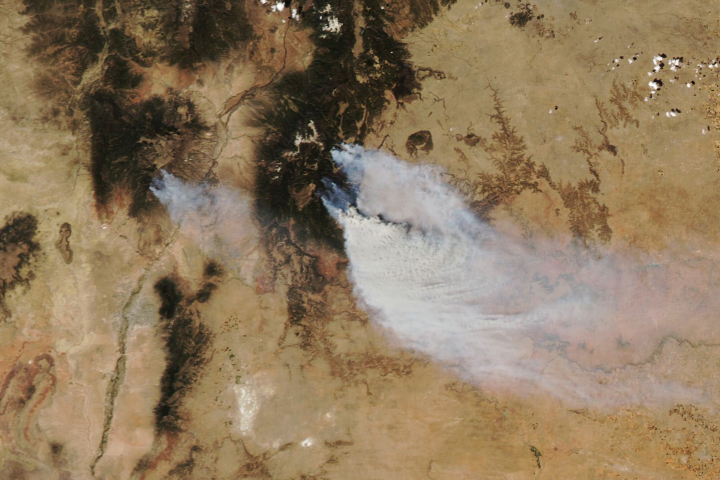
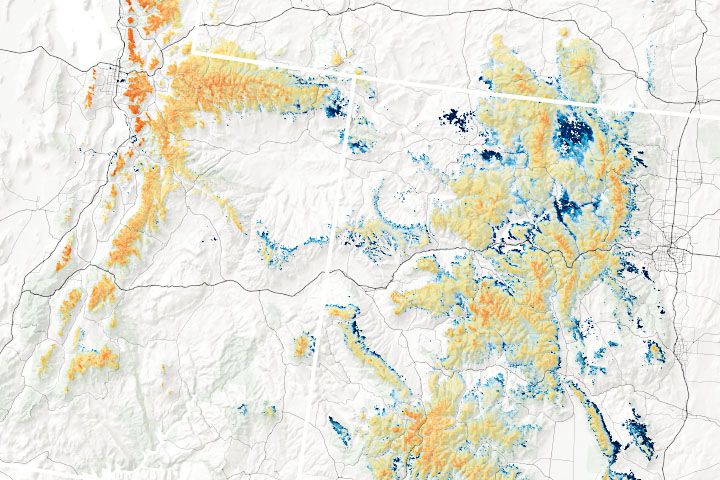
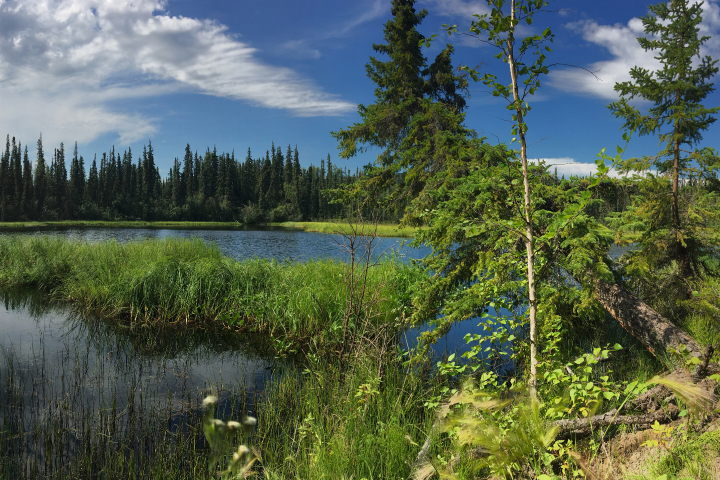
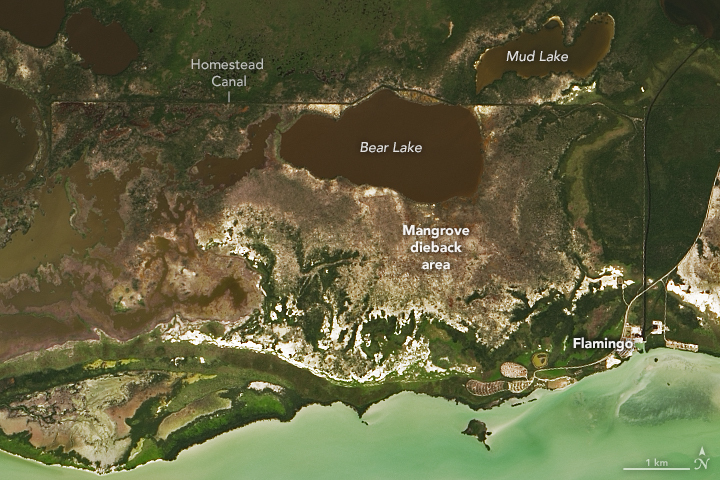
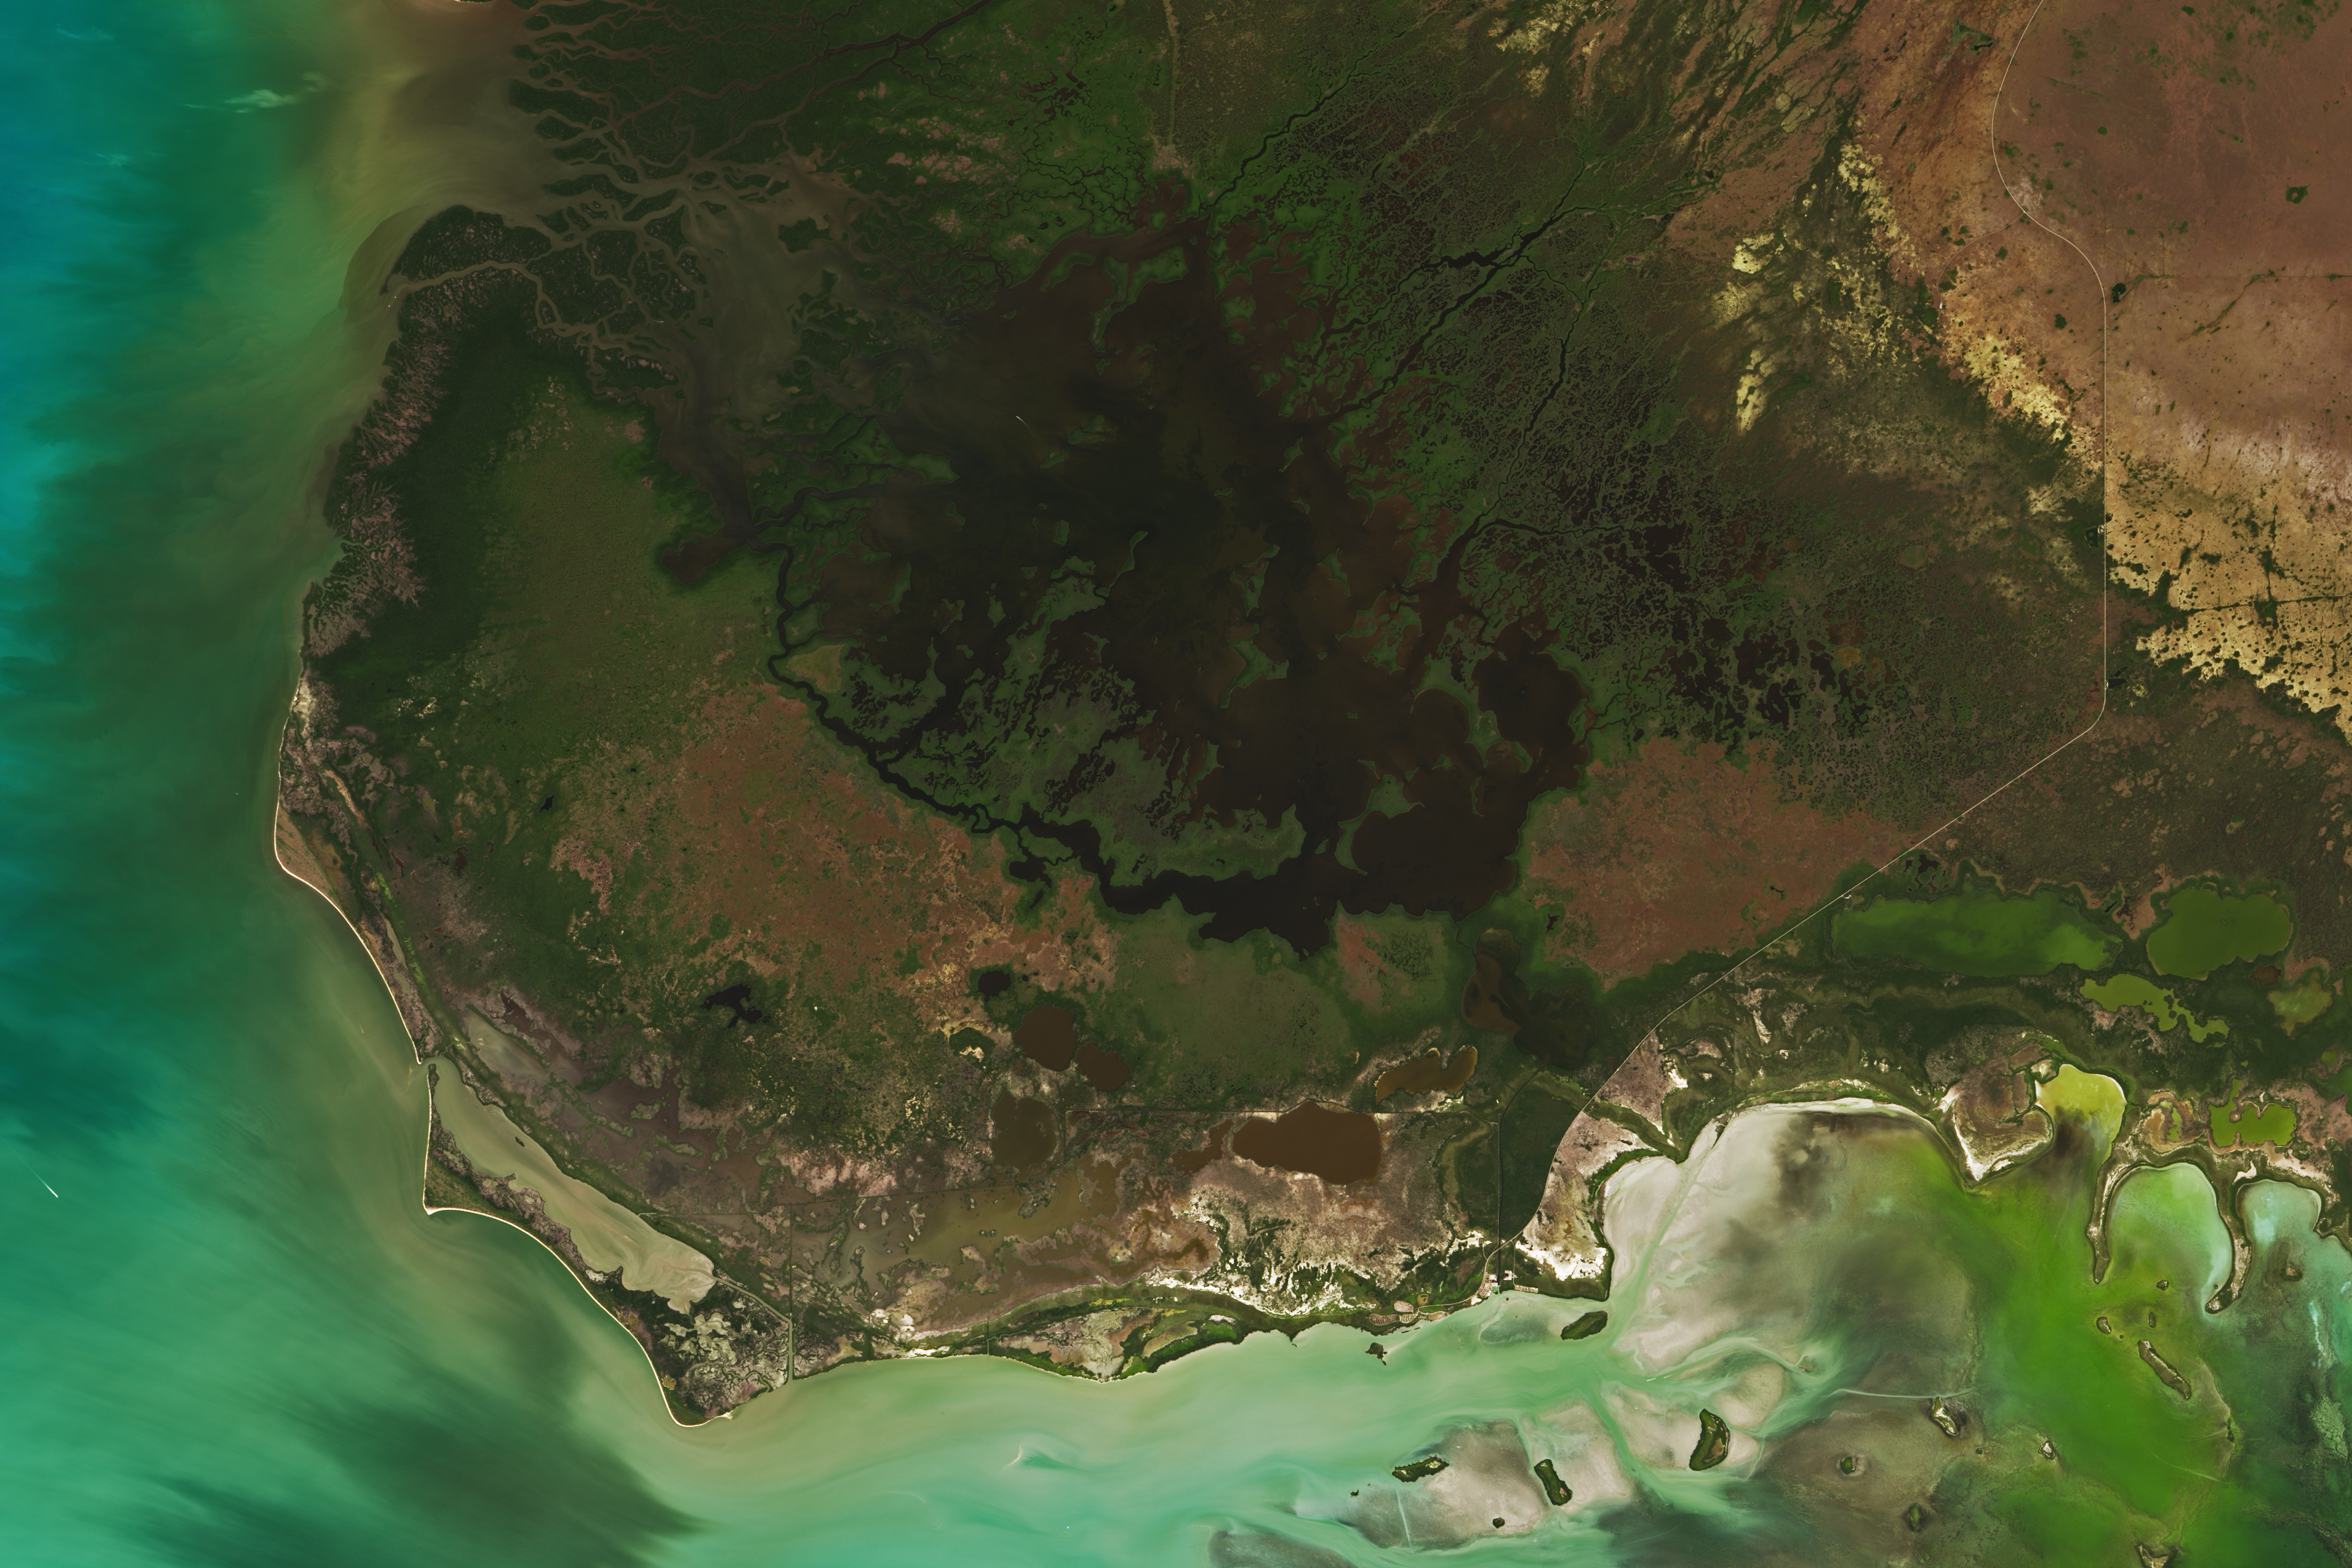
The images above show one of the areas the team sampled—a mostly dead mangrove forest in Cape Sable, Florida. This area near Bear Lake was flooded by Hurricane Irma in 2017. Five years later, the damaged mangroves still appeared brown in the satellite imagery acquired by the Operational Land Imager (OLI) on Landsat 8 on March 29, 2022. The photograph, taken by NASA postdoctoral researcher Cheryl Doughty, shows a dead mangrove forest in Cape Sable.
Poulter and colleagues from Yale University, Florida International University, and East Carolina University think the extra decomposition associated with the death of these mangrove forests has increased the flux of methane emitted from this area in comparison to healthier forests nearby.
“There’s a slight depression in that area, and the storm surge from Irma dumped a huge amount of water that pooled up and couldn’t drain,” explained David Lagamasino, a mangrove expert at East Carolina University who participated in the expedition. “The mangroves were dead within months. Snags are still standing, but I don’t expect these forests to recover. These areas are on the way to becoming mud flats or ponds.”
The video below offers a three-dimensional view of one of these “ghost forests” as derived from terrestrial lidar observations made by NASA and University of Maryland assistant research professor Atticus Stovall during the field campaign.
Mangroves are known for being particularly productive and good at storing large amounts of carbon in the soil around them—perhaps as much as five times more than upland tropical forests. “But if some portion of that carbon is leaking back into the atmosphere in the form of methane, that’s something we need to understand and incorporate into our modeling,” said Poulter.
The field campaign—called Blue Carbon Prototype Products for Mangrove Methane and Carbon Dioxide Fluxes (BLUEFLUX)—was designed to measure the methane and carbon dioxide changes at key wetlands around the Caribbean. Field teams took samples from the ground, while NASA’s Carbon Airborne Flux Experiment (CARAFE) aircraft measured methane emissions from the same locations from above. The broader goal of the campaign is to link ground and aerial data with satellite observations using machine learning and artificial intelligence algorithms in order to produce a daily methane flux dataset for the Caribbean region.
“BLUEFLUX will help us get a better handle on wetland emissions in the Caribbean, but this is just one small piece of the methane budget,” said Poulter. “We need a much more comprehensive and sustained strategy for monitoring methane fluxes on a global scale. Our current observing systems are totally inadequate given the challenges we face.”
NASA Earth Observatory image by Lauren Dauphin, using Landsat data from the U.S. Geological Survey. Video by Atticus Stovall (UMD), using terrestrial laser scanner data (Riegl VZ-400i). Photo by Cheryl Doughty (NASA). Story by Adam Voiland.