The 2020 Atlantic hurricane season will go down in history as a season of superlatives: the most named storms observed in a year (30); the most storms to make landfall in the continental United States (12); the most to hit Louisiana (5); and the most storms to form in September (10). The 2020 season was supercharged, and not just in the raw numbers.
“What really blew me away were the explosive intensification events,” said Jim Kossin, an atmospheric scientist with the National Oceanic and Atmospheric Administration (NOAA). “For instance, Hurricane Eta’s wind speeds increased around 80 miles (130 kilometers) per hour in one day. There’s rapid intensification, and then there’s really rapid intensification, which is what we saw often this year.”
For the past few decades, hurricanes have been rapidly intensifying more often, and their forward motion has been stalling more. 2020 continued both trends. A record-tying nine storms rapidly intensified, defined as wind speeds increasing at least 35 miles (56 kilometers) per hour within 24 hours. Two named storms stalled; one (Sally) moved at just 2 miles per hour for a period—slower than a walking pace.
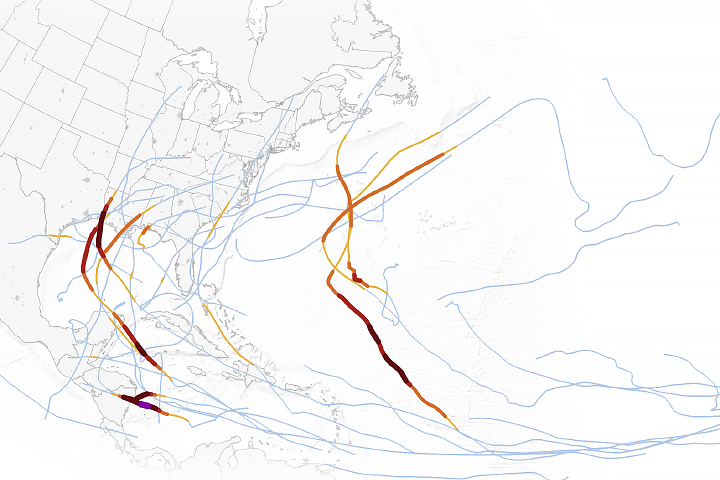
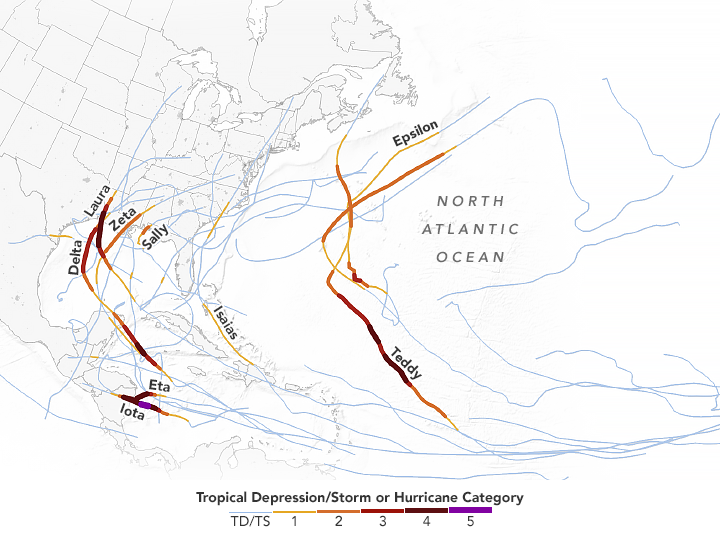
The map above shows the tracks of all 30 Atlantic storms in 2020, highlighting a few of the named storms. Three of them—Eta, Iota, and Delta—saw their winds intensify by at least 80 miles (130 kilometers) per hour in 24 hours. The data for the map come from the International Best Track Archive for Climate Stewardship (IBTrACS), the official archive used by the World Meteorological Organization.
During the 2020 season, nearly every mile of the U.S. Atlantic coast from Texas to Maine was under a tropical storm watch or warning at some point. It also marked the fifth year in a row with above-average hurricane activity.
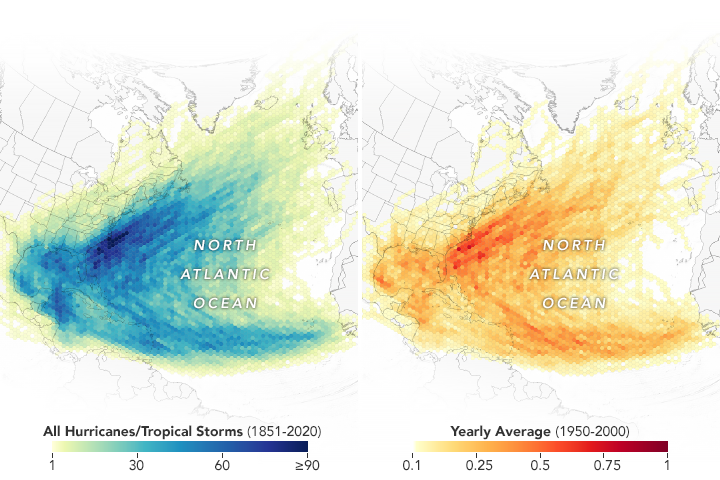
The maps below show historical storm tracks in the Atlantic basin, with each hexagon having a 100-kilometer (60-mile) diameter. The map on the left shows the total number of storms that crossed through each 100-kilometer parcel from 1851 to 2020. The map on the right shows the average number of storms that passed through each hexagon between 1950 and 2000. While the yearly average frequency barely approached one storm for any given parcel from 1950-2000, the active season of 2020 brought as many as four storms to some of these areas.
“This year, the U.S. got hit a lot and the storms did a lot of damage, but the damage certainly could have been worse had the storms tracked slightly differently,” said Phil Klotzbach, a meteorologist at Colorado State University. “For Hurricane Laura, the storm surge could have devastated Lake Charles if the storm had tracked 20 miles farther west.”
Category 4 Hurricane Laura was the strongest to make landfall in the U.S. this season, bringing sustained winds of 150 miles (240 kilometers) per hour and storm surges ranging from 9 to 15 feet (3 to 5 meters). It dropped 5 to 10 inches of rain across a swath of Louisiana, Texas, and Arkansas.
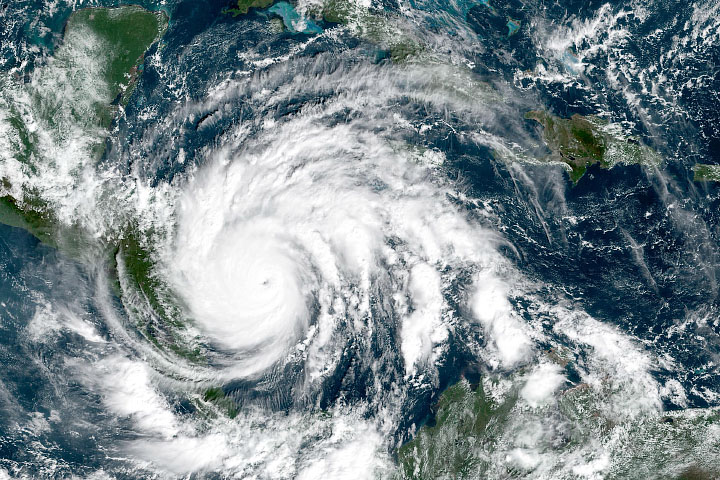
In Central America, category 4 hurricanes Eta and Iota made landfall within two weeks of one another in the same part of Nicaragua. Never have two Atlantic hurricanes hit the same area with such strength so close in time.
“Eta stood out as one of the most catastrophic storms of the season, as it stalled and rapidly intensified at the same time,” said Tim Hall, a hurricane researcher at NASA’s Goddard Institute for Space Studies. “It also occurred in November, well after the season typically peaks.”

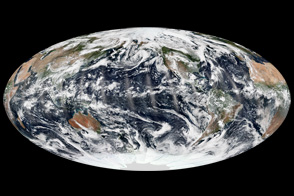
The image above shows a wide view of six storms on September 14, 2020. The data show brightness temperature of the cloud tops (infrared band 13) and were acquired on September 14 by the Geostationary Operational Environmental Satellite 16. GOES-16 is operated by NOAA; NASA develops and launches the GOES series of satellites.
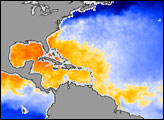
A combination of environmental factors made the Atlantic basin favorable for storm development this year. Sea surface temperatures were abnormally warm at the beginning of the season—which led to a slew of early storms—and became warmer throughout the season. By August, a very active monsoon pattern took hold over northwestern Africa and helped produce the sort of robust atmospheric waves that can develop into storms. A moderate to strong La Niña also developed in the eastern Pacific Ocean and reduced the wind shear that can hinder hurricane formation and intensification across the tropical Atlantic.
Local atmospheric and oceanic conditions also helped intensify individual hurricanes, Klotzbach noted. Weak easterly trade winds prevented upwelling (the process of bringing deeper, colder water to the ocean surface) in the Caribbean, allowing a deep pool of extremely warm water to develop. This provided potent fuel for rapidly intensifying storms like Eta and Iota.
Though recent research suggests that warming seas may heighten hurricane activity in the future, the abundance of storms this year is not itself a signal of future storm trends. “There’s no observed trend globally on the frequency of storms. Some years and some ocean basins have more and then less,” said Hall. “But if you already have a hurricane formed, we have found that global warming signals are increasing a storm’s likelihood to stall, intensify into a major hurricane, and drop more rain.”
NASA Earth Observatory images by Joshua Stevens, using GOES 16 data from NOAA and the National Centers for Environmental Information (NCEI) and the International Best Track Archive for Climate Stewardship (IBTrACS). Story by Kasha Patel.