In the southern Amazon, the dry season typically begins in July and continues through November, bringing increased fire activity along with it. Following a notable increase in fire activity in August 2019 and a gradual rise in deforestation across multiple years, a team of scientists at NASA and the University of California-Irvine has been watching closely for signs of how the 2020 season might shape up. Several worrisome signs have emerged.
In May and June 2020, warm Atlantic Ocean surface temperatures pointed to a greater risk of drought for key parts of the Amazon rainforest. Satellite-based deforestation tracking systems also have observed large patches of rainforest being razed in recent months, suggesting there is plenty of drying wood primed to burn. Finally, experts have warned that current economic conditions and incentives make land-clearing more likely.
But there is at least one piece of good news: NASA-funded researchers have developed new tools that will make it easier for governments and other stakeholders to understand what types of fires are burning, where they are burning, and how much risk those fires pose to the rainforest. The satellite-driven, web-based tool quickly classifies fires into one of four categories—deforestation, understory fires, small clearing and agricultural fires, and savanna/grassland fires. The tool was made available on the web on August 19, 2020.
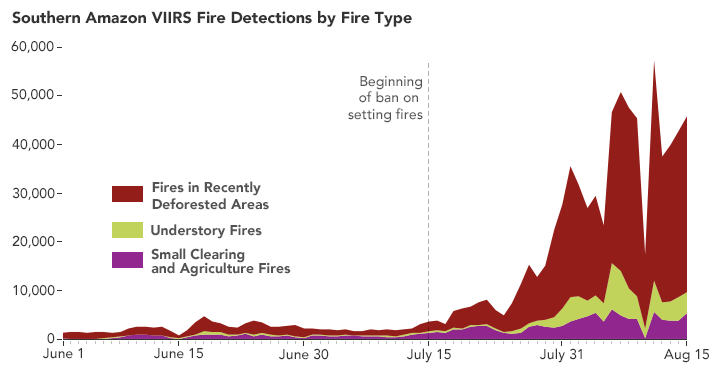
The fire analysis tool is already bringing new clarity and insight to the 2020 fire season. In July, Brazil announced a 120-day ban on fires in the Amazon rainforest; it was presented as an effort to limit ecological damage from fires this year. However, the NASA-led fire analysis indicates that there has been a proliferation of fires in key deforestation hotspots in the southern Amazon states of Pará, Mato Grosso, and Amazonas.
“We see little evidence that the burning moratorium has had an impact. Instead, there is a noticeable increase in fire activity since the moratorium went into effect on July 15,” said Douglas Morton, chief of the Biospheric Sciences Laboratory at NASA’s Goddard Space Flight Center. “We are also finding that large numbers of the fires in those states are clearly deforestation—not small-scale agricultural fires.”
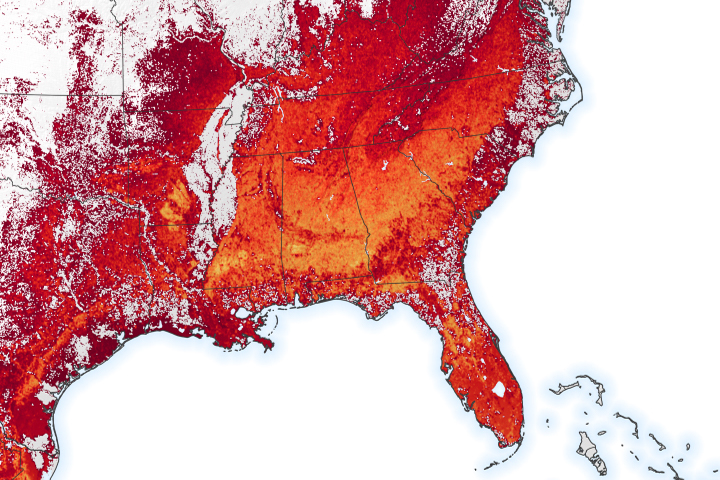
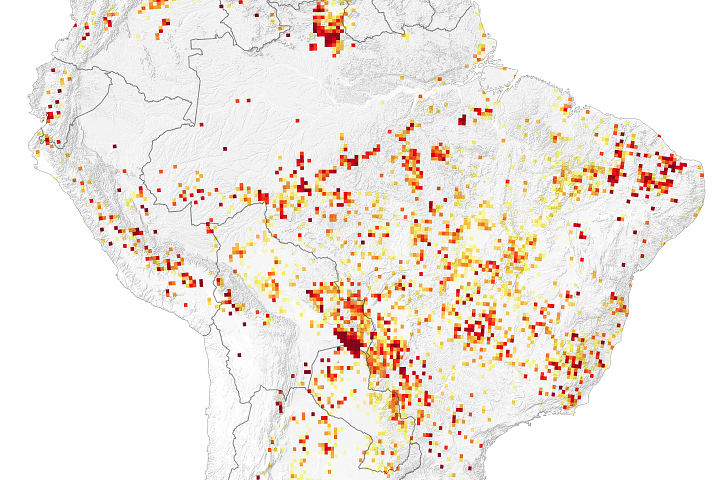
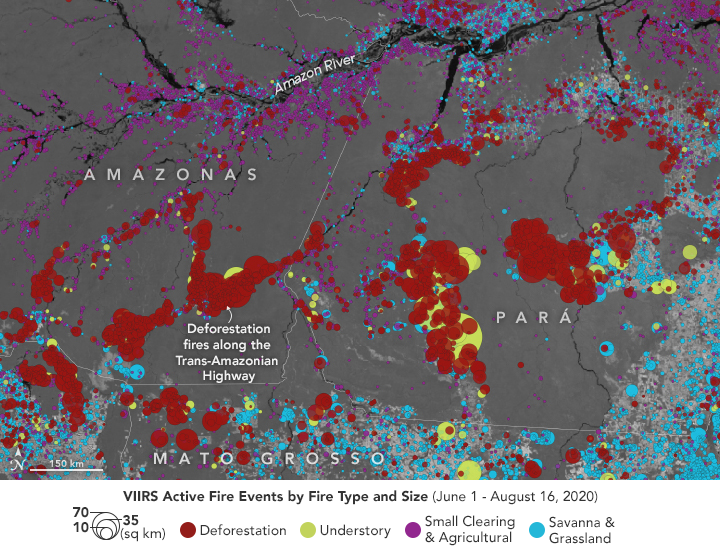
The map at the top of this page depicts all of the fires that satellites detected in key parts of Amazonas and Pará states between June 1 and August 3, 2020. The major roadways that run through the rainforest had large clusters of deforestation fires (red) and occasional understory forest fires (light green). Deforestation fires are part of a multi-step forest-removal process intended to make land usable for ranching and farming. The process begins months to years before fires are set, when forests are first razed by bulldozers and tractors. The trees are usually left to dry for several months to make the wood easier to burn, and fires typically are not set until the dry season.
Understory fires occur when other fire types escape their intended boundaries and burn through leaf litter and woody debris in standing Amazon rainforests. Such fires often have severe ecological impacts because Amazon forests are not adapted to fire. The risk of understory fires increases as the dry season progresses, especially during drought years. Savanna and grassland fires (blue) were also present along highways in this area, but these fires were especially numerous along the edges of the rainforest in eastern Pará and into the Cerrado region of eastern Brazil, where farmers routinely burn pastures to promote the regrowth of grass and savanna vegetation (which is adapted to frequent fires).
Small clearing and agricultural fires (purple) occur in forested areas but are short-lived and not linked to significant new deforestation. In 2020, satellites detected large numbers of these fires along the main stem of the Amazon River, likely caused by farmers burning small clearings or crop residue. (Note that fires with larger perimeters are depicted with larger circles. In general, deforestation and understory fires are significantly larger and longer-lived than the other two fire types.)
The line chart above excludes grassland and savanna fires to highlight the trends in the three fire types that occur in forests. Unlike the map above, the line chart is based on data drawn from the entire southern Amazon—an area that includes all of the Brazilian states of Amazonas, Pará, Rondônia, Acre, and parts of Mato Grosso, and Maranhão. It also includes data from parts of Bolivia, Peru, Ecuador, and Colombia.
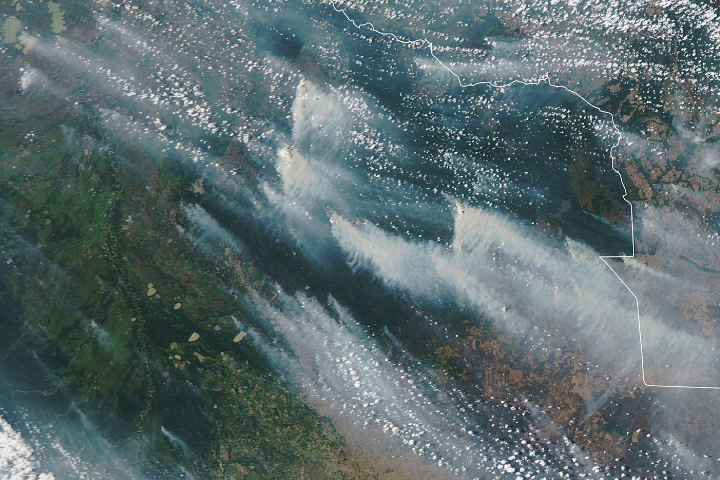
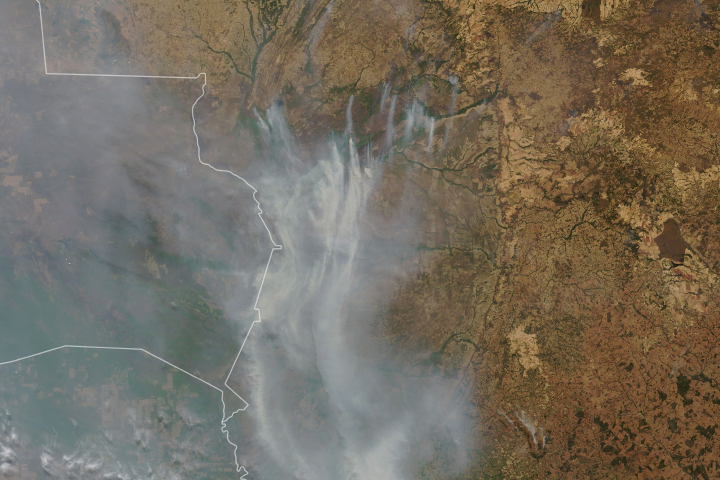
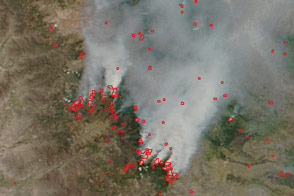
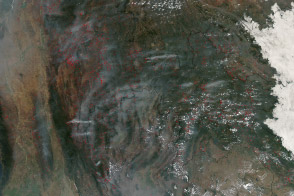
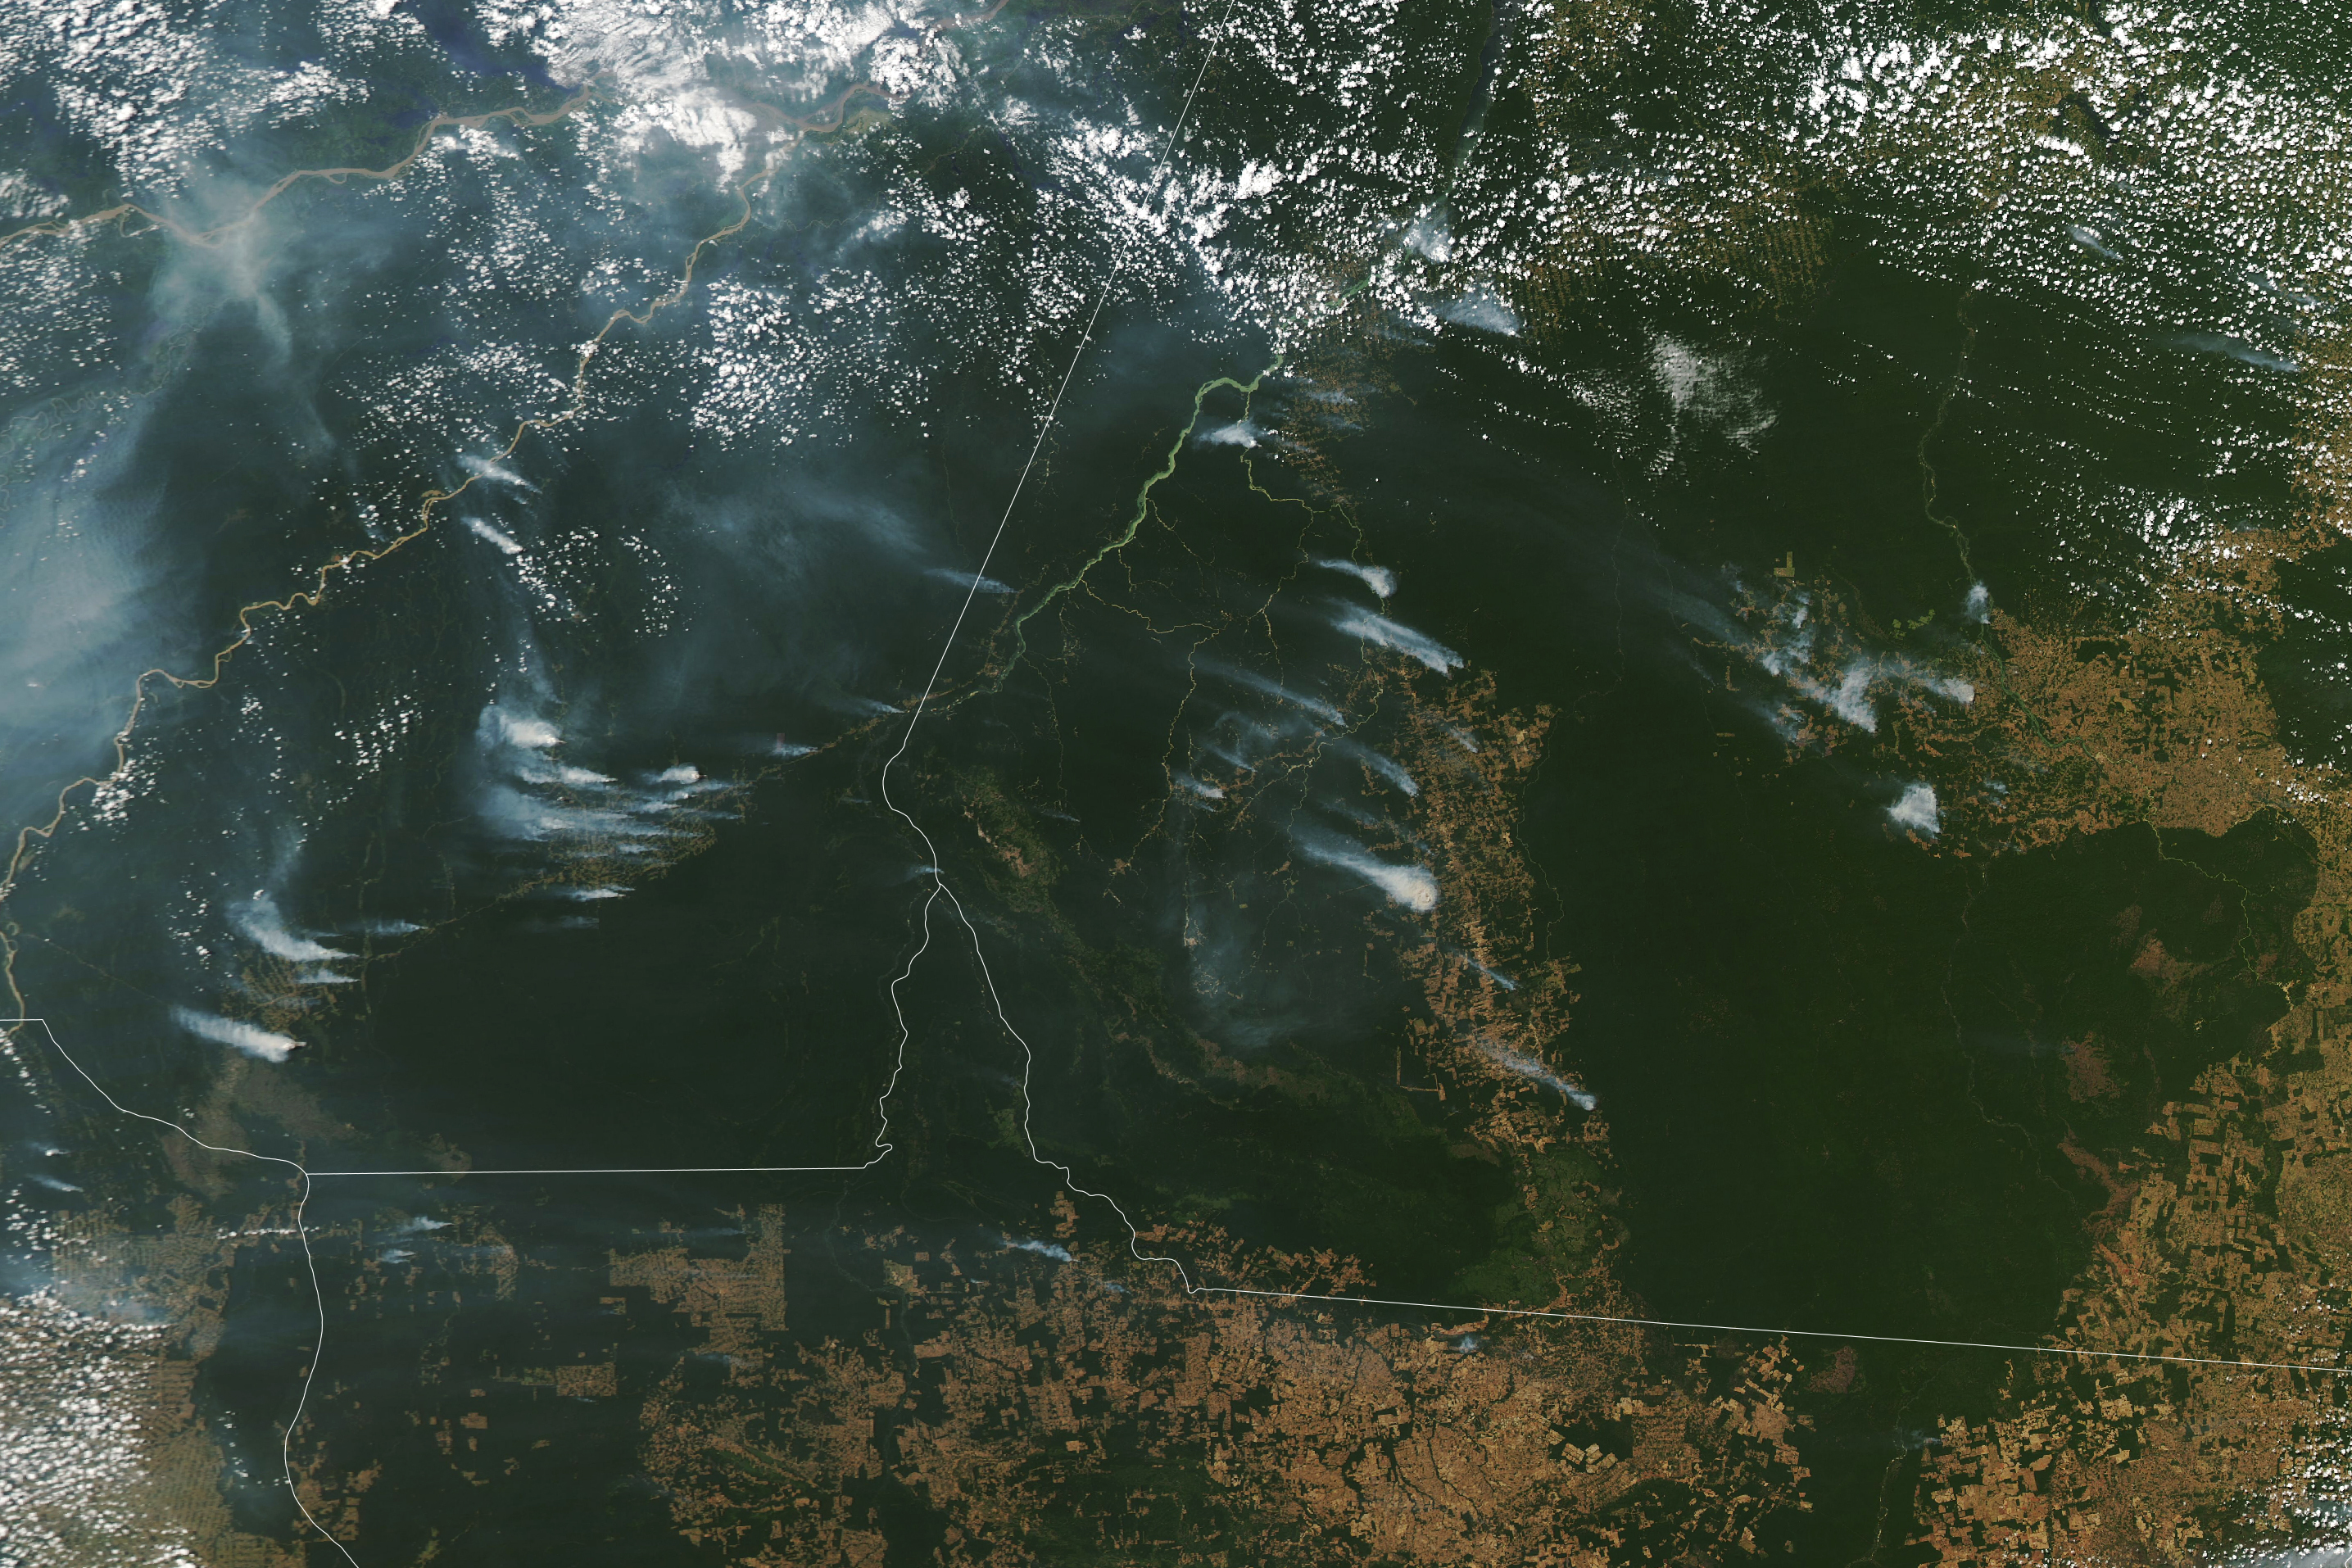
The natural-color satellite image below shows smoke from some of the deforestation fires clustered along major roads, such as the Trans-Amazonian Highway and BR-163. Deforestation fires also proliferated through the region known as “Terra do Meio,” or “land in the middle,” a frontier area in Pará sandwiched between indigenous territories and the Xingu and Iriri rivers. In all of these places, farmers and land speculators have cleared significant amounts of rainforest in recent years in order to expand cattle ranching and large-scale agriculture.
The image was acquired by the Moderate Resolution Imaging Spectroradiometer (MODIS) on NASA’s Aqua satellite on August 1, 2020. Large smoke plumes are another indicator of deforestation fires, as the burning of woody material generates more energy than burning grass; wood-fire smoke plumes rise higher in the atmosphere and spread farther downwind.
Niels Andela, a former NASA scientist who recently moved to Cardiff University, developed the algorithms for the Amazon fire classification tool. “Our analysis clusters active fire detections into individual fire events, and this allows us to track the size, behavior, and characteristics of each fire over time. Together, the fire behavior and land cover information provide a confident means to separate specific fire types,” Andela said. “We can also identify what proportion of the active fire detections come from new fire starts, along with fires that have already been burning for two or more days.”
This new approach provides unprecedented transparency about the number and type of individual fires burning across the Amazon region. The computer algorithm analyzes satellite imagery for characteristics of individual fires in order to separate them into the four types. Deforestation fires, for instance, typically have higher fire radiative power, a satellite-based measure of how much energy a fire releases. The algorithm also takes past deforestation activity into account before categorizing a fire, since the burning process can take several years to completely remove woody material from new pasture or cropland areas. Savanna fires, in contrast, burn less intensely and tend to spread quickly as they char grassy areas and pastures
For each fire listed on the Amazon fire dashboard, scientists rank their confidence in the categorization of the fire as high, medium, or low. These rankings can change over time. For instance, it is initially challenging to distinguish between deforestation and understory fires, but it becomes easier over time because understory fires tend to spread farther and burn steadily over a long period, explained Andela.
The dashboard collects daytime and nighttime fire detections from the VIIRS sensors on the Suomi-NPP and NOAA-20 satellites. Land cover data comes from MODIS and Landsat. And data about the location of recent deforestation comes from Brazil’s National Institute for Space Research (INPE), which draws on multiple satellites to identify such areas.
“We hope this tool pushes the conversation past some of the confusion surrounding the 2019 fire season,” said Morton. “Satellites detect large numbers of fires in South America every year, but not all of these fires are of equal importance.” The most problematic fires are deforestation and understory fires, which do the most lasting damage to intact rainforests. “By providing more information about fire types and locations in real time, we hope this dashboard will give decision-makers better information needed to manage and respond to fires.”
The fire season in the Amazon generally intensifies in August and peaks in September and October. “It looks like we are headed into a situation comparable to 2019, or even worse,” said Paulo Brando, a terrestrial ecologist at the University of California-Irvine, who helped develop the dashboard. “In addition to the area cleared in 2020, we have more than 4000 square kilometers (1,500 square miles) of cleared forests from 2019 that have not been burned yet. A big worry is that if a severe drought develops and make rainforests more flammable, we could soon see one of the worst environmental disasters in Amazonia during the 21st century.”
Click here to explore the Amazon dashboard and download the latest data.
NASA Earth Observatory map and chart by Lauren Dauphin, using data from the GFED Amazon Dashboard team. VIIRS fire data comes from NASA EOSDIS/LANCE and GIBS/Worldview and the Suomi National Polar-orbiting Partnership. MODIS image from NASA EOSDIS/LANCE and GIBS/Worldview. Story by Adam Voiland.