Editor’s Note: This story is part of a series. Please read part 1, part 2, and part 3 for a more complete picture of Amazon deforestation.
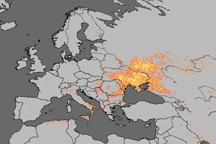
In August 2019, fires in the Amazon dominated the news, inspiring concern from presidents and prime ministers to pop stars to the Pope. As smoke darkened South American skies, people wondered: What caused the fires? Were they unusual? What did they mean for the rainforest?
Scientists at NASA and other international agencies worked overtime to answer such questions, using the satellite and ground-based information available in real-time. But the reality of science, statistics, and satellite observations is that understanding the causes and effects of a fire season takes time. Six months later, some of the answers are coming into clearer focus.
“There is no question the 2019 Amazon fires were unusual, but they were unusual in specific areas and ways,” said Douglas Morton, chief of the Biospheric Sciences Laboratory at NASA’s Goddard Space Flight Center. “Fortunately, we did not see forest fires burning uncontrolled through the rainforest like we have during past drought years. What we did see was a worrisome increase in deforestation fires in certain parts of Brazil.”
Despite the nasty start to the 2019 fire season, year-end tallies of fire hot spot detections and burned area did not break all-time records. “The real nightmare scenario would have been deforestation fires at the level we had in 2019 during a drought year,” said Alberto Setzer, a senior scientist at Brazil’s National Institute for Space Research (INPE). “You would have seen fires spreading into the rainforest and burning unchecked for months.”
The first signs that 2019 could be an especially tumultuous fire season emerged in the northern Brazilian state of Roraima. Between January and April 2019, satellites detected record numbers of hot spots, especially in areas where reports of deforestation were common, explained Setzer. By August, skies were unusually smoky across several states, many state governments had declared emergencies, and controversies about deforestation data and environmental policy simmered in the media.
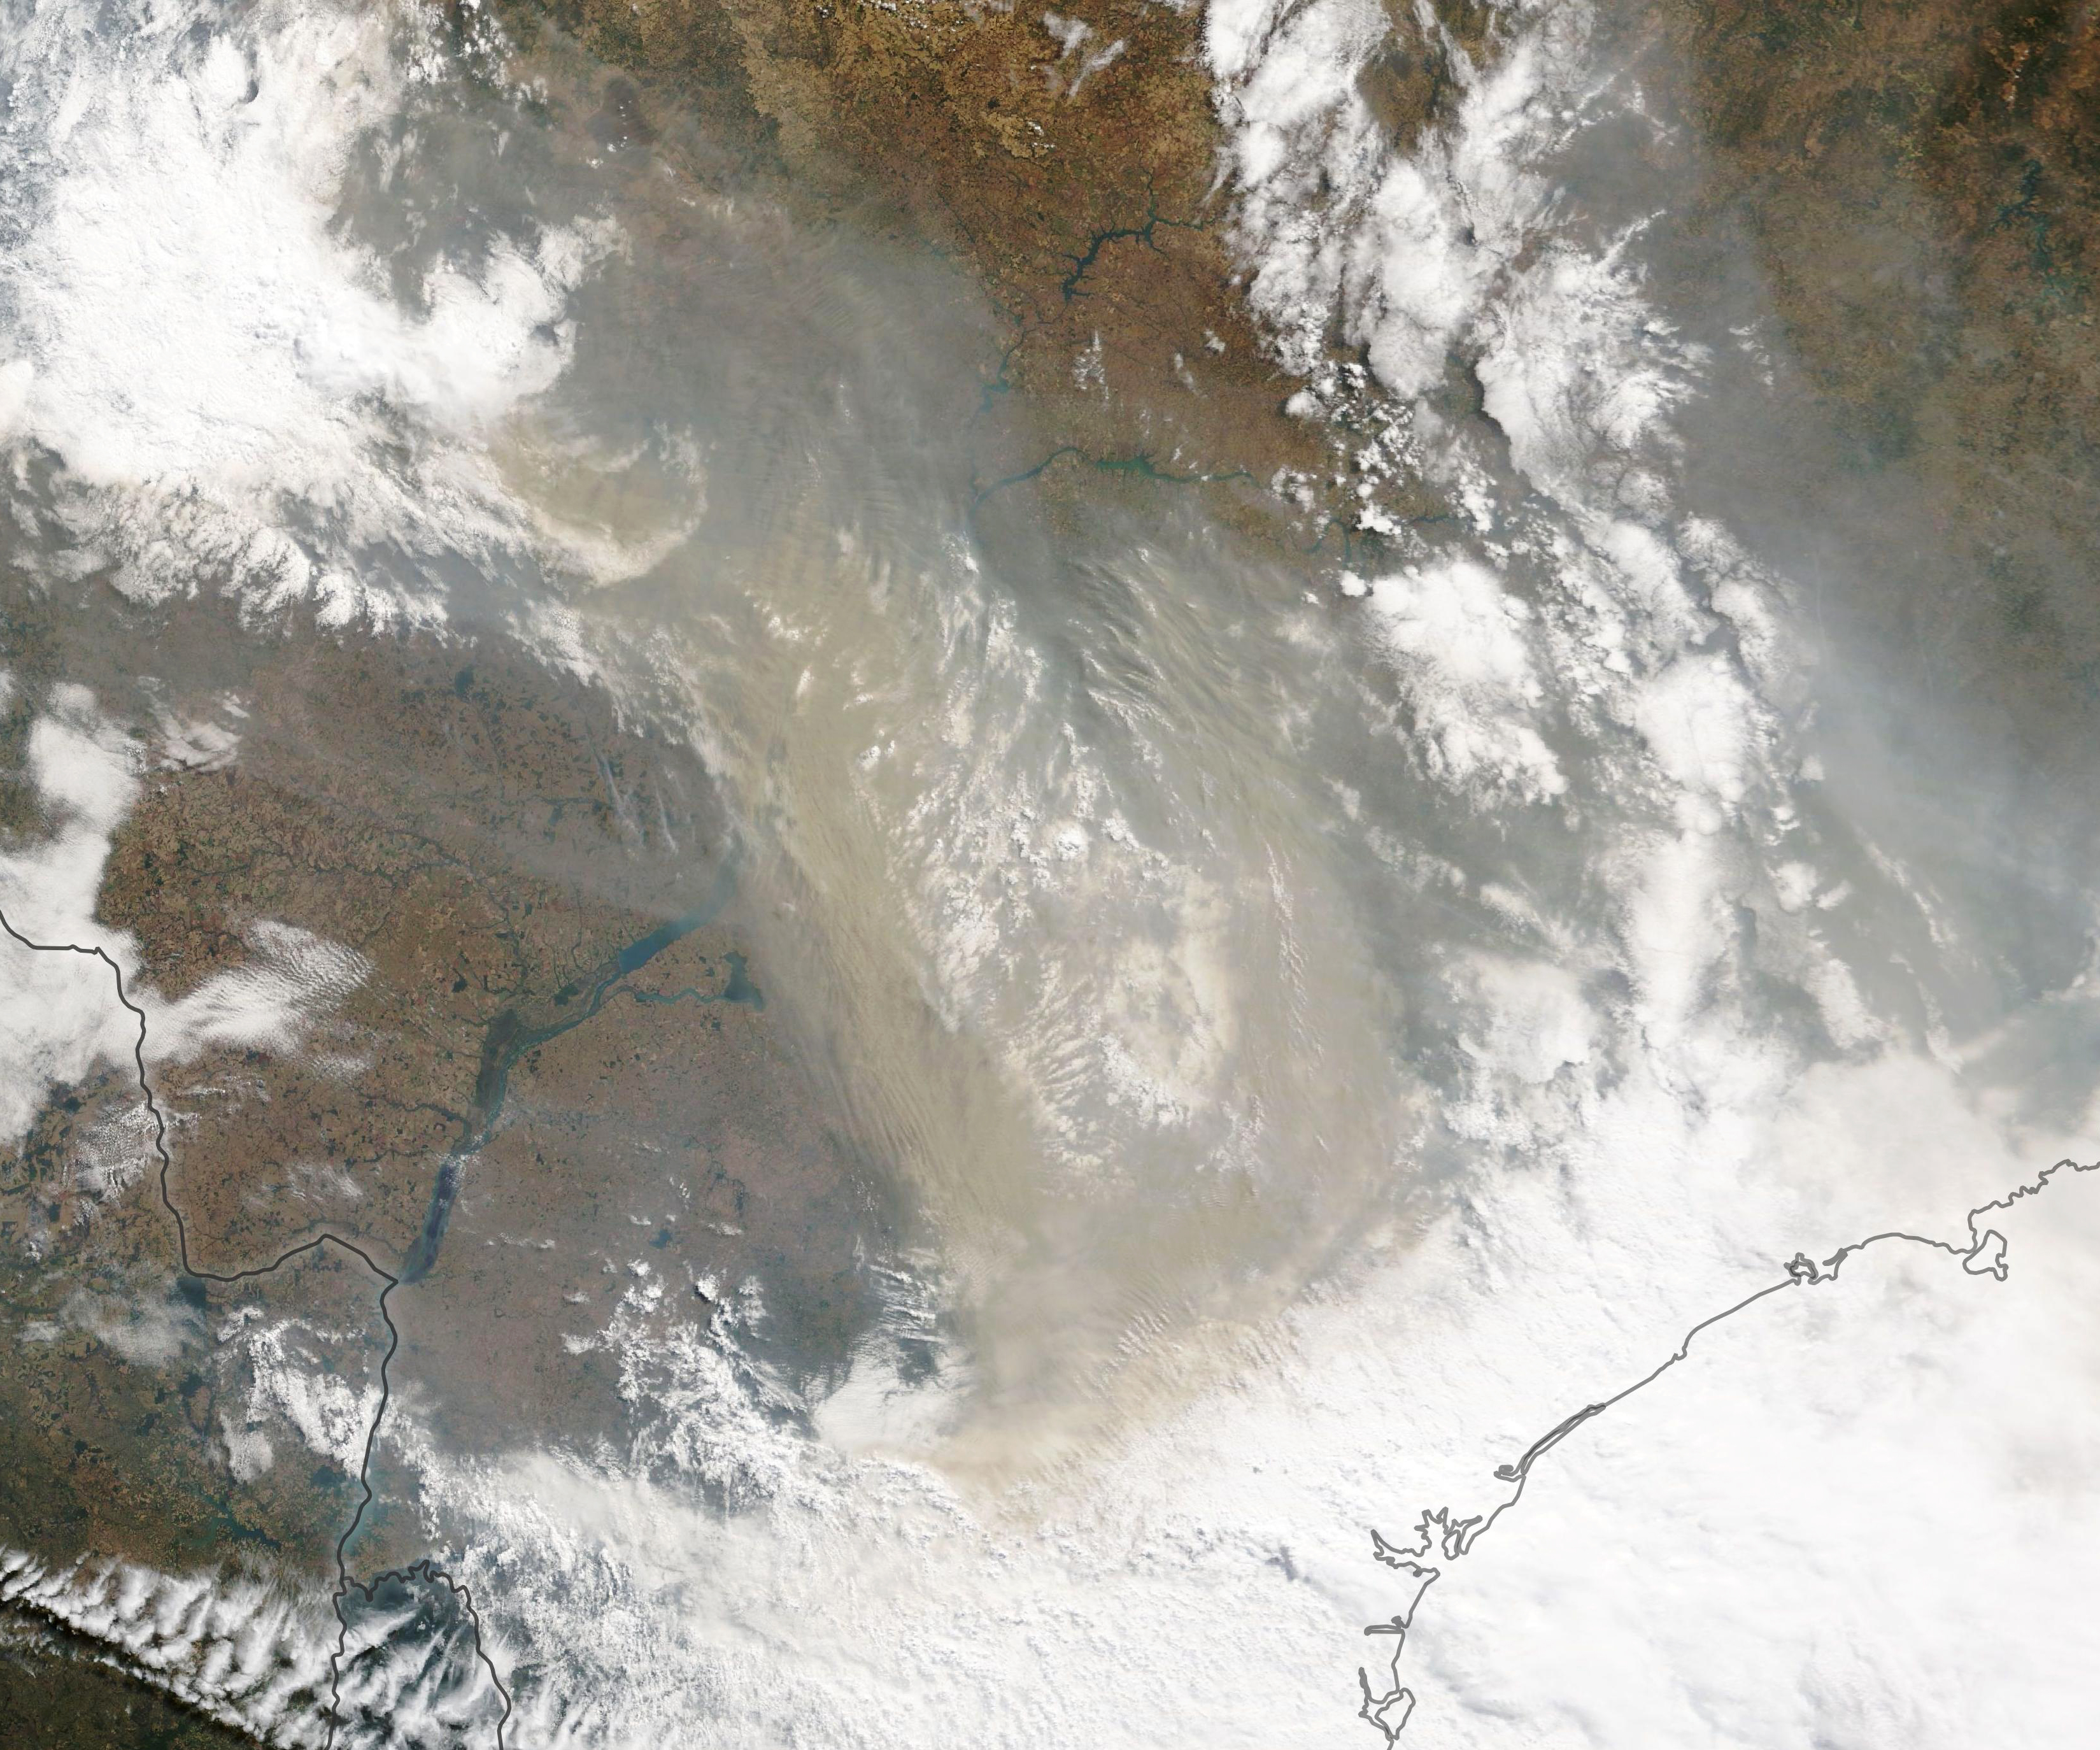
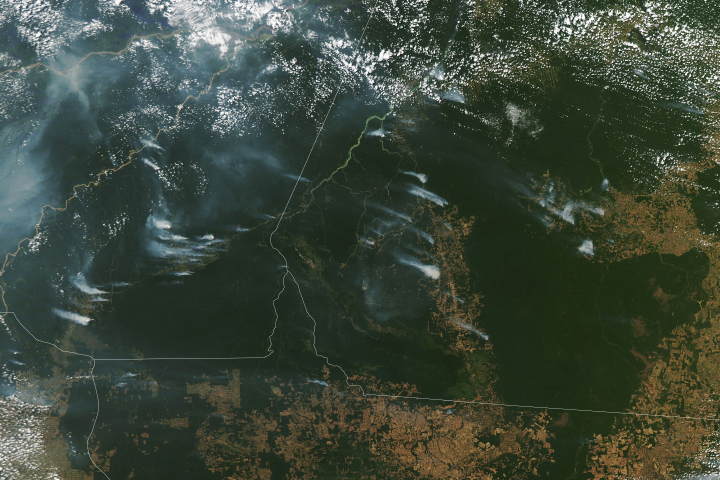
But it was not until the effects of the fires reached São Paulo, Brazil’s media and financial capital, that they became front page news. On August 19, 2019, accumulated smoke from fires in the Amazon and from particularly smoky fires in dry forests along the Bolivia-Paraguay border blew southeast, combined with unusually low clouds, and turned day into night in the city. People were baffled, and the eyes of the world turned to the fires in the rainforest. “There was an incredible hunger for information,” said Louis Giglio, a fire scientist at the University of Maryland and NASA Goddard.
When fire outbreaks occur, it can be hard to assess their extent or severity from the ground, but satellites can help. The Moderate Resolution Imaging Spectroradiometer (MODIS) and the Visible Infrared Imaging Radiometer Suite (VIIRS) instruments on NASA and NOAA satellites detect hot spots associated with fires on a daily basis.
“These ‘active fire’ data are one of the first things people look at,” said Giglio. “But it can be difficult to interpret what all those red spots on a map mean in real time, especially if you’re not an expert in remote sensing. It can be tough even if you are an expert in remote sensing.”
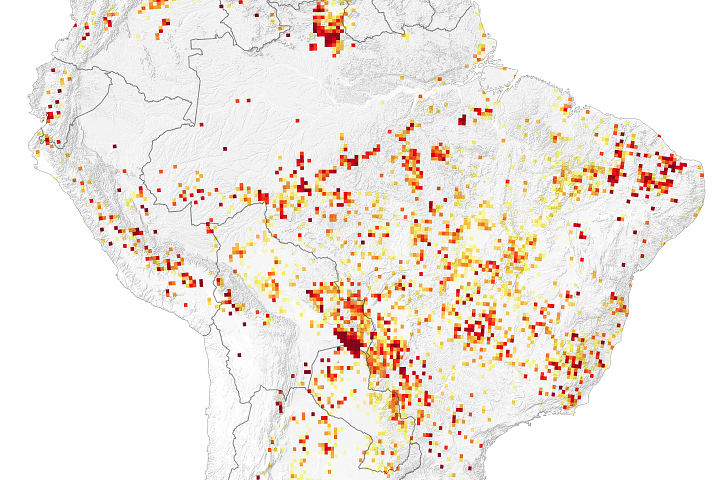
One of the key things to remember about active fire maps such as the one maintained by NASA’s Fire Information for Resource Management System (FIRMS) is how different the fires can be, cautioned Giglio. In tropical South America, red dots may represent small seasonal agricultural fires burning in pastures or between fields; the same dots can also represent big piles of dried wood being torched after rainforest clearcutting; some may represent a fast-spreading grass fire or brush fire in dried-out wetlands or shrubby savannas; and still others may be knee-high fires creeping through the understory of rainforests.
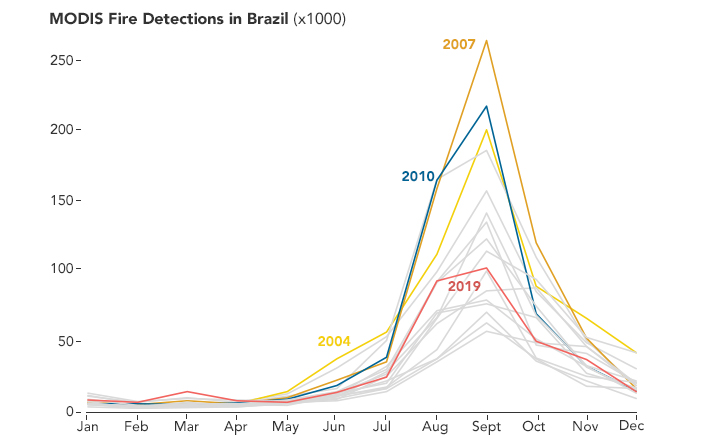
If you look at the total number of hotspots or square kilometers of burned area that satellites detected across South America, just in Brazil, or in certain Brazilian states in 2019, the raw numbers from FIRMS and INPE’s fire monitoring system do not stand out. The line chart above shows the total fire counts as observed in Brazil over nearly two decades of MODIS data.
“If you are comparing fire detections or burned area from 2019 to the full MODIS record,” said Morton, “realize that you are comparing a year without extreme drought or uncontrolled forest fires to years such as 2005, 2007, and 2010 when there were.” Also, fire activity was extremely high in the early years (2001-2004) of MODIS observations because it was not until 2004 that Brazil enacted a series of environmental regulations that reduced fires and the rate of deforestation.
During the past few years, there has been less emphasis on environmental enforcement and fire prevention, so deforestation has been increasing. “One of the ways some people have tried to game the system in recent years is by clearing land in a way that is difficult for satellites to detect—by clearing thin strips along the edge of the rainforest, for instance,” said Morton. “In 2019, deforestation fires started earlier in the dry season, and people burned large clearings. It was similar to fire activity in years with limited environmental enforcement and high deforestation, such as 2003-2004.”
There is another reason the 2019 fire counts and burned area did not end up at the top of the long-term fire records. As public outrage peaked in August and September, the Brazilian government deployed tens of thousands of soldiers to the rainforest to fight fires. Then heavy rains dampened fire activity across much of Amazonia. By October, fire counts and burned area tallies had fallen to nearly record-low levels in many areas.
“If the military hadn’t intervened and the rains hadn’t picked up, there is no doubt that the totals for the year would have been much higher,” said Setzer.
“Tallying active fire detections for a given area is a reasonable first step if you’re trying to quickly assess or characterize a fire season or fire outbreak. But it’s only that — a first step,” explained Niels Andela, one of Morton’s colleagues at NASA. “By looking at other measures like the intensity, location, and duration of fires, it became clear that 2019 was a departure from the norm.”
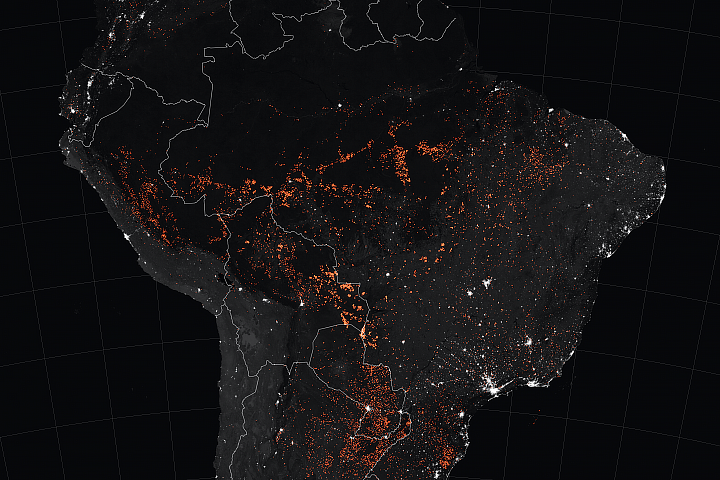
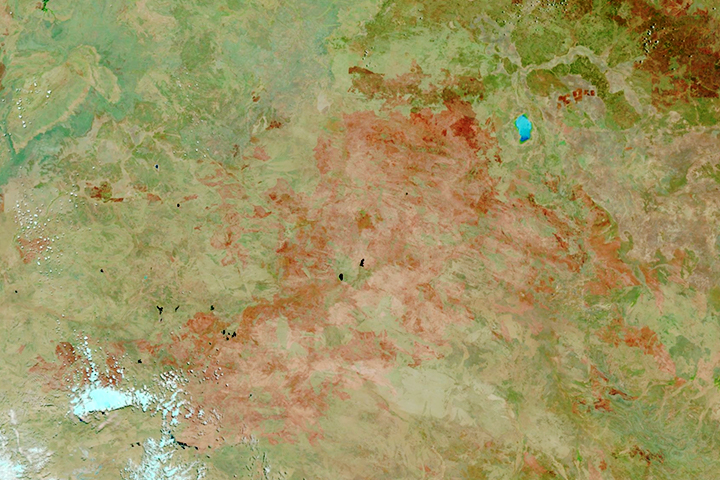
One important point to understand: not all of the red spots on fire activity maps in 2019 were deforestation fires in the rainforest. “A closer look at land cover maps and high-resolution satellite imagery shows that many of the fire detections in 2019 were located in shrublands, grasslands, and savannas that people wouldn’t recognize as rainforest,” explained Giglio. According to INPE data, 34 percent of the total fire hot spots detected in Brazil in 2019 were in Amazonia, the rainforest. In contrast, 50 percent were in the Cerrado, a savanna region with spotty tree cover, plenty of pastures and farms, and large numbers of fires every year. Five percent or less burned in the Brazilian Pantanal—a grassy wetland region in southwestern Brazil—or other biomes.
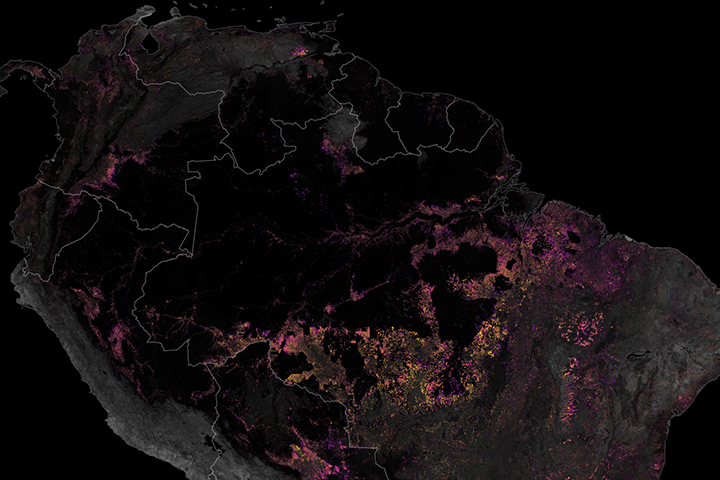
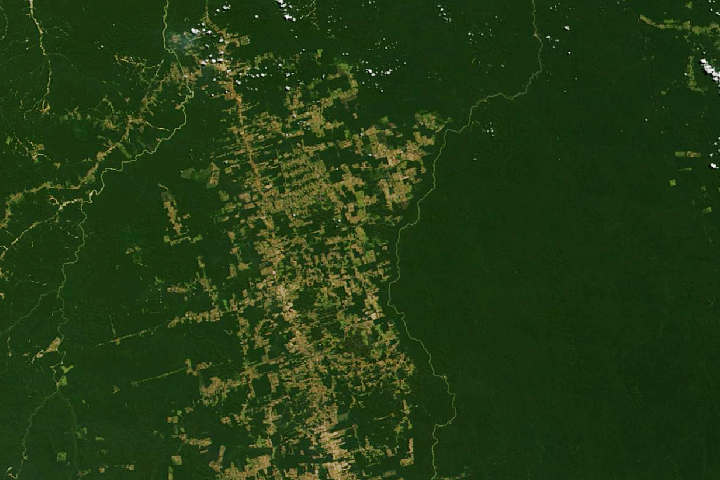
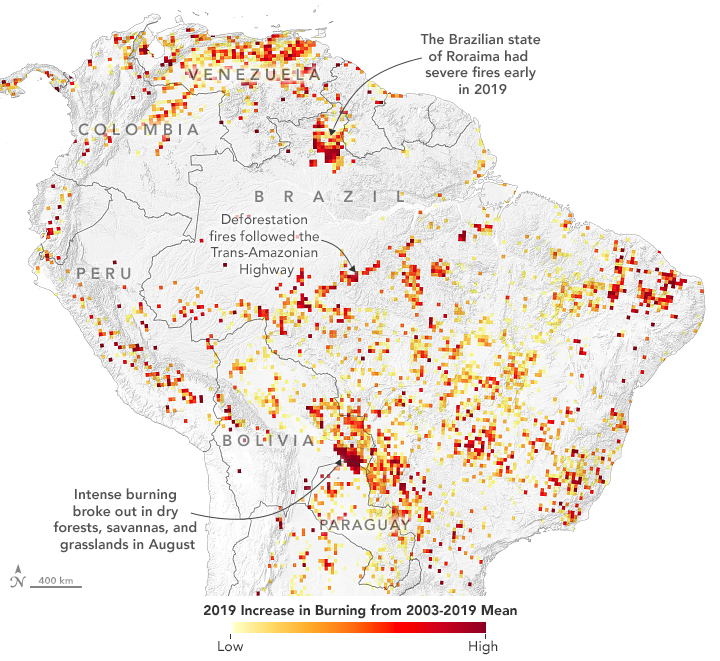
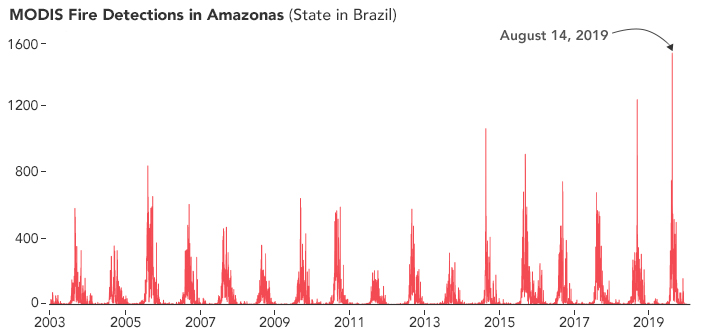
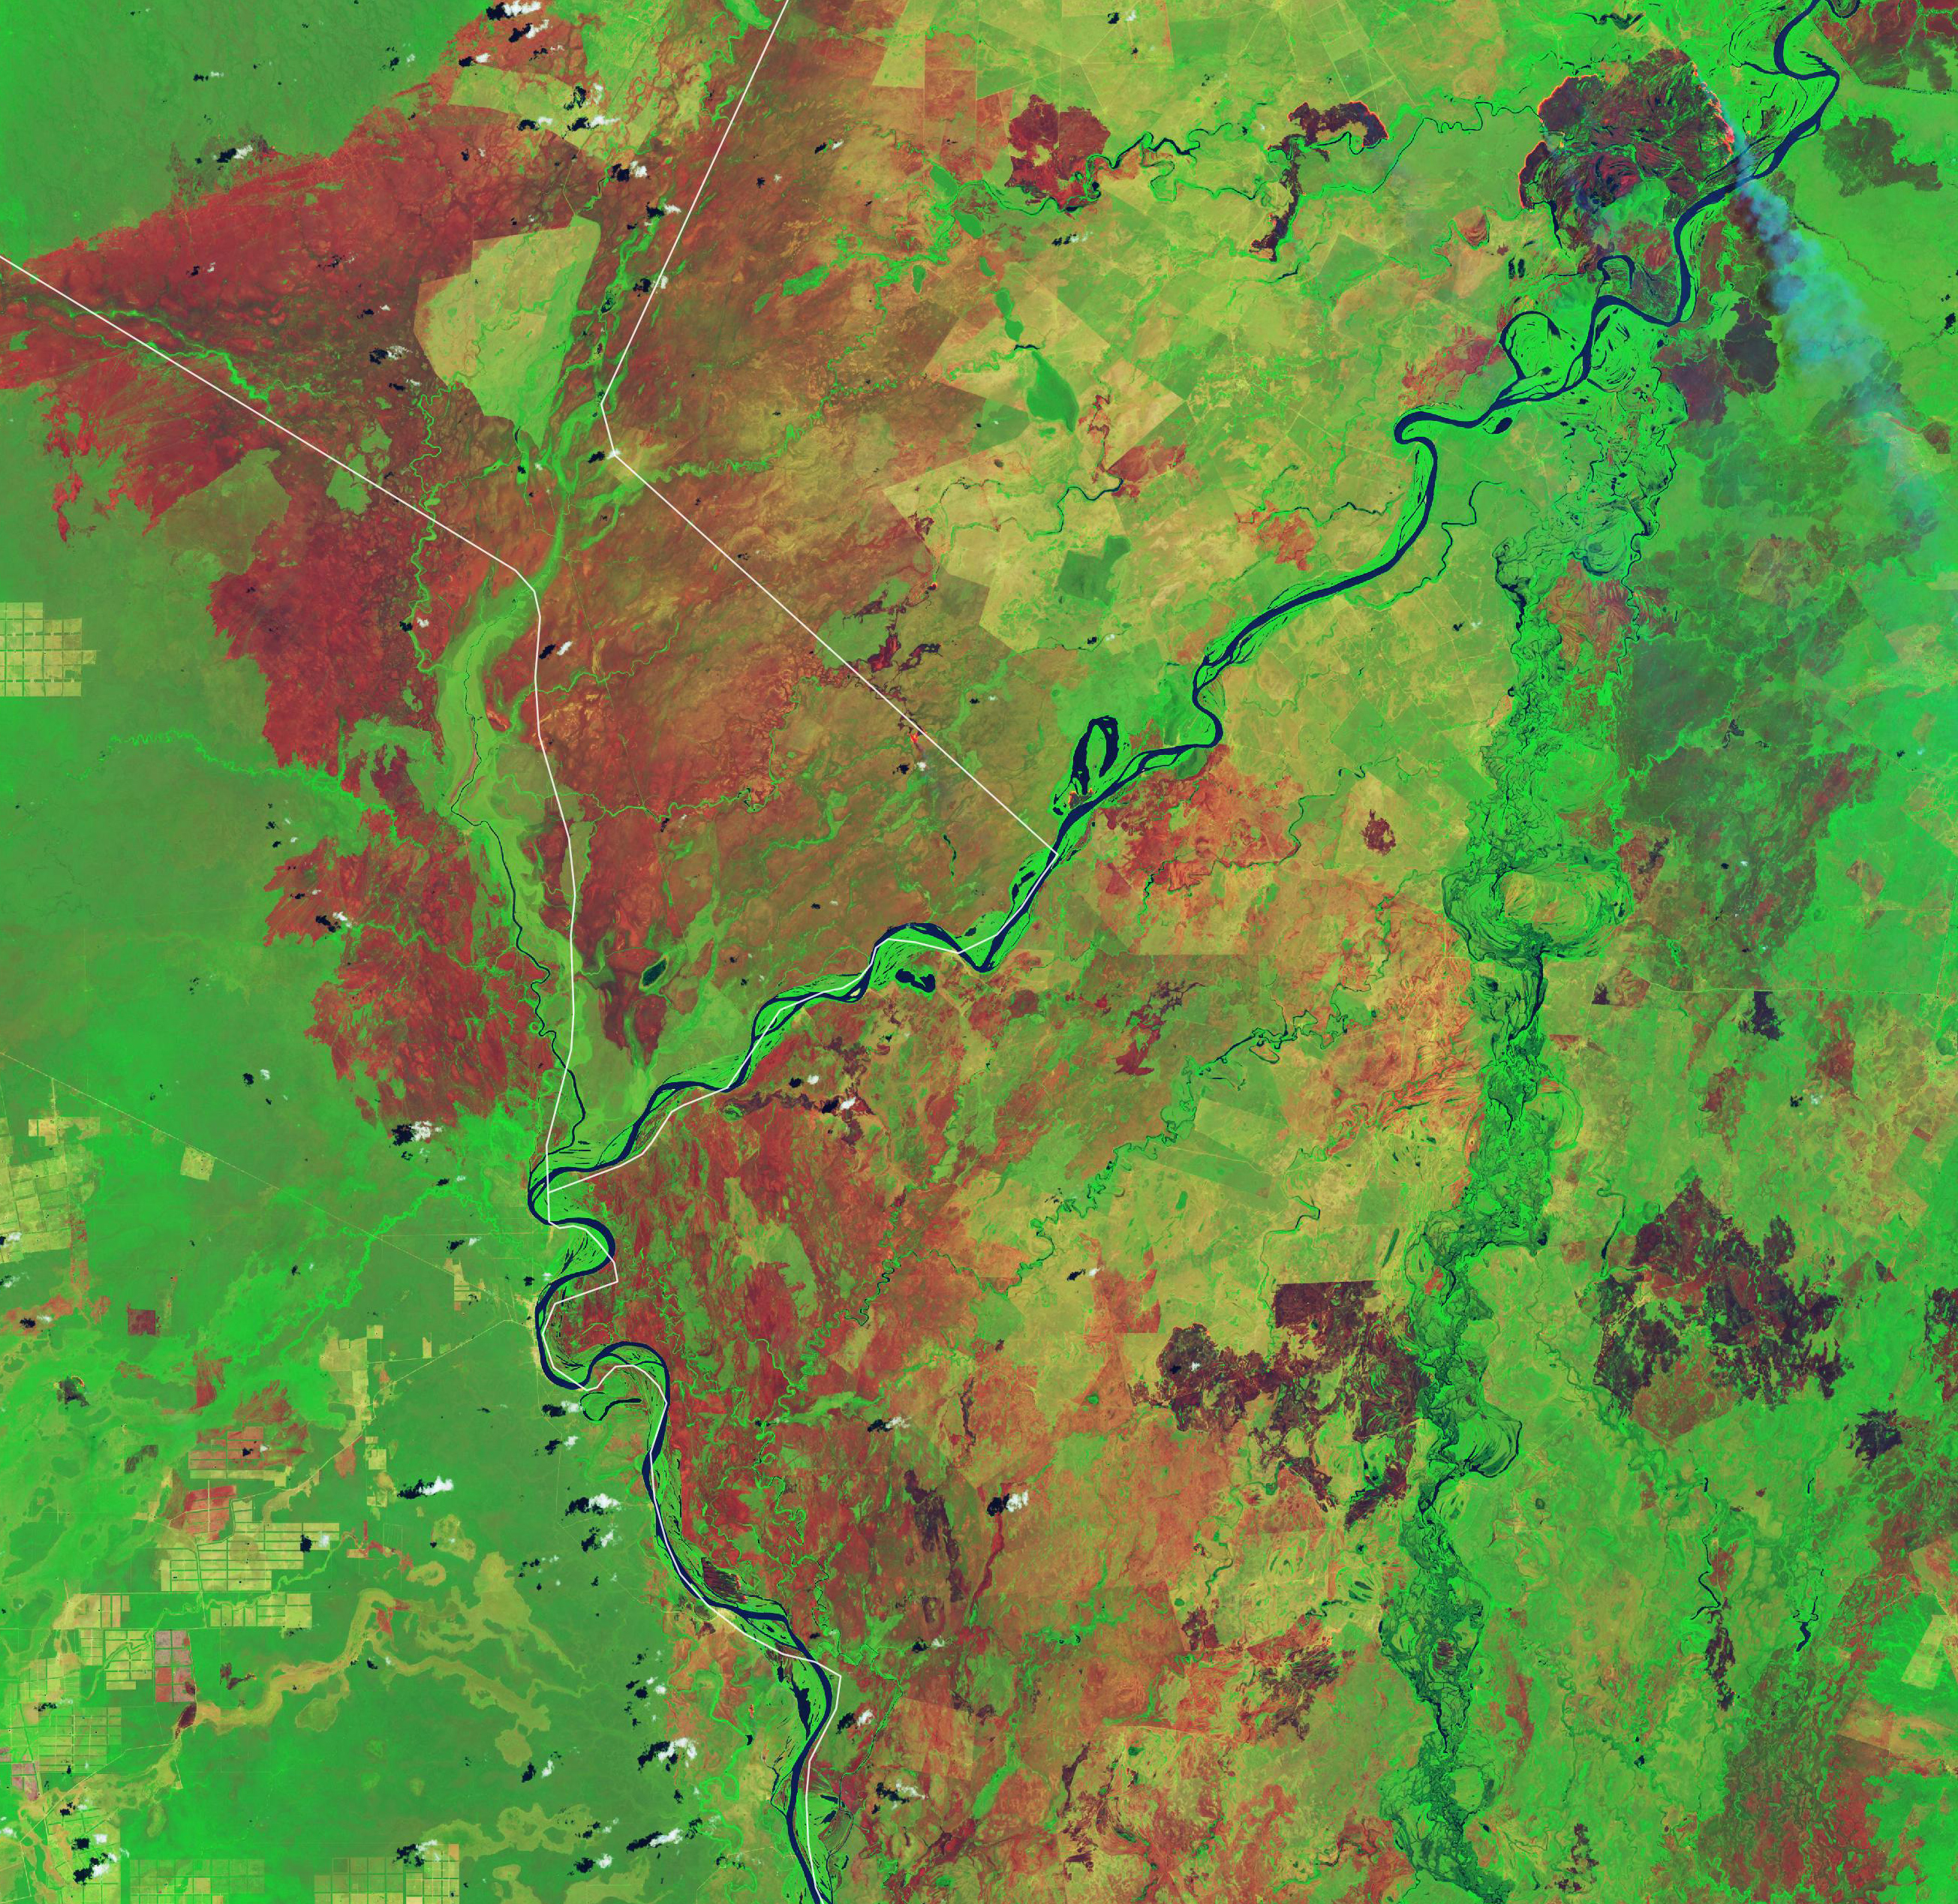
But in certain areas, the story looks different. Fires were especially common along the Trans-Amazonian highway in Brazil’s far western state of Amazonas. According to Giglio, MODIS made 11,516 fire detections in Amazonas in August, the second most the sensor has ever observed for the state in that month. As shown by the burned area map at the top of the page, severe fires also occurred along key highways in Parã, Mato Grosso, and Rondônia where new deforestation of rainforest is common.
While fire activity declined sharply in September across the Brazilian rainforest, fire detections continued to rise in the Cerrado in September. And the Pantanal in Brazil received little relief from either the military or the weather. Intense fires—many of them uncontrolled pasture fires and some ignited by lightning—raced through dried grasslands there, as well as through nearby dry forests in Paraguay and Bolivia (most notably the Gran Chaco and Chiquitano forests) from August until November. The fires in this region jump out as an area of particularly anomalous burning in the burned area map at the top of the page. But if you look at the number of fire detections for Brazil, Paraguay, or Bolivia or for certain ecoregions, the numbers do not necessarily stand out because the fire detections get divided between three countries and multiple ecoregions.
“One of the things I was reminded of during the 2019 Amazon fires—and after many big fire events around the world—is that you have to be really aware of how people are defining boundaries when you are interpreting statistics,” said Giglio. “If you aren’t careful, it is easy for important stories or anomalies to get lost or under- or over-represented.”
For Setzer, 2019 was a potent reminder of the value of remote sensing. “In Brazil, we had people taking extreme views on both sides of this debate,” he said. “In August, we had people saying nothing of note was happening. You had others saying the entire rainforest had burned down. What actually happened was somewhere in the middle.”
“We had a lot of scrutiny from politicians, from other scientists, from the media, even from common people who compared the satellite data on the Internet to what they were seeing on the ground. Virtually everybody came to the same conclusion: the satellite data was correct. And based on the satellite monitoring, control measures were taken,” said Setzer.
For Morton and Andela, the 2019 fires underscored how much technology has improved and how much research is left to do. “There is a lot more we can glean from the data that satellites are already collecting—especially a measure of intensity called fire radiative power—and from nighttime observations of fires from VIIRS,” said Andela, who is currently working on a study about the 2019 fire season and a project with a NASA/USAID SERVIR Amazonia team to track understory fires with VIIRS. “Since VIIRS is extremely sensitive to fires and now there are two copies of VIIRS in orbit, our ability to detect and track small fires—even those burning underneath the canopy—has increased dramatically.”
“But we also need new platforms for tracking fires because MODIS and VIIRS only take data during just a few short time windows each day,” said Morton, who is in the process of developing plans for a mission that would make measurements several times each day. “That leaves us guessing about what fires are doing the rest of the day.”
NASA Earth Observatory images by Lauren Dauphin, using MODIS data from NASA EOSDIS/LANCE and GIBS/Worldview, Fire Information for Resource Management System (FIRMS) data from NASA EOSDIS, and Landsat data from the U.S. Geological Survey. Burned area anomalies data are courtesy of Louis Giglio. Story by Adam Voiland.