Twenty years ago today, NASA began a new era in the study of Earth. The Terra satellite, flagship of the agency’s Earth Observing System (EOS), was launched into space from Vandenberg Air Force Base on December 18, 1999. It was built to last for six years and 30,000 orbits. It is still flying and taking data at the end of 2019.
The mission of Terra, and of the EOS program as a whole, was to make global simultaneous measurements of the atmosphere, land, biosphere, and oceans in order to understand how they interact and influence each other. The orbiting platform was a great leap for Earth system science—a new tool to observe how the spheres of Earth fit together as a whole, and how they change over days, months, and years.
About the size of a small school bus, Terra flies in a Sun-synchronous polar orbit that takes it from north to south on the daylit side of Earth (and south to north on the night side). The satellite carries five instruments that take coincident measurements; that is, they view the same swaths of Earth at the same time. This allows scientists to observe singular events or seasonal phenomena in different ways, discerning how one environmental signal might affect another.
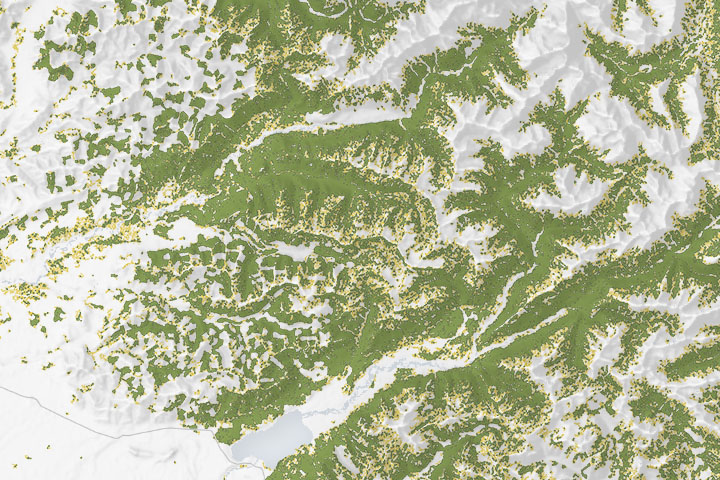
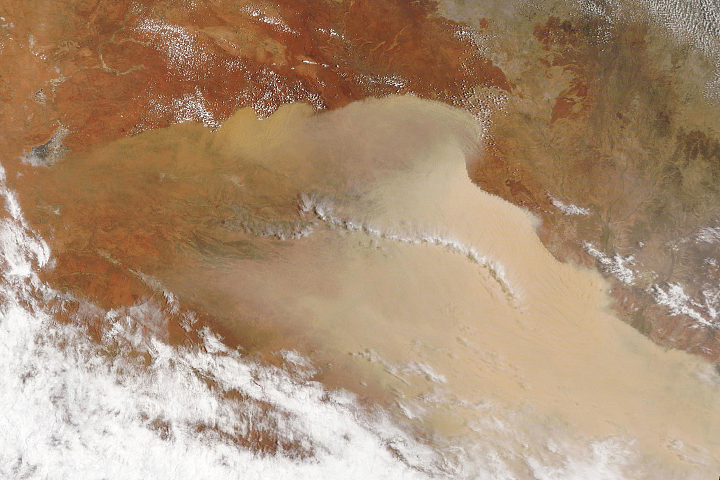
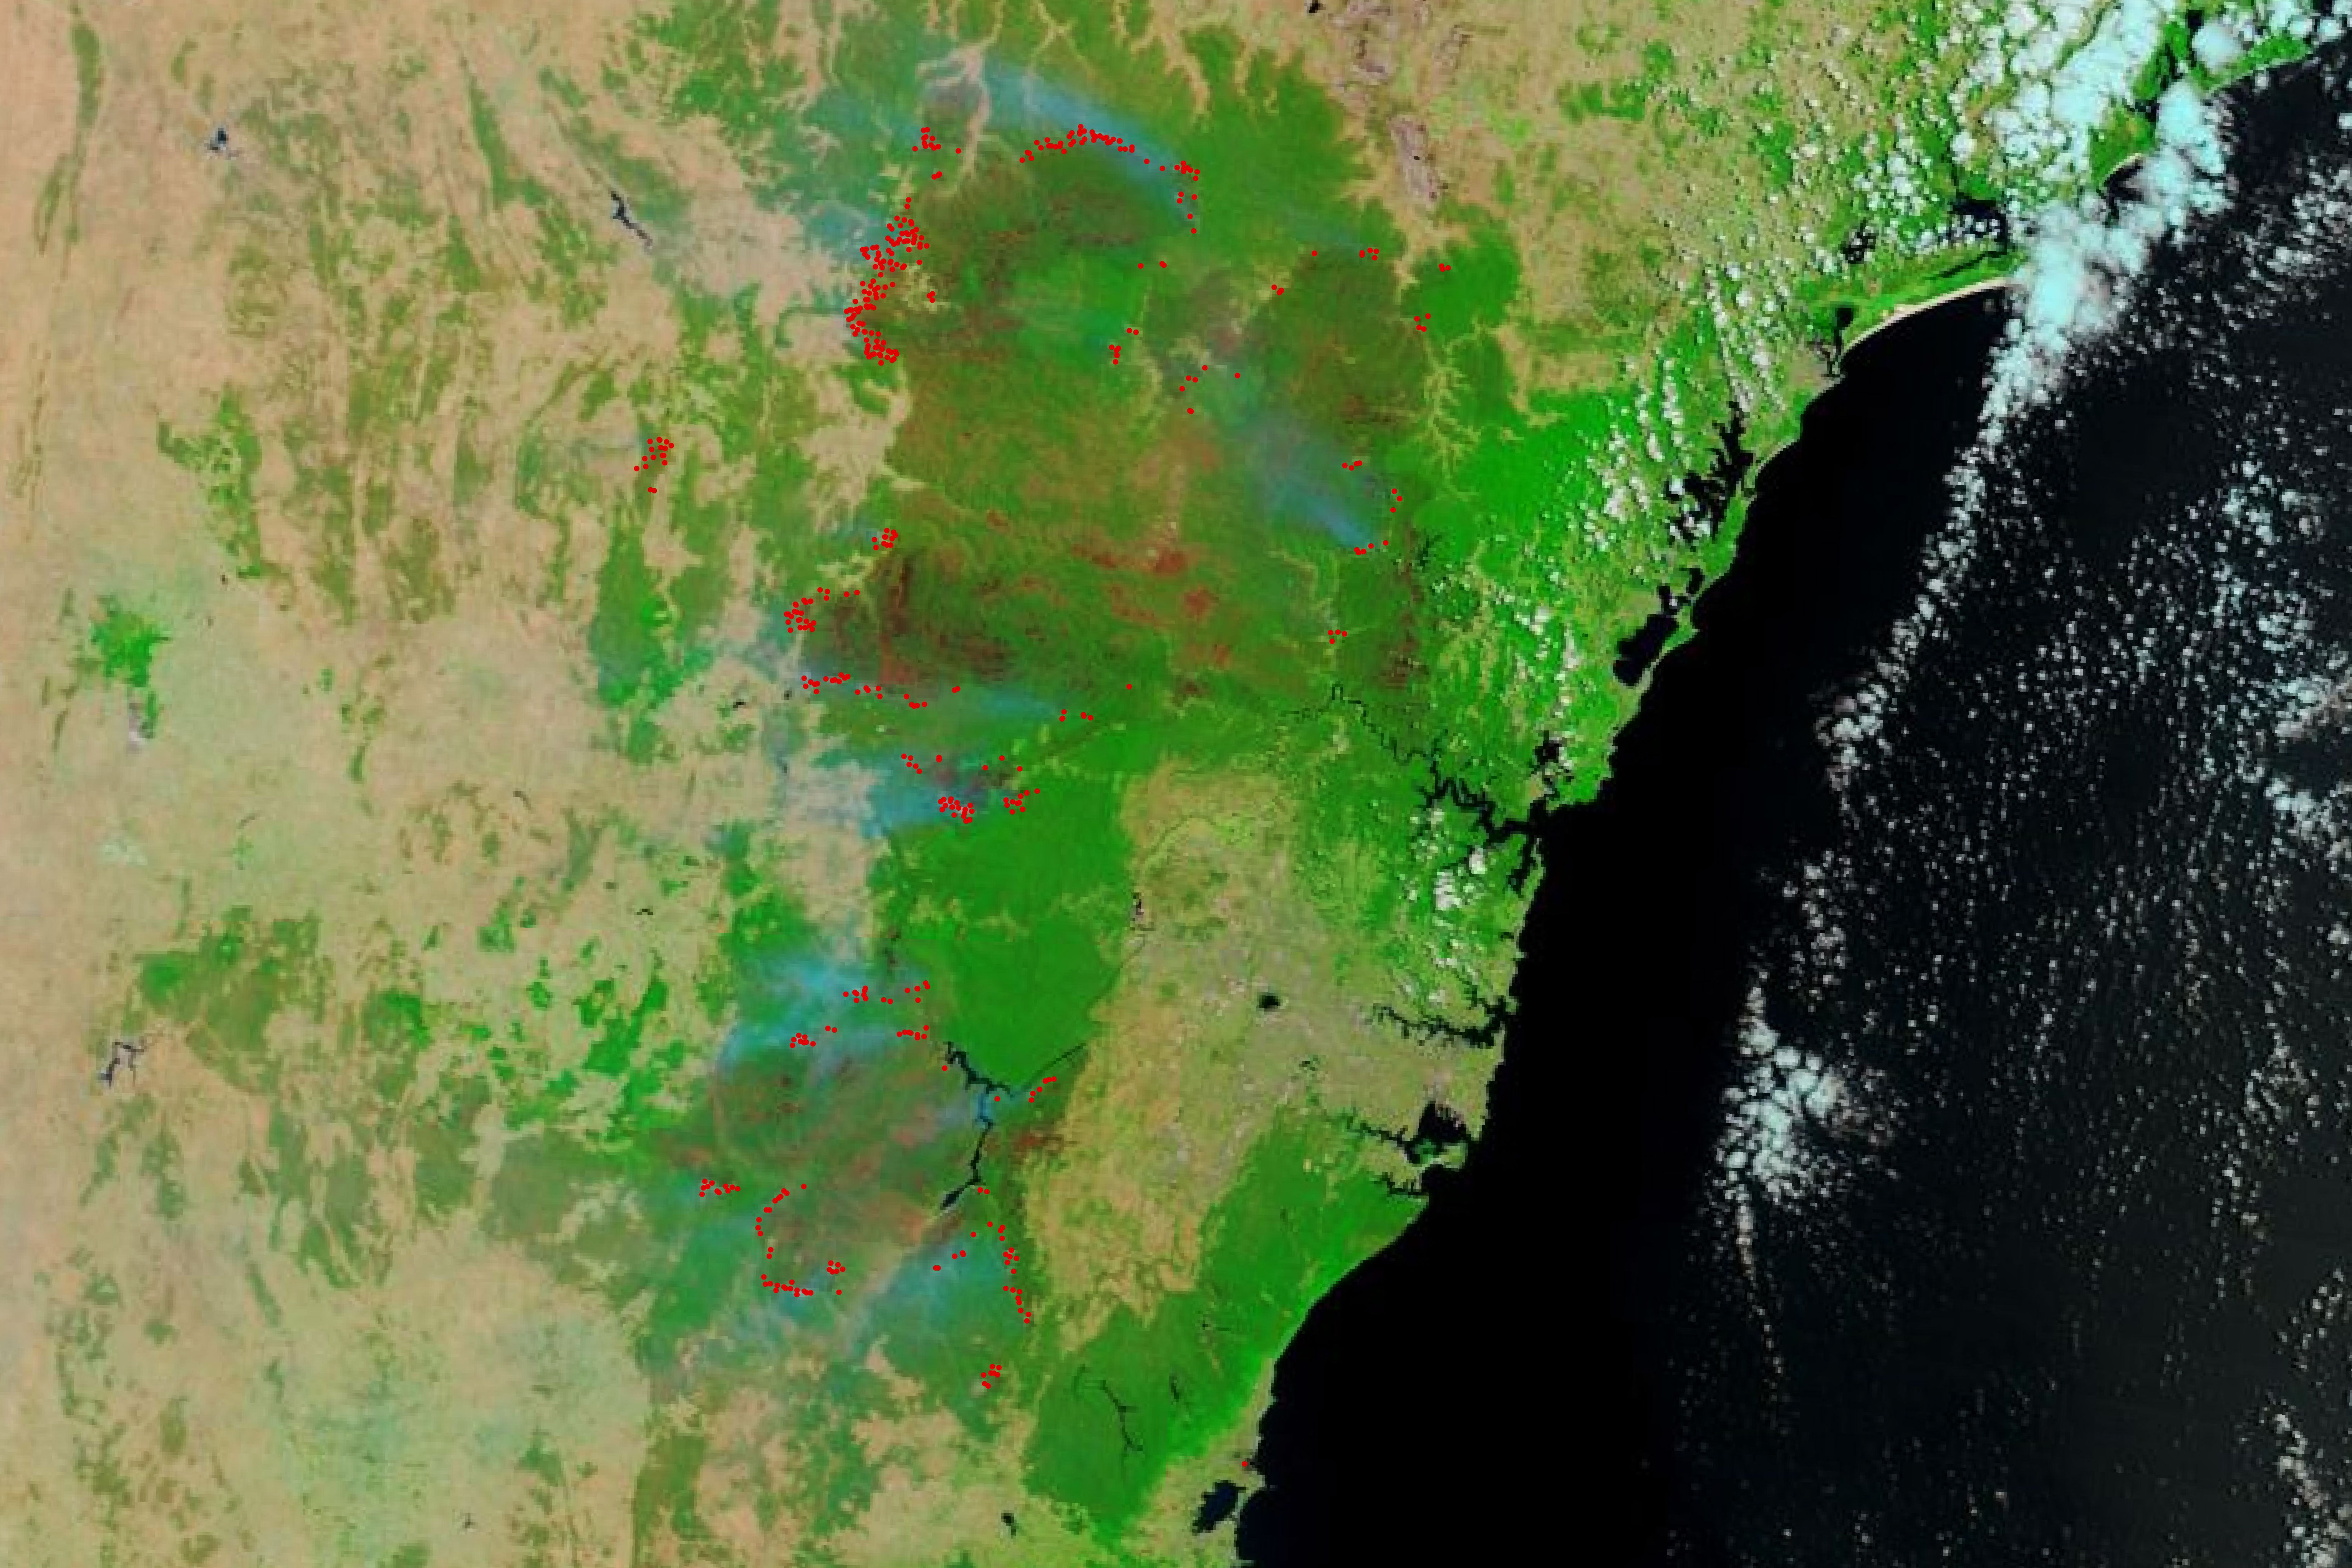
The images on this page represent five different views from Terra of the difficult fire season in Australia in southern hemisphere spring. The image at the top of the page comes from Terra’s Moderate Resolution Imaging Spectroradiometer (MODIS), which observes Earth in 36 different wavelengths. Acquired on December 17, 2019, the false-color image combines visible and infrared light (bands 7-2-1) to distinguish fire burn scars (orange to brown) from healthy vegetation (green) in New South Wales. Red pixels represent areas where Terra detected heat signatures indicative of active fire.
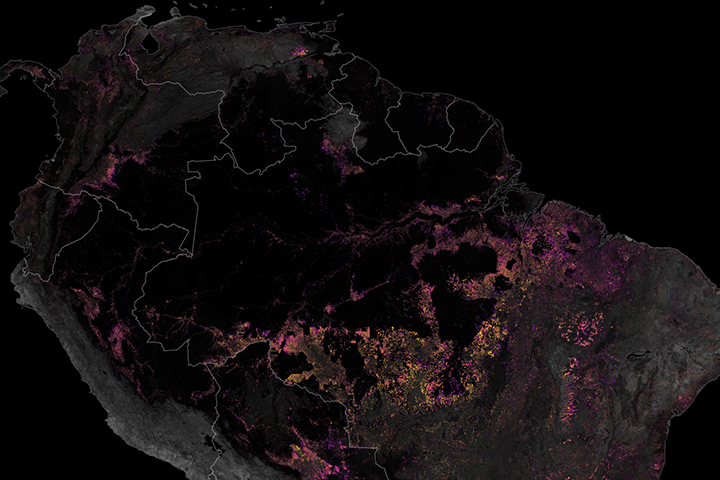
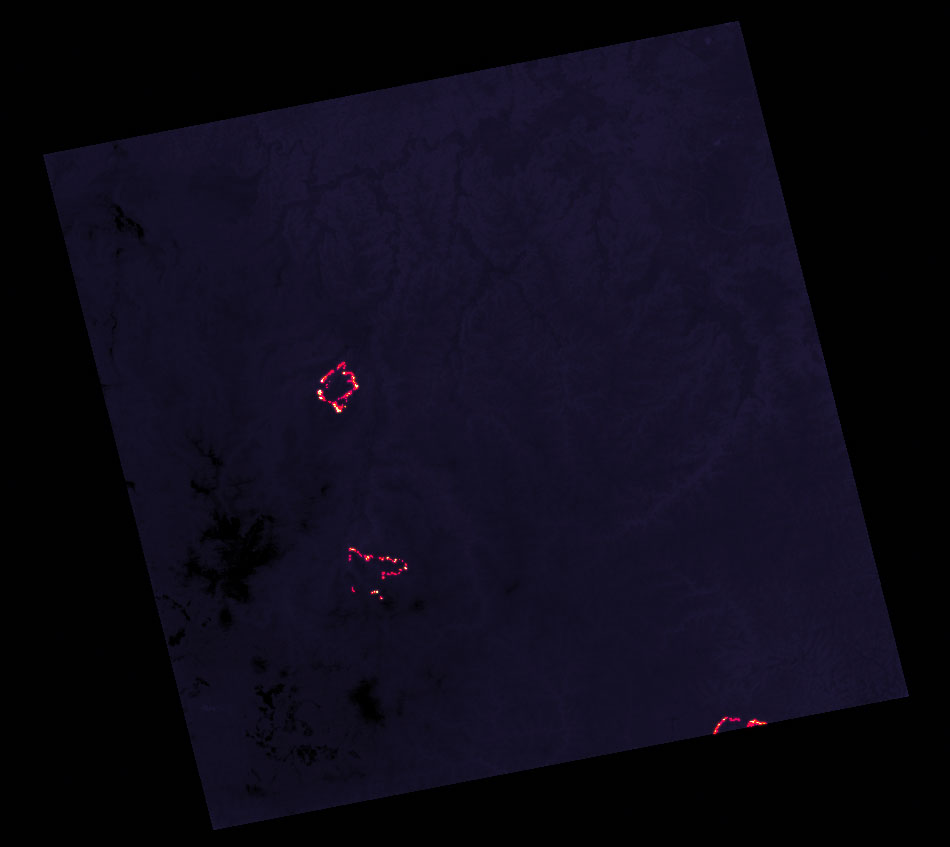
This second image (above) was acquired on December 7, 2019, by the Advanced Spaceborne Thermal Emission and Reflection Radiometer (ASTER). The thermal infrared image shows active fire fronts at night west of Newcastle, Australia. ASTER observes in 14 wavelengths and provides the highest-resolution imagery that Terra can collect. Scientists use ASTER data to create detailed maps of land surface temperature, emissivity, reflectance, and elevation.
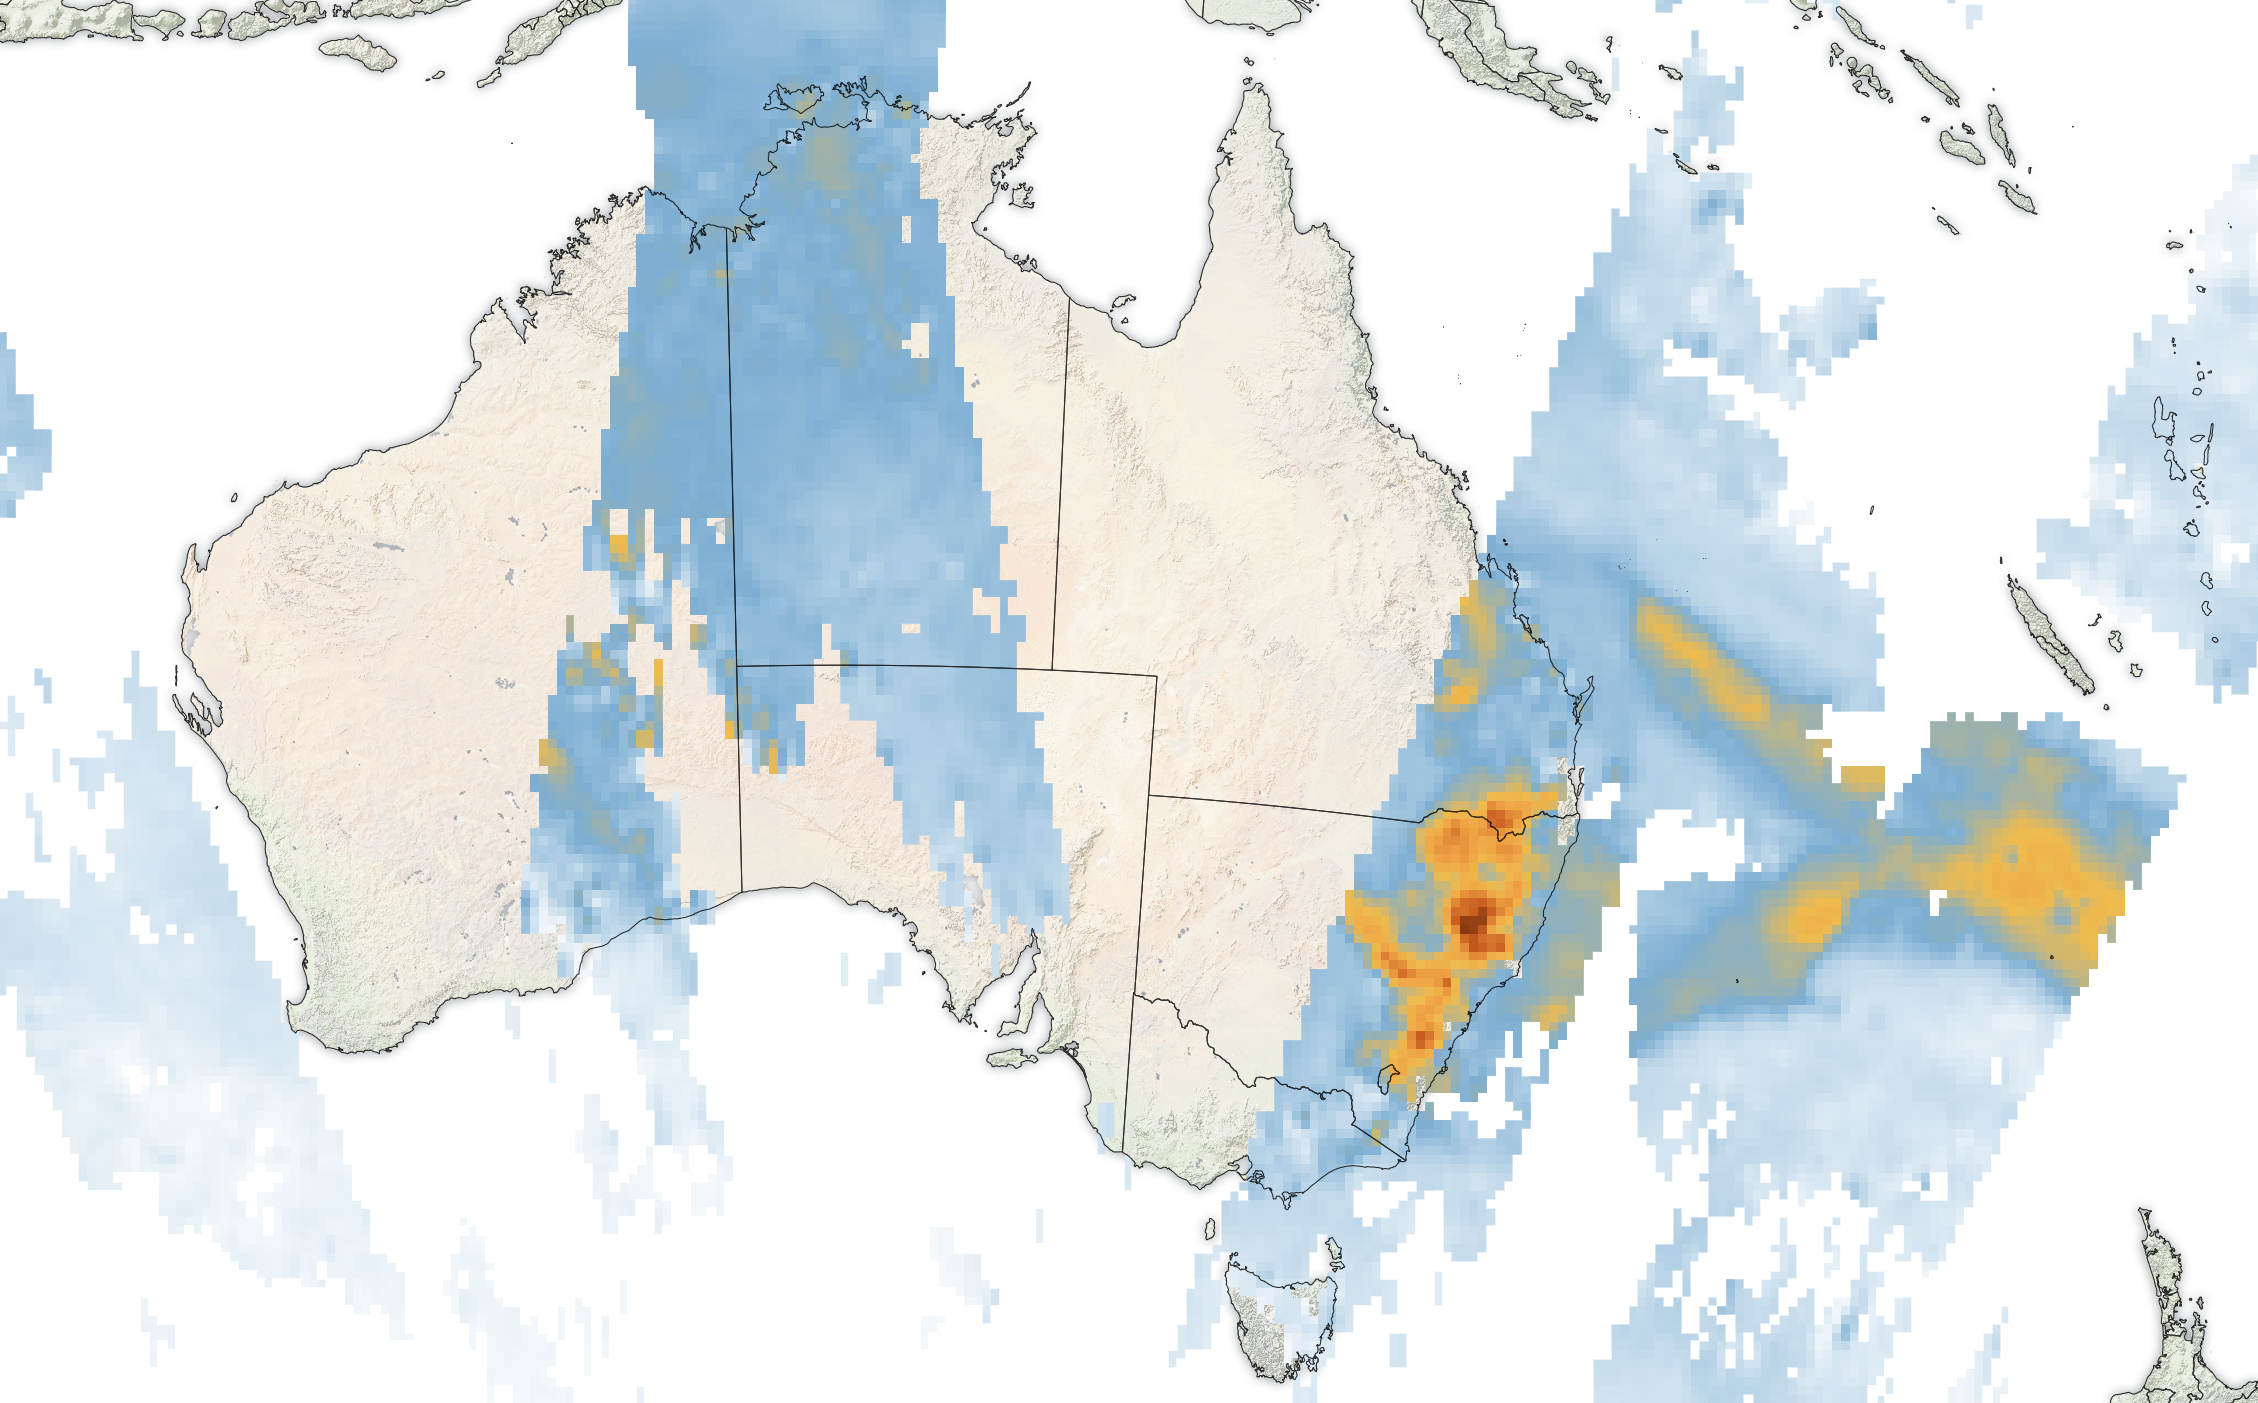
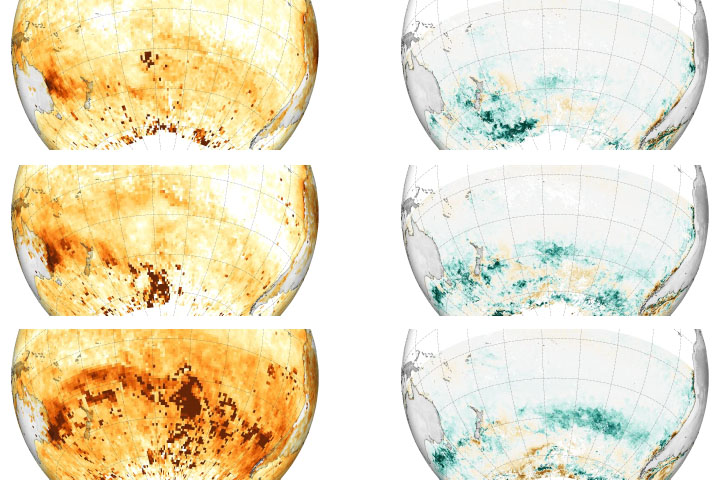
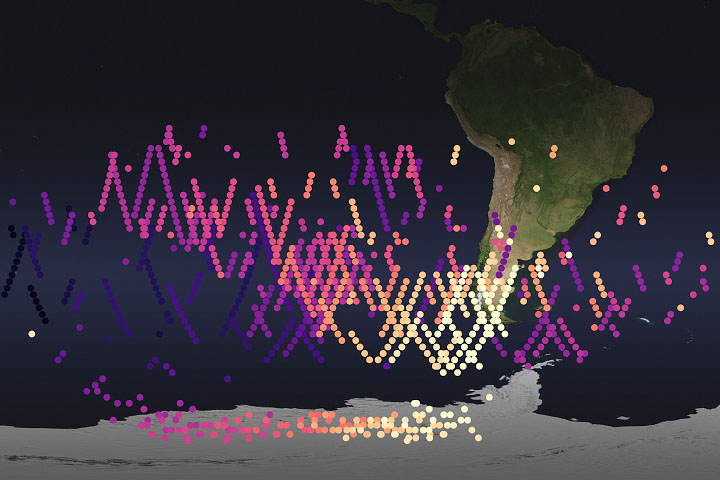
The Measurements of Pollution in the Troposphere (MOPITT) instrument measured the levels of carbon monoxide (CO) in the atmosphere (shown above) on December 8, 2019. Normal levels of CO are less than 2 on this scale. Released by the burning of plants and fossil fuels, carbon monoxide is an odorless gas that is dangerous to breathe; it also can lead to the formation of ground-level ozone. Higher in the atmosphere, CO is a signal of the amount of greenhouse gas being pumped into our ever-warming air.
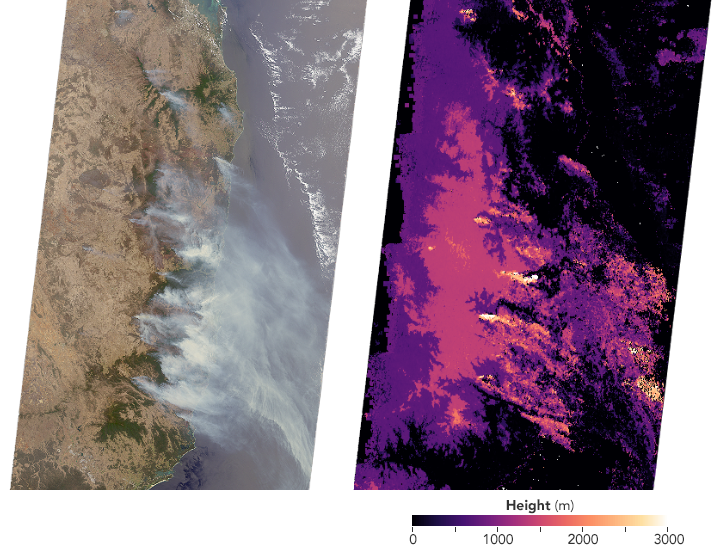
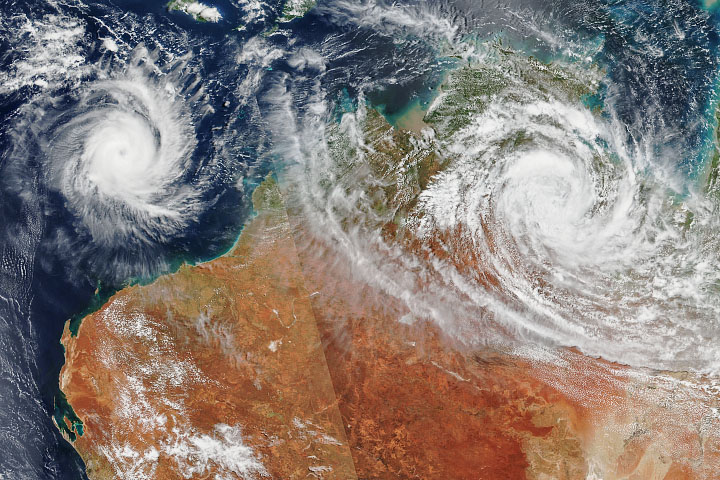
Armed with nine cameras that look ahead and behind the orbit of the satellite, the Multi-angle Imaging SpectroRadiometer (MISR) is a key instrument for measuring aerosol concentrations and properties in the atmosphere. The data above, collected on November 14, 2019, show plumes of aerosol-laden smoke rising from fires in New South Wales. The left image is natural-color, while the right image uses stereoscopic pattern matching to discern the height of clouds and of the smoke plumes in the atmosphere.
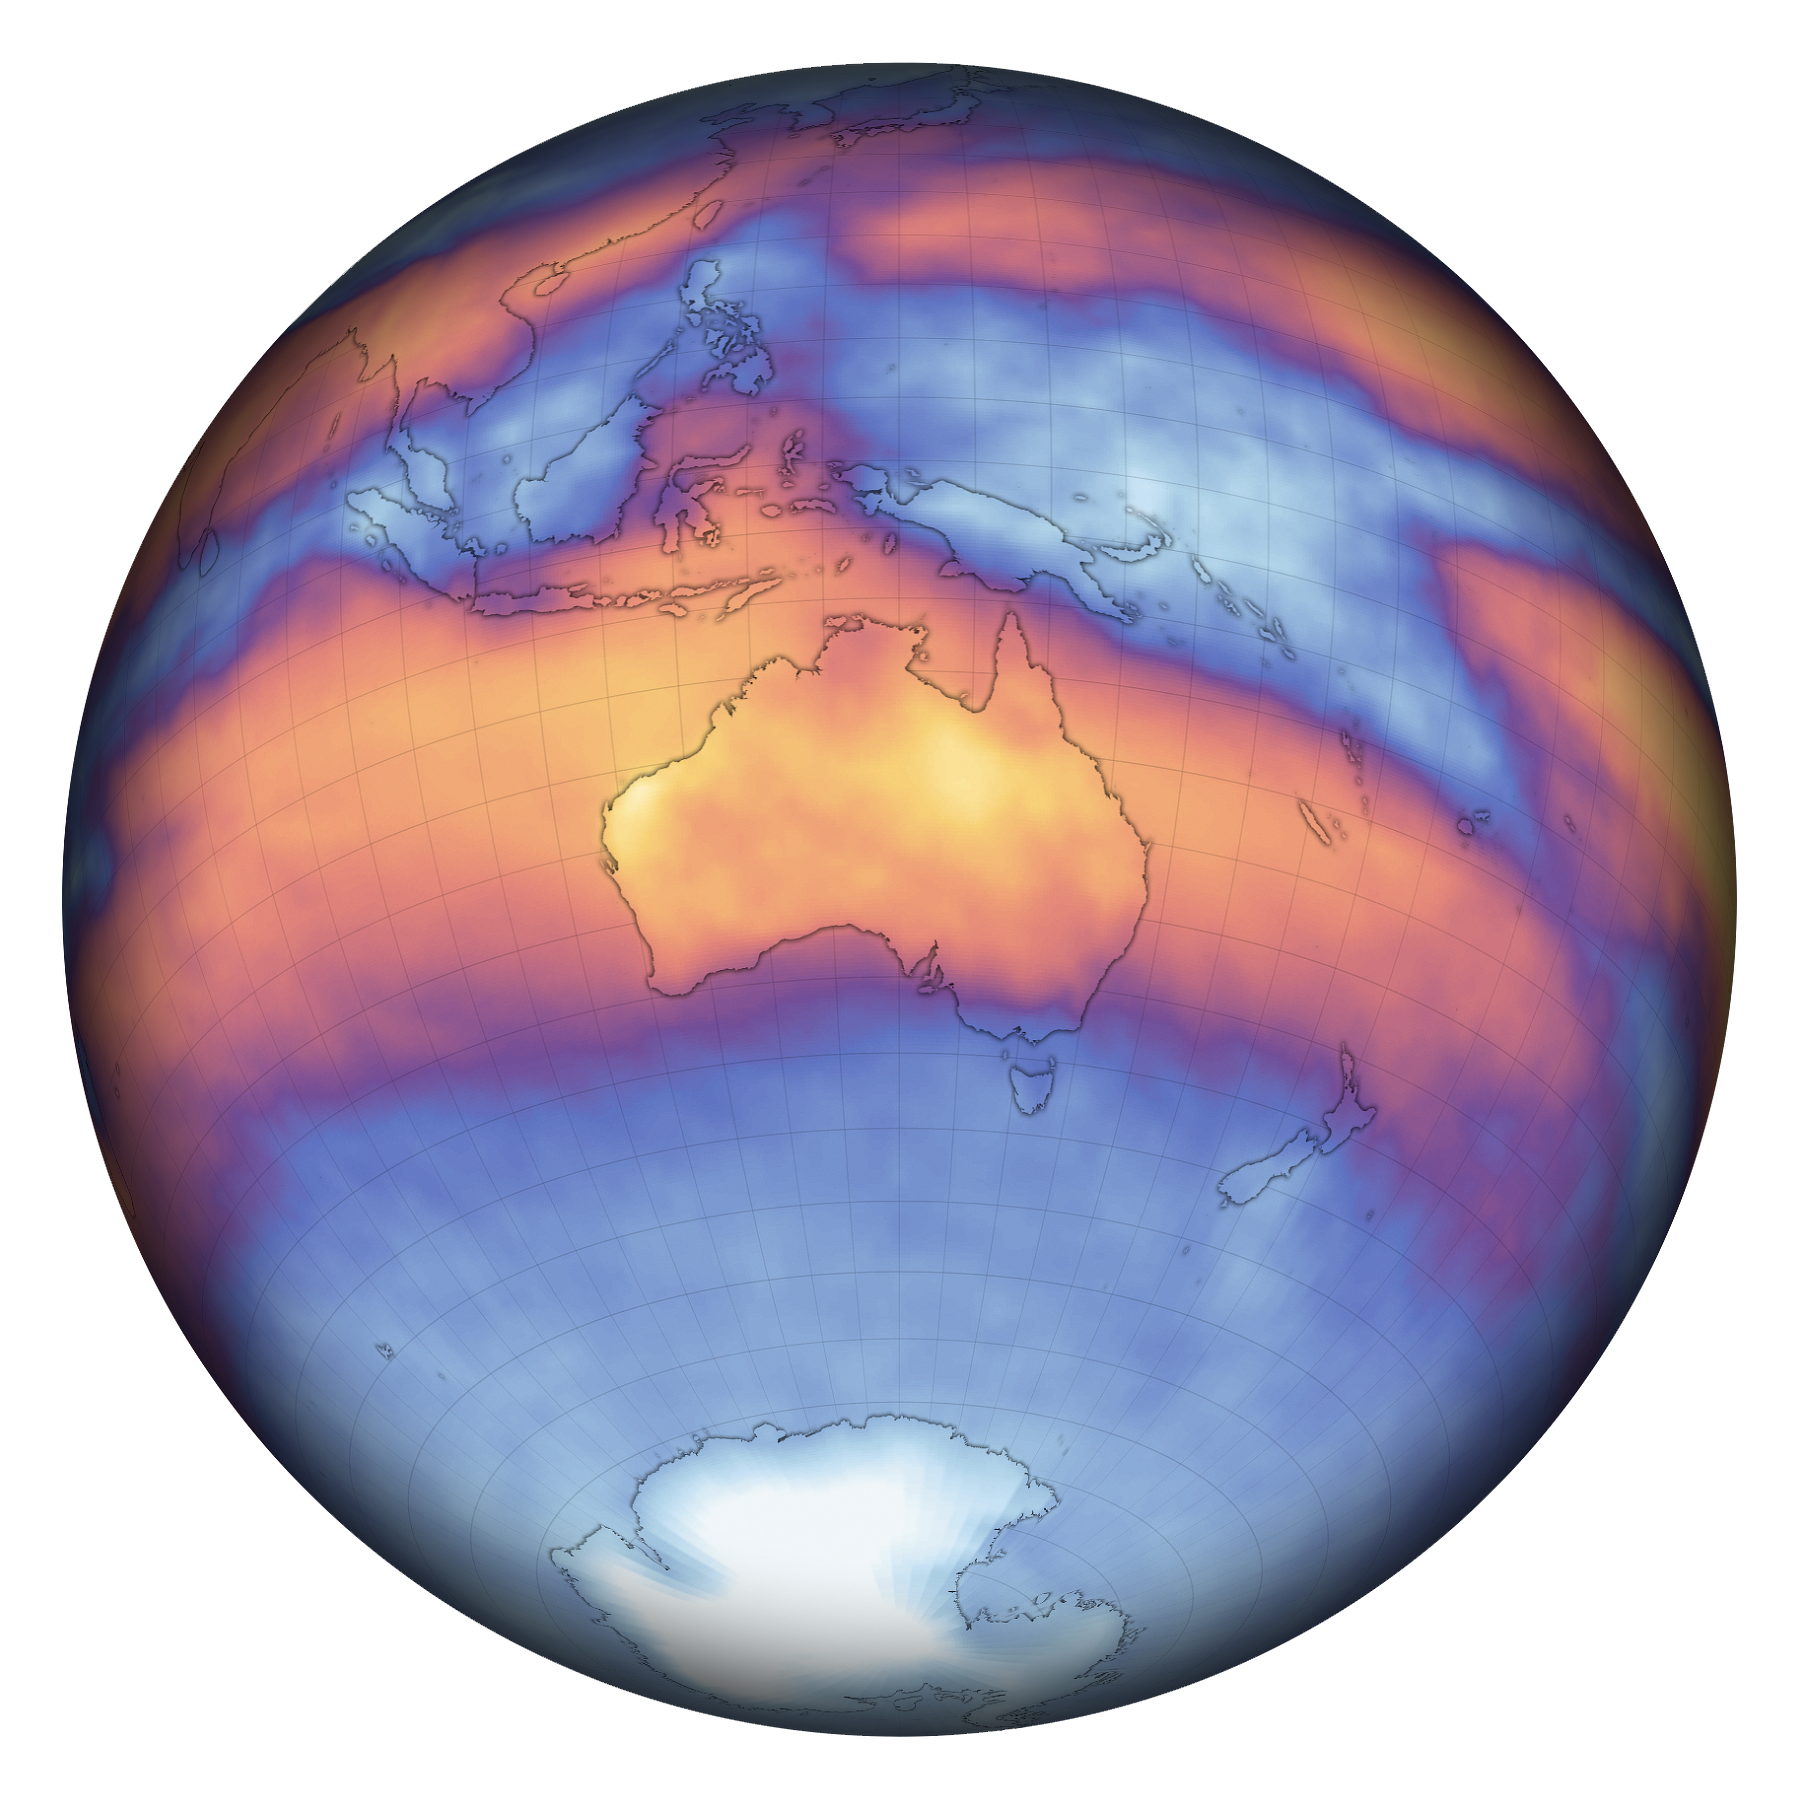
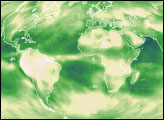
Finally, the Clouds and the Earth’s Radiant Energy System (CERES) sensor observes solar radiation entering Earth’s atmosphere and being absorbed, emitted, and reflected by its surfaces. The map above depicts CERES measurements of outgoing longwave radiation for the month of November 2019—a measure of the heat being emitted back into space. The arid lands of Australia normally emit a lot of heat. In this case, the data offer signs of the unusually hot and dry conditions on the continent that have helped fuel the dangerous fire season.
Two decades after its launch, Terra has flown a distance equal to a trip to the planet Neptune. Along the way, it has collected some of the longest data records of different characteristics of our planet. The satellite is healthy and should continue to serve as a key tool for NASA’s studies of Earth.
NASA Earth Observatory images by Joshua Stevens and Lauren Dauphin, using data from Michael Abrams, NASA/JPL, NASA/METI/AIST/Japan Space Systems, and U.S./Japan ASTER Science Team, MISR data courtesy of David Diner/NASA/JPL/Caltech, CERES data from NASA Earth Observations (NEO), MOPPIT data courtesy of Helen Worden/National Center for Atmospheric Research, and MODIS data from NASA EOSDIS/LANCE and GIBS/Worldview. Story by Michael Carlowicz.