If you have ever inhaled hazy, acrid air on a “code purple” or “code red” air quality day, you may have wondered what triggered the public health warning. Often the culprit is fine particulate matter (PM2.5), a harmful mixture of airborne particles with diameters smaller than 2.5 micrometers, or 30 times thinner than a human hair.
Some of the most abundant PM2.5 particles—ammonium sulfate and ammonium nitrate—have ammonia (NH3) as a key ingredient. A colorless gas with a pungent smell, ammonia reacts with other common substances in the atmosphere (sulfuric acid and nitric acid) to form these two classes of particles. In some cases, ammonium sulfates and ammonium nitrates make up as much as 80 percent of the particles in PM2.5.
Ammonia has a long history on Earth. In fact, scientists think it was one of the key gases present when life emerged some four billion years ago. These days, it is a common ingredient in cleaning products, fertilizers, and refrigerants.
The gas has some natural sources; it leaks into the atmosphere when bacteria break down organic matter and when fires burn. However, most ammonia in the atmosphere got there because of human activity, most notably food production. In the United States and Europe, about 80 percent of ammonia emissions come from agriculture. Concentrated livestock operations are a particularly potent source of the gas because it seeps from animal wastes. Large farms that use ammonia-based fertilizers to grow grains or other crops are another major source of emissions.
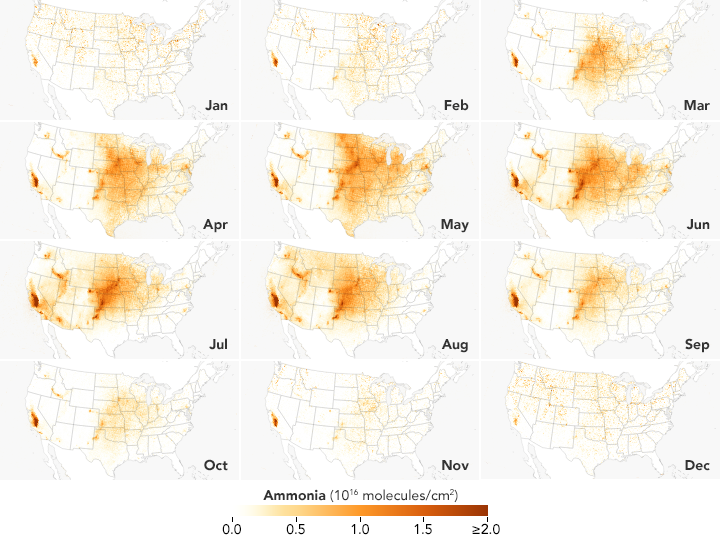
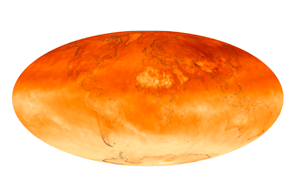
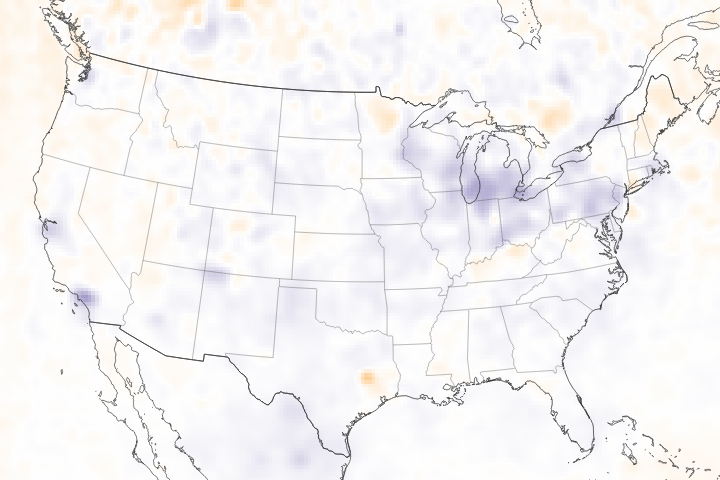
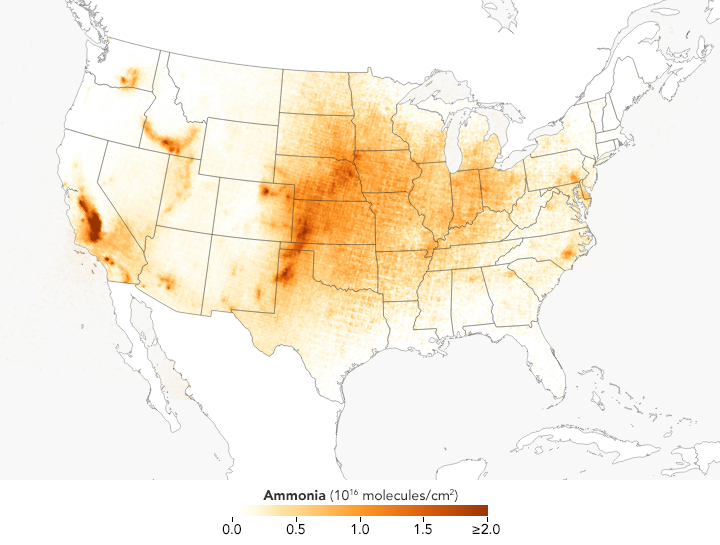
These satellite-based maps of atmospheric ammonia concentrations mostly reflect different source and timing of agricultural emissions. Ammonia concentrations are low in the winter, but they rise rapidly and peak in the spring in parts of the Midwest, Great Plains, and West as farmers sow crops. In areas with many animal feeding operations, concentrations peak in the summer because the gas becomes more volatile as the temperature rises. The San Joaquin Valley in California stands out as one of the most concentrated and persistent ammonia hotspots in the United States. Intensive agricultural activity there is the main source of the ammonia, but the geography of the long, narrow valley exacerbates the problem by making it difficult for winds to clear pollutants away.
These maps are based on data collected by the Infrared Atmospheric Sounding Interferometer (IASI) on the European Space Agency’s MetOp satellites. Ammonia is known among atmospheric scientists for being extremely difficult to sample with sensors on the ground or from airplanes because of how short-lived it tends to be (usually persisting for just a few hours). Over the past decade, satellite sensors such as IASI, the Cross-track Infrared Sounder (CrIS) on Suomi NPP, the Tropospheric Emission Spectrometer (TES) on Aura, and Atmospheric Infrared Sounder (AIRS) on Aqua have begun to offer scientists a space-based perspective on ammonia.
“In comparison to other precursor pollutants that contribute to PM2.5—like nitrogen oxides (NOx) and sulfur oxides (SOx)—ammonia is something of a black box. It is poorly understood, monitored, and not regulated in the United States,” said Mark Zondlo, an environmental engineer at Princeton University. “The satellite perspective will help us get a better handle on this important pollutant, particularly its high temporal and spatial variability throughout the growing season. We are essentially watching agriculture ‘breathe’ into the atmosphere.”
Zondlo is leading a project through NASA’s Health and Air Quality Applied Sciences Team (HAQAST) that links satellite observations of ammonia with ground-based measurements and examines how satellite measurements can constrain emission inventories. As part of that, Zondlo and Rui Wang, also of Princeton, make monthly maps available to local and state air quality managers to help them establish better ground-based monitoring networks and to better predict PM2.5 and haze formation in their regions.
NASA Earth Observatory images by Joshua Stevens, using MetOp data courtesy of Mark Zondlo and Rui Wang, Princeton University. The research team partnered with Kang Sun (University at Buffalo) on the high resolution sampling algorithm, the IASI and CrIS ammonia teams on satellite validations, and Fabien Paulot (NOAA Geophysical Fluid Dynamics Laboratory) on emission inventories. Story by Adam Voiland.