As Rebecca Trinh cruised around Santa Monica Bay, just a mile offshore from Los Angeles, the smell of chlorine and sewage flooded her nostrils. Seagulls fed on debris in the ocean, while a plume of wastewater bubbled to the surface. Most people would turn and cruise away from the scene, but the stench was precisely what brought the microbial oceanographer here.
Trinh and a team from NASA’s Jet Propulsion Laboratory were part of an effort to help LA Sanitation monitor water quality during maintenance of the city’s oldest and largest wastewater treatment plant. The Hyperion Water Reclamation Plant serves around 4 million people, treating wastewater from sinks, showers, toilets, and surface runoff from storm drains. From September 21 to November 2, 2015, plant operators had to shut down Hyperion’s main discharge pipe in order to make repairs to the internal structure.
The main outflow pipe normally transports wastewater five miles offshore, a distance where the seawater is deep enough so that waste (effluent) can be naturally diluted before reaching the surface—“The solution to pollution is dilution,” Trinh noted. During the repair, plant operators were forced to use their one-mile backup discharge pipe, which releases effluent much closer to the shore. Researchers like Trinh worked to observe and learn from the event. They published their findings in the scientific journal Frontiers, which received primary support from the NASA DEVELOP program.
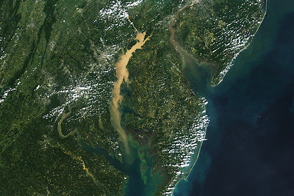
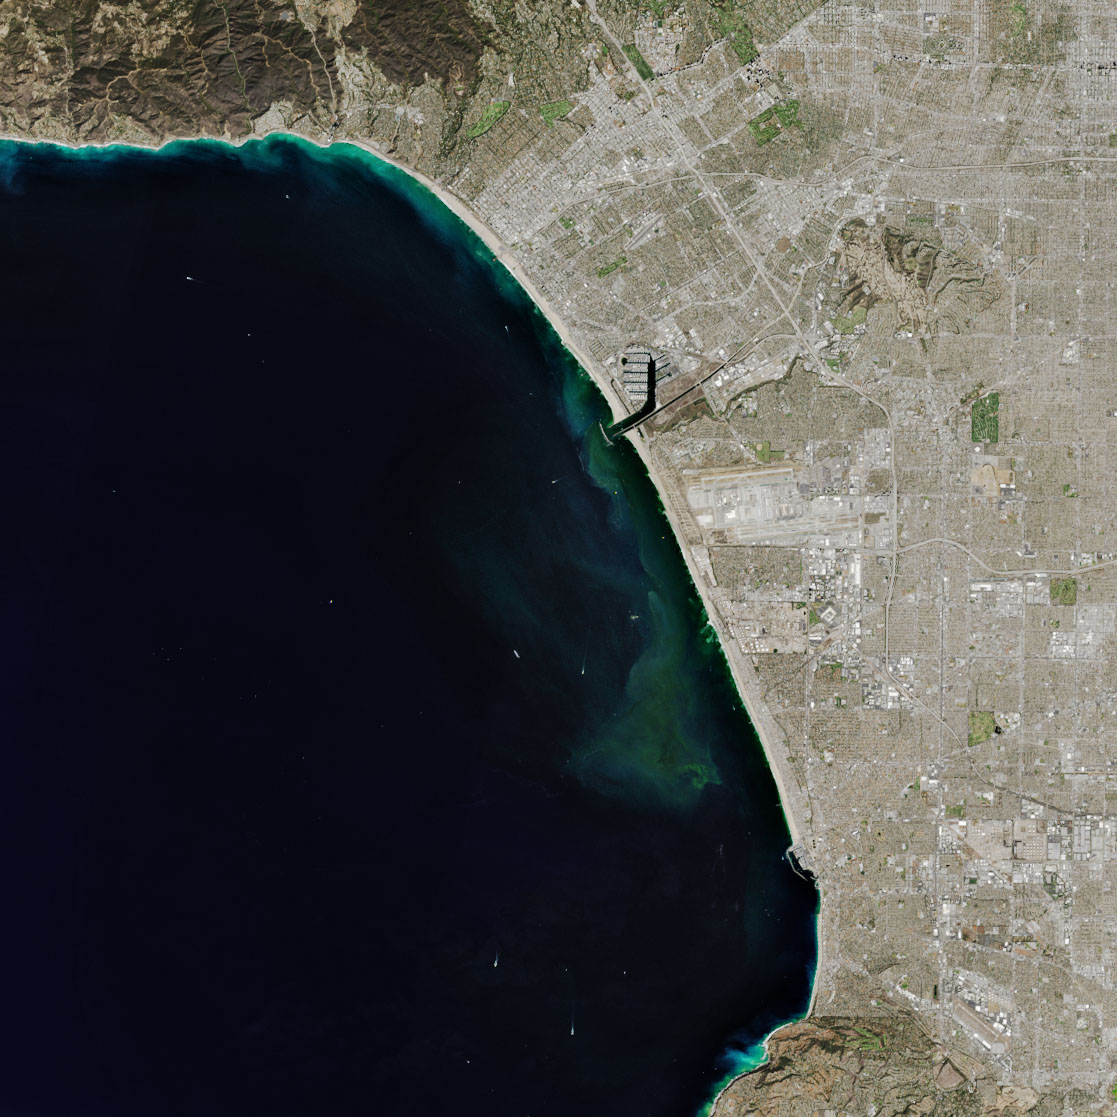
The Operational Land Imager (OLI) on Landsat 8 acquired a natural-color image of Santa Monica Bay (above) on October 10, 2015, midway through the shutdown. The green patches near the coast are phytoplankton blooms likely caused by an excess of nutrients from the nearshore wastewater discharge.
“The one-mile pipe is closer to shore and in much shallower water,” said Trinh, “so there were a lot of human health impacts and ecological impacts that people were worried about.” Using satellites, the team was able to monitor the area in near-real-time and provide LA Sanitation with insight on potential biological hazards.
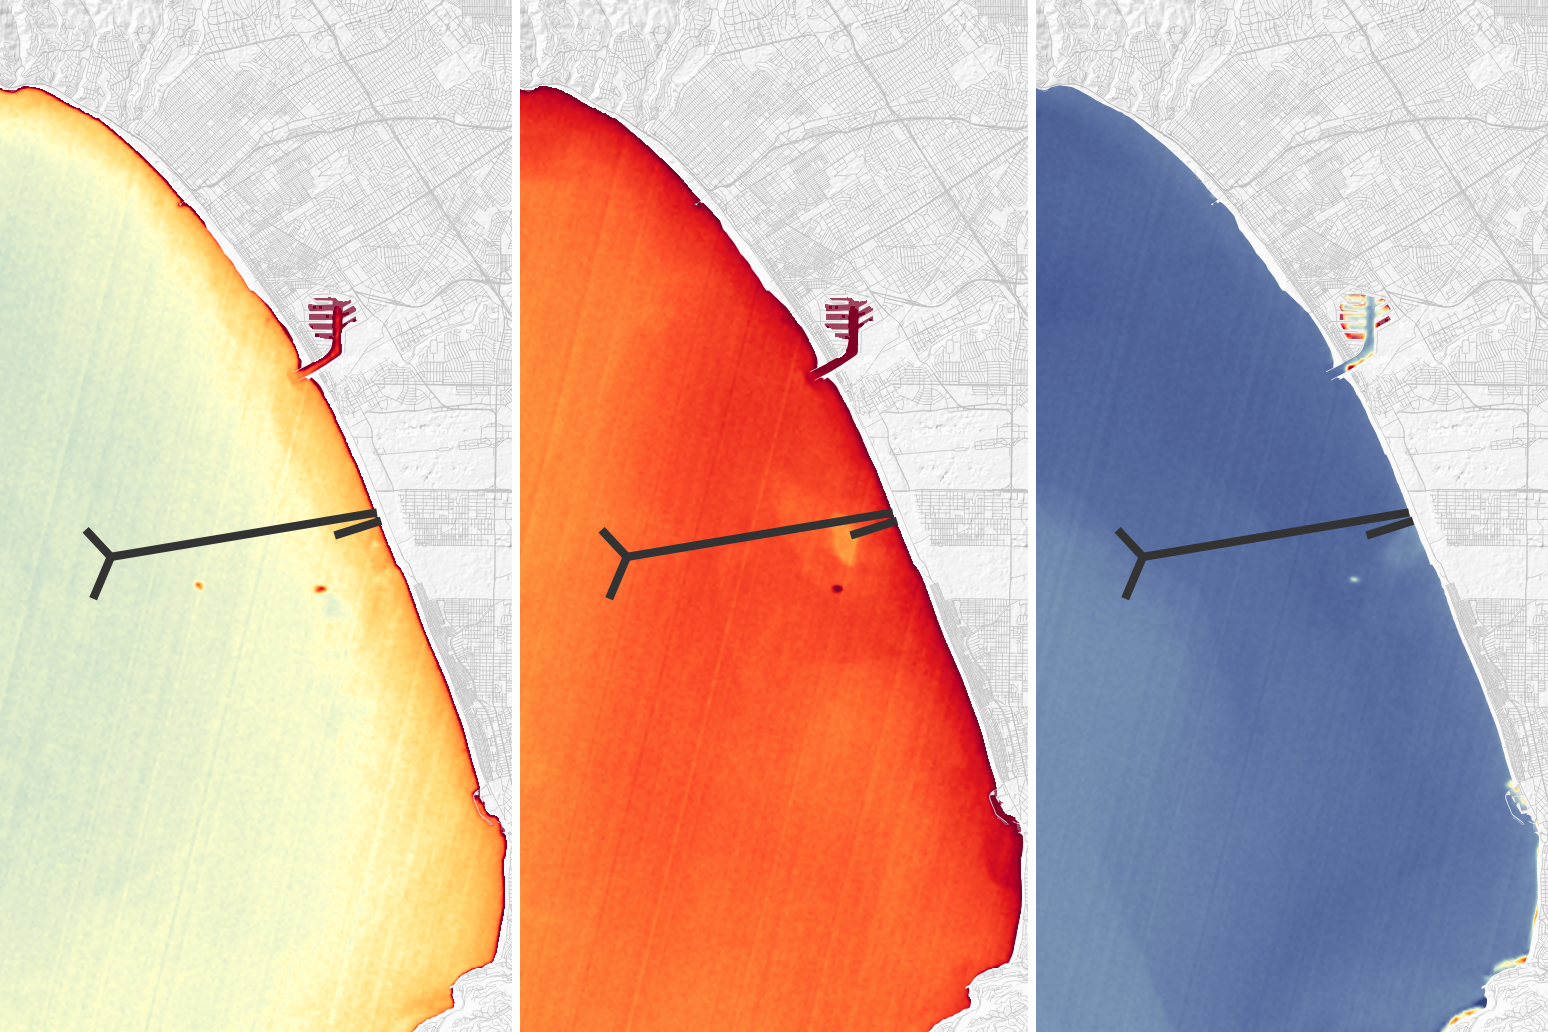
These maps show the sea surface temperature of Santa Monica Bay before, during, and after wastewater was transported through the shorter pipe. The data was acquired by the Thermal Infrared Sensor (TIRS) on the Landsat 8 satellite. During the diversion, a cooler pool of water formed near the mouth of the one-mile pipe, as the plume of wastewater also brought colder water from the depths to the surface.
“We knew that along with the change in temperature, we were going to get all the excess nutrients and the potentially harmful bacteria and chemicals associated with the pipe’s effluent,” said Trinh. Researchers had two main worries about the excess nutrients. First, that they would stimulate toxic phytoplankton blooms. Second, that they could lead to eutrophication—when extreme growth, and subsequent death, of algae, phytoplankton, or other plant life severely depletes the oxygen supply for other marine animals.
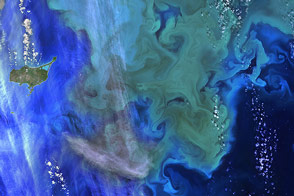
The maps below show chlorophyll-a concentrations—a proxy for the amount of phytoplankton in the water—over the six-week pipe diversion period. Four phytoplankton blooms occurred during the diversion (including the one at the top of this page). Researchers who took water samples identified the phytoplankton as non-toxic euglenoids, a type of green algae.
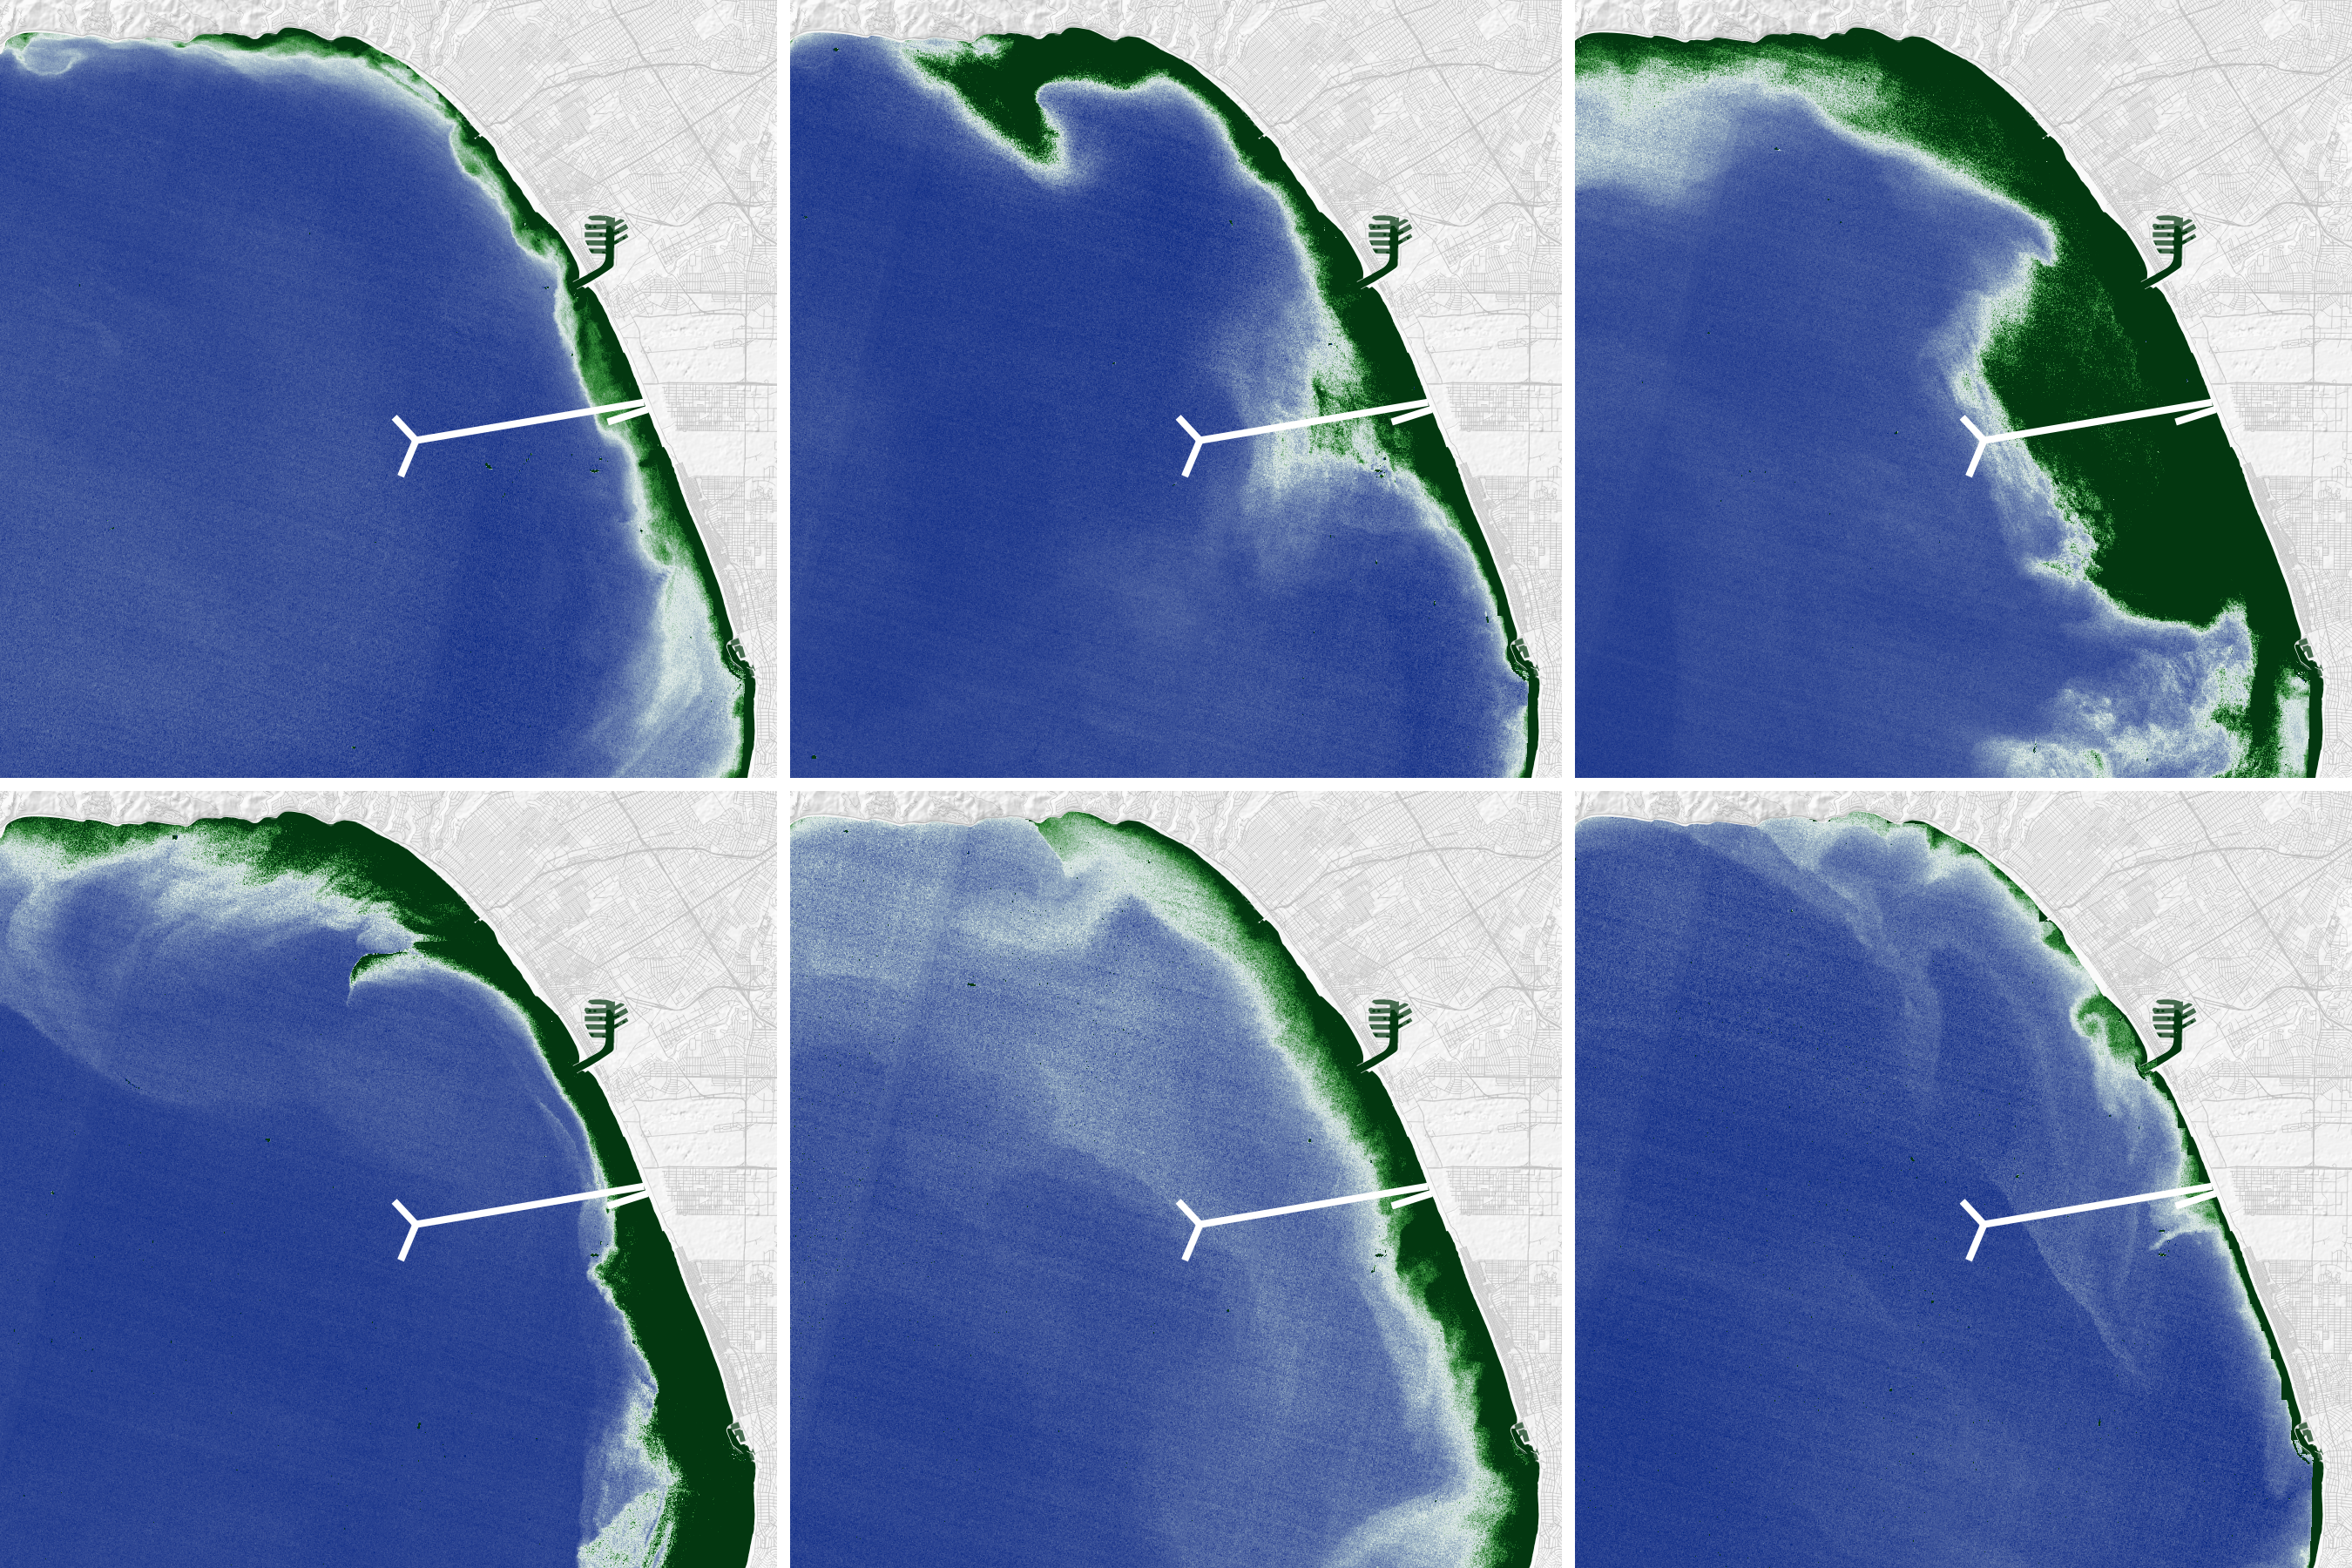
Measuring chlorophyll-a concentrations in coastal environments is challenging. Water temperatures fluctuate quite a bit, waters are often rich with sediment and land runoff, and there is usually a higher concentration of phytoplankton than in offshore waters. Trinh’s team developed a new satellite algorithm to decrease the “signal-to-noise” ratio in tricky coastal waters and to provide more accurate chlorophyll-a measurements. The improved algorithm integrates data collected by Trinh and her team from ship-based instruments with data from Landsat 8.
“The satellite component gave a new perspective on the situation because usually Hyperion just monitors from the ship in a very small area around the pipes,” said Trinh. “We’re showing that these wastewater diversions can have wide spatial impacts, and you wouldn’t know that without something like a satellite data set.”
Trinh and colleagues helped guide LA Sanitation on where to collect water samples to test for harmful bacteria. For instance, satellite data showed higher chlorophyll concentrations along the southern shoreline of Santa Monica Bay, so water quality monitors collected samples from Topanga Canyon to Malaga Cove. In this area, they found that 10 percent of the samples contained fecal bacteria in amounts that exceeded state water quality standards. Multiple beaches were temporarily closed as a result.
Trinh said this study was a good demonstration of how satellites can aid in monitoring water quality, especially in coastal areas with a lot of human activity and near wastewater outflows. “If a plant’s pipes don’t stay functional or have a catastrophic blowout,” she said, “we already know what type of instruments and satellites we can use to make water quality monitoring as efficient as possible.”
NASA Earth Observatory images by Joshua Stevens, using data courtesy of Rebecca Trinh/Columbia University, and Landsat data from the U.S. Geological Survey. Story by Kasha Patel.