July 9, 2020
In January 2016 in Kenya, the conditions were just right for an outbreak of Rift Valley fever. A strong El Niño on the other side of the world had brought higher temperatures and a wetter-than-normal rainy season to eastern Africa. Rain-soaked and flooded areas provided favorable habitat for Aedes mcintoshi mosquitoes—the primary carrier of the fever-causing virus—to gather and reproduce.
As eastern Africans know, a Rift Valley fever outbreak is not something to be taken lightly. The symptoms of the virus are usually flu-like fevers, muscle and joint pain, and headaches. In extreme cases, it can lead to blindness, hemorrhagic fever, or even death.
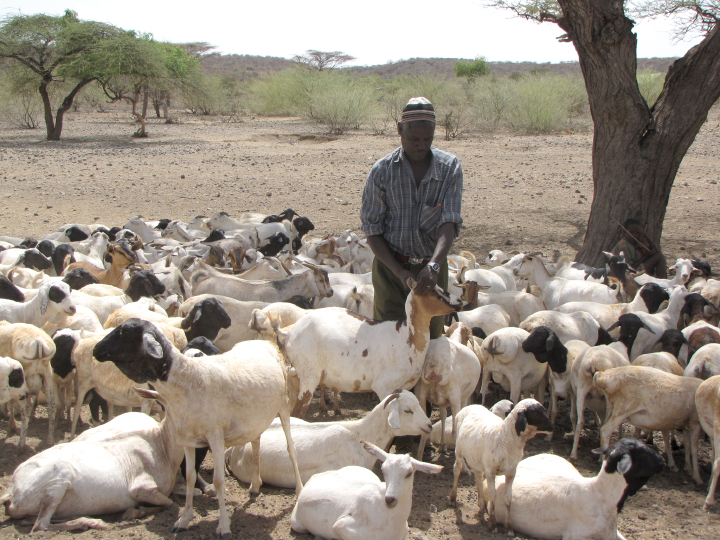
The majority of human cases of Rift Valley fever come from contact with livestock that have been bitten by mosquitoes. Health officials can prevent outbreaks by vaccinating livestock when environmental conditions favor mosquito growth and reproduction. (Photo courtesy of EU/EU Civil Protection and Humanitarian Aid/Eunice Maina CC BY-NC-ND 2.0.)
During an El Niño event in 2006-07, outbreaks occurred across eastern Africa. The regional economy lost about $60 million (U.S.) due to livestock losses and international export bans. The disease was transmitted from livestock to humans through the consumption of milk and undercooked meat. Outbreaks in Kenya, Sudan, Tanzania, Somalia, and Madagascar killed roughly 500 people and resulted in more than 200,000 human infections.
But in 2016, despite prime mosquito breeding conditions, no outbreak of Rift Valley fever occurred in Kenya. Using satellite data, NASA researchers observed the wetter-than-usual conditions and shared their insights about a potential outbreak with colleagues in international health organizations and African governments. While there is no current vaccine for humans, there is a vaccine for livestock. In response to the alert, Kenyan officials undertook a mass vaccination program for domestic livestock. Despite large numbers of disease-carrying mosquitoes in Kenya, no human or animal outbreaks were reported. Meanwhile, Rift Valley fever outbreaks occurred in Mauritania, Niger, and Uganda.
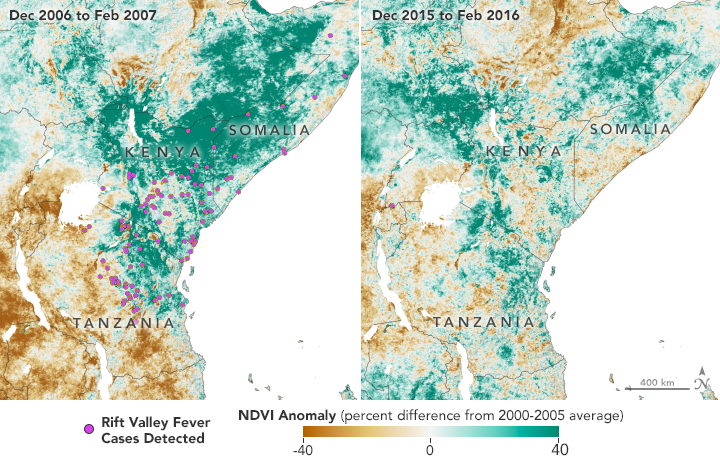
The Normalized Difference Vegetation Index (NDVI) is a satellite measurement of the “greeness” of vegetation; NDVI anomalies reveal how much healthier (greener) vegetation is than normal. Greener areas are usually wetter, suggesting better habitat for mosquitoes. Favorable conditions for mosquitoes in 2006 led to Rift Valley fever (RVF) outbreaks in eastern Africa. The region greened again in 2015, but early warnings helped officials prevent the spread of RVF. (NASA Earth Observatory maps by Lauren Dauphin, using NDVI anomaly data from Terra MODIS.)
The prevention of Rift Valley fever in Kenya in 2016 was a success story decades in the making. Twenty years ago, predicting a disease outbreak seemed like the realm of science fiction. But today, researchers can predict when and where certain diseases will spread—from weeks to months beforehand—with the help of satellite data.
“You have to determine where there are disease-favoring conditions in the environment, and you can only determine that by a global surveillance system, which satellites provide,” said Assaf Anyamba, a remote sensing scientist with the NASA Goddard Earth Sciences & Technology Center and leader of the Rift Valley fever monitoring project.
Anyamba’s team is one of several research groups worldwide that are developing predictive outbreak models for some of the world’s most common and neglected (under-studied) diseases—many of which do not have a vaccine. Rift Valley fever, cholera, chikungunya, and dengue are generally found in tropical regions around the world with poor water quality and sanitation, as well as limited access to health care services. Each disease is also connected to the environment.
As ever-more advanced satellites have been launched, disease researchers have acquired better tools to observe the temperature, precipitation, and vegetation conditions that are linked with certain diseases. Scientists have incorporated these data into models that assess the likelihood of disease outbreaks. By anticipating when and where conditions for these diseases might become favorable, researchers can help local governments and international health organizations focus their resources to mitigate outbreaks.
Between 2004 and 2006, islands in the western Indian Ocean experienced an unprecedented outbreak of chikungunya. At least 200,000 people on the island of La Reunion were struck by the disease. This outbreak was preceded by unusually dry and warm weather.
In October 2016, a large outbreak of cholera cases occurred in Haiti following Hurricane Matthew. The category 4 storm caused extensive flooding, damaged infrastructure, and brought a noticeable surge of cholera cases immediately following the destruction.
In 2016, the Zika virus became a pandemic, spreading to more than thirty countries and territories in the Americas, including the United States. The majority of U.S. cases were traced back to travelers who had been to South America, where the virus-carrying mosquitoes thrived after a season of heavy rain and warm temperatures.
There is rarely a simple answer for why a disease outbreak occurs. Usually it is a combination of factors, including the presence of vectors, weather and climate changes, local sanitation practices, lack of immunity in the population, and unpredictable human behavior.
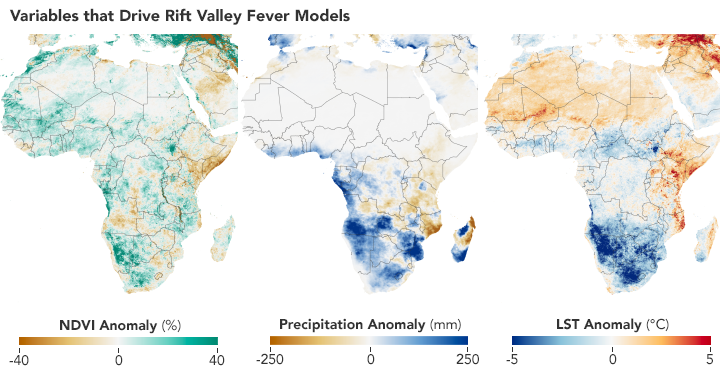
Scientists use satellites to track vegetation health, rainfall, and temperatures in order to predict where Aedes mosquitoes may breed and spread the Rift Valley fever virus. These maps show conditions in Africa from December 2010 to February 2011 compared to the long-term average. (NASA Earth Observatory maps by Lauren Dauphin using NDVI and land surface temperature data from Terra MODIS and precipitation data from CHIRPS.)
“Disease risk models involve a mixture of understanding of the biology of the organism that spreads the disease and of climate dynamics, plus the numerical tools to be able to put it all together,” said Anyamba, who works with disease experts, biologists, and health officials across organizations and government agencies.
NASA satellites provide one of those model inputs: data on weather and climate that scientists can use to monitor the conditions that precede an outbreak. But how do researchers know which environmental conditions will play a significant part? To answer that question, researchers study past outbreaks.
Long before he made a prediction about the 2016 outbreak, Anyamba studied Rift Valley fever outbreaks dating back to the 1950s in collaboration with entomologist Kenneth Linthicum of the U.S. Agricultural Research Service. Out of roughly a dozen outbreaks across seven decades, they found that all followed periods of heavy rain that were typically brought on by El Niño events or La Niña events. (El Niño brings RVF outbreaks to eastern Africa; La Niña makes them more likely in southern Africa.)
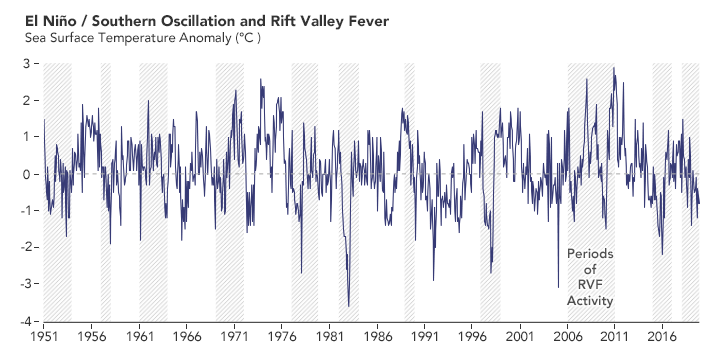
In the past 70 years, outbreaks of Rift Valley fever (RVF) in Africa usually occurred around the time of El Niño and La Niña events on the other side of the world. The peaks of the graph show El Niño events, which bring more rain and RVF to eastern Africa. The lows on the graph show La Niña events, when rain and RVF are more likely in southern Africa. (NASA Earth Observatory chart by Lauren Dauphin, based on data from Assaf Anyamba, NASA GSFC.)
Heavy rain is favorable for the growth and breeding of specific Aedes and Culex mosquitoes that can carry the virus. The female mosquitoes can transmit the virus to their offspring through eggs, which can remain dormant and infectious during dry conditions for many years. Heavy rain allows more of those eggs to hatch.
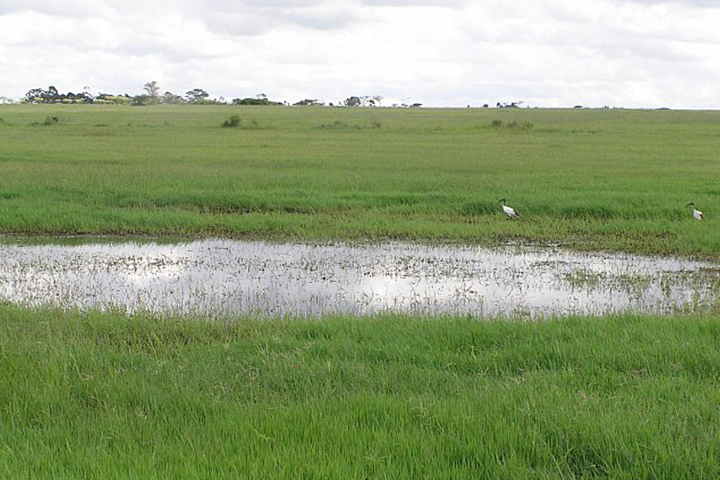
Aedes mosquitoes are often found near dambos—natural, shallow depressions that become flooded during periods of abundant rainfall. Such habitats are common in eastern and southern Africa and are good breeding grounds for mosquitoes. (Photo courtesy of Assaf Anyamba, NASA GSFC.)
In fact, many tropical diseases are transmitted by such “vectors”—organisms that do not cause the disease, but spread it to other animals. Chikungunya, dengue fever, and Zika are transmitted through viruses carried predominantly by Aedes aegypti mosquitoes. Cholera is often carried and spread by small crustaceans called copepods. Malaria is spread through the bite of female Anopheles mosquitoes infected with the Plasmodium parasite. Plague is transmitted through fleas—usually living on rodents—that carry the bacteria.
Although satellites cannot track these tiny vectors, they can monitor the environmental conditions that allow the vectors to thrive.
In 2011, hydrologist Antar Jutla began a quest to understand why cholera outbreaks occur. Cholera is a waterborne bacterial infection that can spread quickly through a population. The disease is primarily contracted by consuming water or food contaminated with the cholera bacteria, Vibrio cholerae. It causes uncontrollable diarrhea that, if left untreated, can result in dehydration or death.
In the 1960s, University of Maryland biologist Rita Colwell made the discovery that Vibrio cholerae can live in the guts of microscopic aquatic animals called copepods. Further investigations showed that disease-carrying copepods could lurk in the coastal ocean for months to years. Other research showed that when the right environmental conditions arise, Vibrio cholerae can show up in water supplies and spread disease to people. But at the time researchers did not know which environmental factors brought the bacteria-carrying copepods into water supplies.
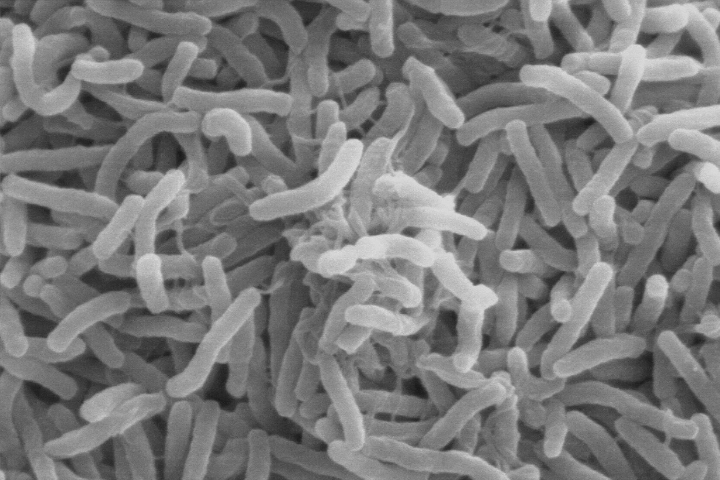
Vibrio cholerae—the bacteria that cause cholera—can live in the guts of microscopic aquatic animals and can lurk in the ocean for months to years. When the right environmental conditions arise, the bacteria can infiltrate water supplies and spread disease to people. (Scanning electron microscope image courtesy of Kirn et al., Dartmouth Medical School, via Wikimedia Commons.)
As a postdoctoral researcher at the National Oceanic and Atmospheric Administration (NOAA), Jutla worked with Colwell to analyze nearly three decades of cholera outbreak data from India and Bangladesh. They combined long-term health data with satellite and ground-based data of air temperatures, ocean temperatures, salinity, and precipitation. The team also used a ten-year dataset from NASA’s Sea-Viewing Wide Field-of-View Sensor (SeaWiFS) to map and analyze chlorophyll concentrations in nearby waters since plant-like phytoplankton are the primary food source for copepods. Then they ran a computer model that integrated the satellite observations with local information on sanitation, clean-water infrastructure, and populations to retrospectively predict the cholera outbreaks.
The team found that cholera outbreaks took two different forms: endemic and epidemic. Endemic disease means there is a cyclical or seasonal recurrence because the bacteria is constantly present in the environment, even if at a low level. The endemic form of cholera occurs during the dry season, when freshwater river levels are low and saltwater can more easily penetrate into coastal areas. The extra salt provides a good habitat for the growth of algae, which draws in copepods that feed on the floating vegetation. This brings copepods closer to sources of water used for drinking, sanitation, and bathing.
The second form—the epidemic mode—occurs suddenly and sporadically. These outbreaks typically occur after a disaster (such as flooding) contaminates clean water sources or damages water infrastructure. They also alter normal human behavior; for instance, causing populations to relocate suddenly. These damages and disruptions often increase the chance that the infectious bacteria will enter and contaminate local water sources. Epidemic episodes tend to result in more deaths than endemic episodes because the population is often not prepared for the sudden outbreak, which subsequently leads to massive infection rates.
“Bangladesh was a testing ground for our model, the place where we proved we could forecast cholera outbreaks,” said Jutla, who is funded by the NASA Applied Sciences Program and now works on his disease models from the University of Florida. In a proof-of-concept study published in 2013, Jutla and colleagues showed that they could predict both types of outbreaks months in advance for the Bengal Delta. The information was shared with the International Center for Diarrheal Disease Research, which was interested in forecasting the risk of cholera for health professionals in Bangladesh.
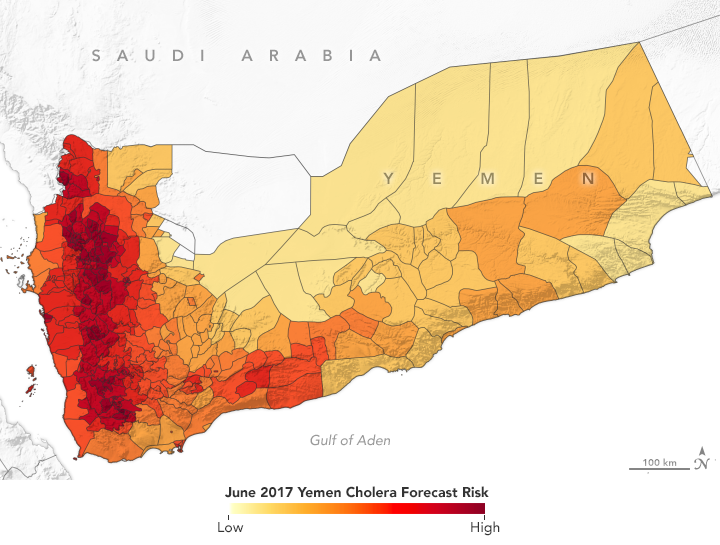
In spring 2017, NASA-funded researchers predicted a cholera outbreak for Yemen. That June, the country had its worst outbreak in decades. (NASA Earth Observatory map by Lauren Dauphin using data from Antar Jutla and Moiz Usmani, University of Florida.)
The Cholera Prediction Modeling System had a crucial first real-world test in 2017 when the team successfully applied it in another region. Observing heavy rain and warm temperatures, the team predicted that a cholera outbreak could occur in Yemen that summer. However, the team had concerns about the accuracy of their model because they could not get reliable health data from the war-torn country. They made their prediction privately, but were not able to share it with Yemeni officials.
Yemen proceeded to have a devastating cholera outbreak that June—one of its worst in decades—following a mass movement of the population due to civil unrest and heavy flooding. Over four months, more than one million people in Yemen were suspected of having cholera and at least 2,000 died.
Jutla’s model achieved 92 percent accuracy in predicting areas where cholera appeared in Yemen that year. It even identified outbreaks in inland areas that are not usually susceptible to the disease. Following that successful prediction, Jutla and colleagues partnered with UNICEF and the UK Department for International Development to share weekly reports on potential outbreaks in Yemen in order to guide the delivery of prevention and relief resources.
“This 2017 outbreak was a rare occurrence in Yemen, but the model was able to forecast it,” said John Haynes, a program manager in NASA’s Earth Applied Sciences Program. “It was a really big breakthrough to learn that the model could be moved to different parts of the world and still work well.”
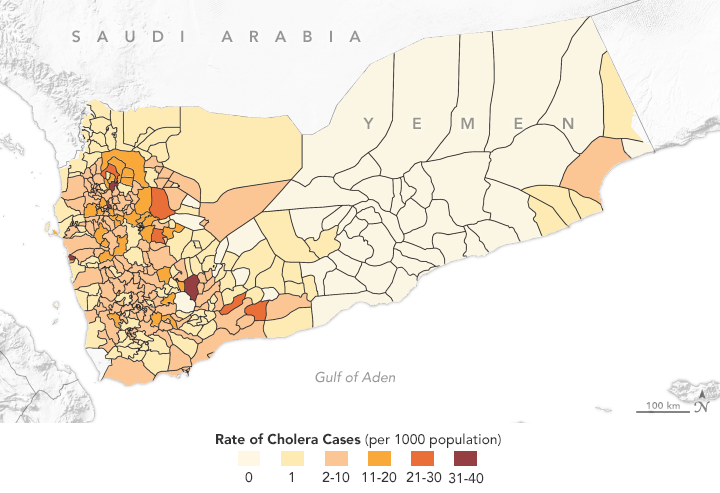
This map shows the distribution of cholera cases in 2017 in Yemen, as reported by the World Health Organization. Antar Jutla’s model achieved 92 percent accuracy in forecasting areas where cholera appeared that year. (NASA Earth Observatory map by Lauren Dauphin using data from Antar Jutla and Moiz Usmani, University of Florida.)
The team has since run its cholera prediction model in other parts of the world. For instance, when Cyclone Idai hit Mozambique in March 2019, Jutla’s group was able to predict cholera outbreaks four weeks in advance for various cities. The team has also tested its model in Zimbabwe, Algeria, and Sudan, with plans to cover more of Africa since it is the site of two-thirds of all cholera outbreaks in the world. Jutla and Colwell have a vision to develop a global cholera prediction model in order to reduce the number of cases worldwide.
In 1952, a new and unusual virus was reported in southern Tanzania on the Makonde Plateau. The viral illness caused sudden fever, rash, and joint pain that could last for months. Sometimes causing victims to hunch over due to the aches, the virus was called chikungunya—meaning “bent over in pain” in the local Makonde language. The virus is rarely fatal, but symptoms can last for a few days. It has no vaccine or antiviral treatment.
For the next 50 years, though, chikungunya was largely dormant, with only a few small outbreaks and sporadic cases. But then it made a large-scale resurgence in 2004-2006. At first, it appeared along the Kenyan coast in 2004 in Lamu and then Mombasa. During 2005-2006, the virus spread to hundreds of thousands of people living on western Indian Ocean islands and in India.
As the chikungunya outbreaks were occurring, Anyamba was in the middle of his Rift Valley fever research. But something piqued his interest. Unlike Rift Valley fever, which occurs after heavy rainfall, chikungunya outbreaks were happening during drought conditions.
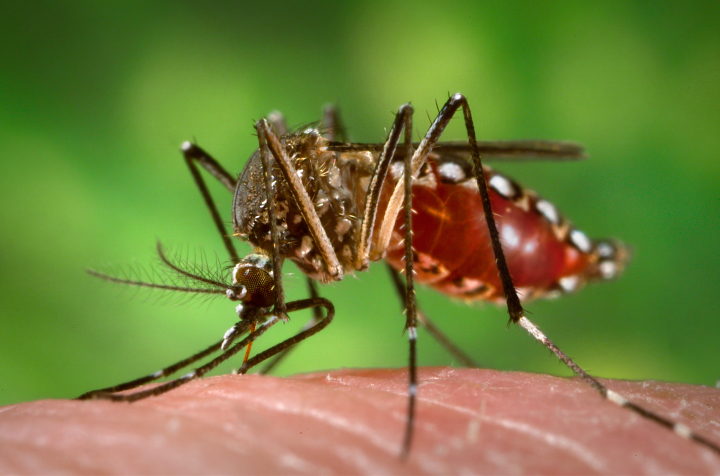
Aedes aegypti mosquitoes carry several tropical diseases, including chikungunya, dengue, Zika, and yellow fever. They are recognized by white markings on their legs. (Image courtesy of CDC/James Gathany.)
“Many people think you get rain, then mosquitoes come, and then disease occurs,” he said. “But these large-scale outbreaks illustrated the role of extreme temperatures in influencing these particular vectors.”
Chikungunya is transmitted through the bite of infected Aedes aegypti and Aedes albopictus mosquitoes. The insects gravitate to areas where there is open water for laying their eggs. During a drought, they will leave dry rural areas and move towards urban areas, where open water can be found in water storage containers, flower pots, or small puddles. High temperatures also agitate the insects and cause them to bite more, increasing transmission of the disease.
“During extreme high temperature and drought conditions, you basically change the configuration of habitats for these mosquitoes,” said Anyamba.
Anyamba has since studied various chikungunya outbreaks alongside his Rift Valley fever research. In a span of a decade, chikungunya spread from Asia and Africa to Europe and, most recently, the Americas. In 2015, chikungunya became national news with almost 900 reported cases in the U.S.
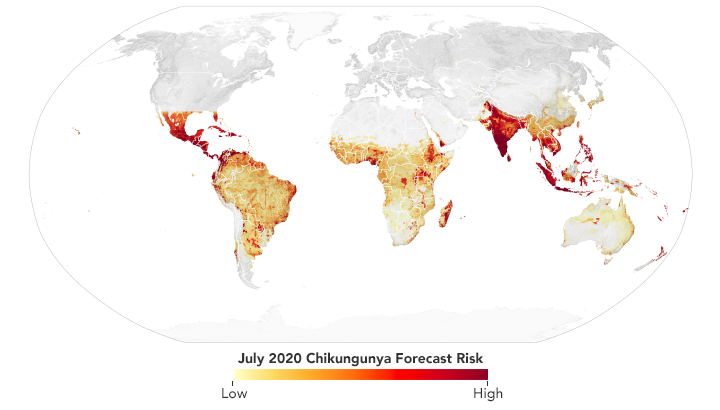
Scientists use data from satellites and ground stations to predict the spread of chikungunya in a new project called CHIKRisk. The model forecasted an elevated risk of chikungunya for July 2020 in India, Mexico, Indonesia, Malaysia, and Philippines. (NASA Earth Observatory map by Lauren Dauphin using data from Assaf Anyamba, NASA GSFC.)
Since 2016, Anyamba and his team have been working on a chikungunya risk mapping and forecasting system called CHIKRisk. The model incorporates air temperature and rainfall data from NOAA models; land surface temperatures from NASA’s Moderate Resolution Imaging Spectroradiometer (MODIS) instruments; humidity and soil moisture data from NASA’s Global Land Data Assimilation System; human population density data from NASA’s Socioeconomic Data and Applications Center; and chikungunya vector distributions from the Walter Reed Biosystematics Unit’s VectorMap. The model is correlated with ground-based surveillance systems (such as the Program for Monitoring Emerging Diseases, or ProMED) that identify disease activity. The project is partly supported by the U.S. Defense Threat Reduction Agency and the NOAA Climate Program Office.
The CHIKRisk model provides monthly outlooks of where chikungunya risk is highest around the world. That information is used by the U.S. Department of Defense’s Global Emerging Infections Surveillance (GEIS) system for situational awareness and health protection for soldiers stationed overseas and by the Pan American Health Organization (PAHO) to help control cases in high-risk areas.
Aedes aegypti and Aedes albopictus mosquitoes are notable vectors in the disease world because of their diversity and ubiquity. Not only do they carry chikungunya, but they also carry dengue fever and Zika. From a modeling perspective, the prediction parameters should be similar for all three diseases. Theoretically, forecast maps could cover multiple diseases for a single location if they have similar environmental influences or common vectors.
Workers spray pesticides at a field site in Marigat, Kenya, in order to control mosquitoes. In a future with more rainfall, rising temperatures, and more intense heatwaves, preventing the spread of disease-carrying vectors becomes more challenging. (Video courtesy of Assaf Anyamba, NASA GSFC.)
During the Zika epidemic of 2015-2016, researchers were able to use what they knew about the mosquitoes to create a predictive model. “We knew a lot about the ecology of Zika because we already knew about its vector,” said Janey Messina, a researcher from the University of Oxford. “To understand the Zika outbreak, we compared it to past dengue outbreaks in Africa by looking at common covariates.”
“When people go into hospitals, their symptoms may be related to many diseases. Until they perform the right test on you, they cannot confirm the disease,” said Anyamba. “Our hope is to make disease forecast maps that could tell public health practitioners that they should be looking for chikungunya, dengue, and Zika.”
Over the years of disease forecasting research, one theme persists: researchers are seeing new diseases in new places. As global climate changes, some diseases are popping up more often, some are spreading faster, and some are occurring under unusual circumstances. In just the past decade, cholera resurfaced in Yemen, West Nile Virus reemerged in the U.S., Zika became a pandemic, dengue fever was reported for the first time in France, and countless other diseases made unlikely appearances.
These increased incidences are not necessarily surprising. The Fifth Intergovernmental Panel on Climate Change (IPCC) report predicted more rainfall, stronger hurricanes, rising temperatures, and more intense heat waves worldwide—all of which could create more favorable habitats for disease vectors.
“The climate has already changed a lot since the 1940s, when a lot of these arboviruses (carried by mosquitoes and ticks) were introduced,” said Messina. “Climate change is going to affect disease transmission, and that’s where preparedness is going to make a difference.”
The most rapidly spreading mosquito-borne disease is dengue fever, which increased thirty-fold in global incidence over the past 50 years. In the past two decades, climate conditions have become more suitable for the mosquitoes in some regions. For instance, the World Health Organization reported that Europe is now vulnerable to a possible outbreak.
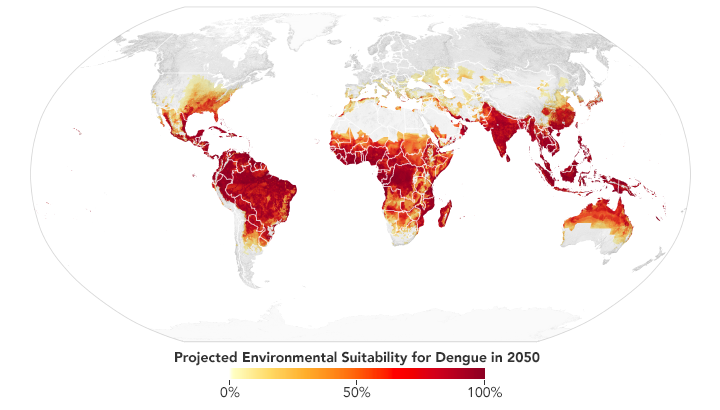
Based on projections of future temperatures, rainfall, and mosquito populations, researchers predict that much of the southeastern U.S., central Mexico, southern Africa, the Sahel, and coastal China and Japan may become environmentally favorable locations for dengue fever by 2050. (NASA Earth Observatory map by Lauren Dauphin based on data from Janey Messina, University of Oxford.)
Messina recently led a study of the global distribution and risk of dengue in 2050 and 2080. The team found that much of the southeastern United States should have suitable environmental conditions for dengue by 2050. Out of all the continents, though, Africa is expected to see the largest increase due to increased rainfall and rising temperatures—particularly in southern Africa and the Sahel. Globally, the team predicts two billion more people will be at risk for dengue in 2080 compared to 2015.
“These arboviruses are definitely not going away,” said Messina. “All you can do is reduce the effects of an outbreak and how bad it can get.” The main approaches for mitigation are controlling or eliminating the vectors, practicing preventative behavior (such as staying away from or discarding pools of water), and spreading awareness to the public.
Disease-tracking research is now entering a new era: practical use by international health and relief teams. NASA’s Health and Air Quality Applications Program, which sponsors an array of disease-tracking efforts, currently has the highest number of projects and partnerships in its 20-year history. Partners include the Centers for Disease Control and Prevention (CDC), the U.S. Agency for International Development, UNICEF, PAHO, as well as state and local health departments. The Intergovernmental Group on Earth Observations (GEO) also connects experts in Earth remote sensing with public health managers and non-governmental organizations.
For their part, Jutla and his team use the Cholera Prediction Modeling System to create a report each week showing the risk of cholera in certain countries of interest. They send their assessment to more than a hundred colleagues in the public health and remote sensing sectors for their situational awareness and potential action. For instance, Jutla ran the model in May 2020 when Cyclone Amphan slammed into eastern India and Bangladesh. The model showed no potential outbreaks: there was plenty of rain, but temperatures were not warm enough. That was good news and additional validation for the model.
Yemen is also on his mind. The country never fully recovered from its 2017 cholera outbreak, which introduced Vibrio cholerae bacteria back into the region. Since then, poor sanitation systems have allowed the bacteria to persist in drinking water. There are more occurrences of cholera now, particularly in coastal regions where salty rivers create conditions for the bacteria to thrive. What seemed like a one-time epidemic is now turning endemic, and Jutla and Colwell are working to understand conditions that allow the infectious bacteria to stick around in a human population.
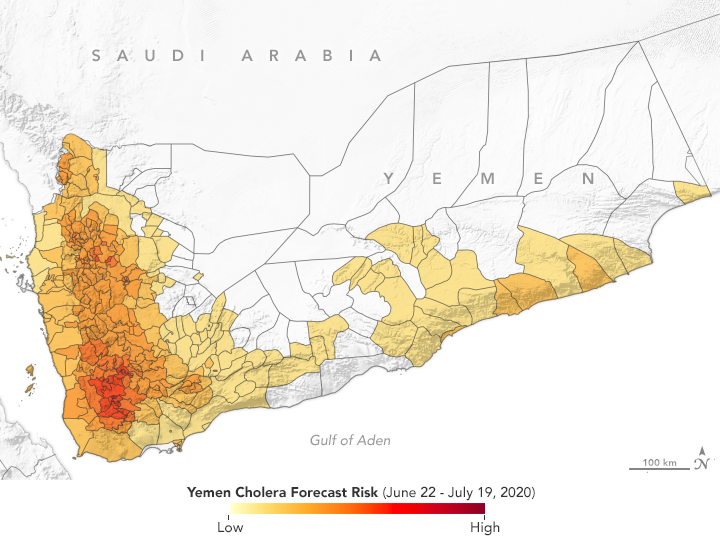
Since the large cholera outbreak in 2017, Yemen has experienced regular episodes of the disease. According to the Cholera Prediction Modeling System, researchers predict outbreaks should be limited to a few hotspots in July 2020. (NASA Earth Observatory map by Lauren Dauphin, based on data from Antar Jutla and Moiz Usmani, University of Florida.)
For Yemen, the team noted that if water sanitation systems are not improved, the number of cases may become so high that cholera may occur seasonally for years. Colwell and Jutla have recently been working with the UK’s Meteorological Office and its Department for International Development to develop protocols to better educate people on how to interpret the model’s results and to reassess prevention and education methods.
“Ultimately, cholera can only be controlled if all the relevant humanitarian agencies work in tandem and synchrony so that we can make this disease a thing of past,” said Jutla.
The same is true for other vector-borne diseases: the diseases seem to be spreading as climate changes, so information sharing is key to prevention and mitigation. In 2020, Anyamba’s team ran its CHIKRisk model and found elevated risk for chikungunya in India, Mexico, Indonesia, Malaysia, and Philippines. And researchers with NASA’s Health and Air Quality Applications Program are working with local health departments in California, New Jersey, Utah, South Dakota, and Louisiana to predict and prepare for cases of West Nile and dengue.
“Incorporating satellite observations in disease models has become an innovative concept for epidemiologists and health officials, and it has proven to be a valuable component in making public health decisions,” said Haynes. “A lot more interest has been generated in this field over the past two decades. The use of satellite data in disease models has gone from being relatively foreign to almost mainstream.”
