The Modeled OceanRather than huddling over bottles of water on a ship in the middle of winter, Corinne Le Quéré huddles in front of a computer screen in her office at the University of East Anglia. “I have an easy life compared to the people who do observations,” she notes. “I’m a modeler. I stay in my office all day.” With the click of a mouse, Le Quéré gathers real-world observations into a computer program that simulates ocean processes. The model helps scientists put together measurements like Feely’s—snapshots of the ocean at specific places and times—to see how individual processes come together to create the conditions they observed. In 2007, Le Quéré announced that her model helped her uncover the first evidence that human activity is changing the ocean carbon sink. |
|||
 | |||
|
Le Quéré and a number of colleagues were studying a natural weather cycle, the Antarctic Circumpolar Wave, which circles Antarctica in the Southern Ocean. “We were trying to see if we could detect which direction the carbon dioxide flux changed when the circumpolar wave passed through,” says Le Quéré. In other words, did the phenomenon cause the ocean to take up more or less carbon dioxide? Unlike Feely and other observational oceanographers who had been trying to measure the human impact on the ocean carbon cycle for decades, Le Quéré simply wanted to understand how natural processes could change the way the Southern Ocean takes carbon from the atmosphere. The problem, Le Quéré found, was there was not enough ocean data to simulate changes in the ocean as the Antarctic Circumpolar Wave changed. “There’s not very much data in the Southern Ocean because people don’t want to go there in the winter. There’s too much wind. But you need winter data to get changes in the carbon sink,” says Le Quéré. “I can complain that there are no data in the winter, but there’s no way I would go there myself,” she adds with a laugh. Instead, Le Quéré inferred ocean carbon dioxide levels based on atmospheric measurements. Scattered across the southern hemisphere, a number of isolated weather stations track concentrations of carbon dioxide in the atmosphere. Many are automated, says Le Quéré, but in some cases, hardy samplers trek outside at the same time every day to pump a sample of atmosphere into a flask, most of which are shipped to the National Oceanic and Atmospheric Administration’s Earth System Research Laboratory in Boulder, Colorado. For Le Quéré, the more remote stations—in places like the South Pole, Palmer Station on the tip of the Antarctic Peninsula, Amsterdam Island in the south Indian Ocean, and Ascension Island in the South Atlantic—provided key measurements. |
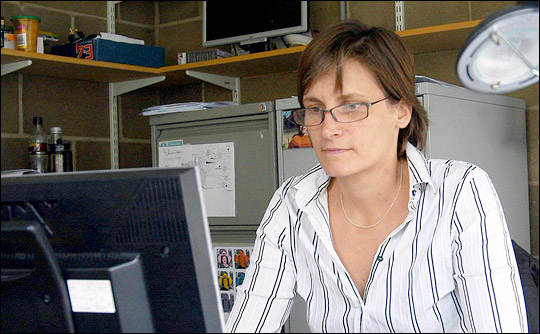
Corinne Le Quéré studies the carbon cycle through computer simulations that incorporate direct observations. (Photograph ©2008 Sheila Davies, University of East Anglia.) | ||
 | |||
|
In these remote places, the biggest thing changing atmospheric carbon dioxide levels is the ocean. The plants whose seasonal cycles dominate atmospheric carbon dioxide concentrations in other parts of the world, simply don’t exist in such places. “If there is one place in the world where you can [measure changes in the ocean carbon sink with atmospheric measurements], it is over the Southern Ocean,” says Le Quéré. “It is the place where you have the least contaminated air, so to speak.” When Le Quéré plugged atmospheric measurements from the Southern Ocean between 1981 and 2004 into her model, she was startled by the result—something far more interesting than the Antarctic Circumpolar Wave. “The Southern Ocean carbon sink has not changed at all in 25 years. That’s unexpected because carbon dioxide is increasing so fast in the atmosphere that you would expect the sink to increase as well,” says Le Quéré. But it hadn’t. Instead, the Southern Ocean held steady, while atmospheric carbon dioxide concentrations climbed. Why? |
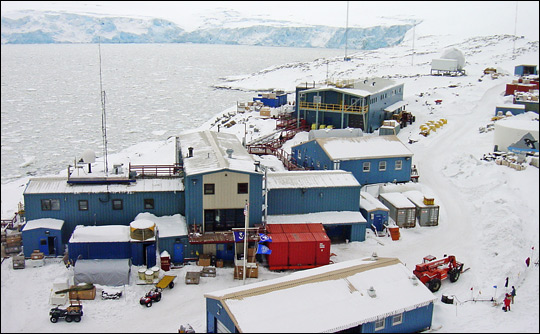
Continuous measurements of the atmosphere are obtained at cold and remote observatories on the shores of the Southern Ocean, such as Palmer Station on the Antarctic Peninsula. These atmospheric data complement the direct measurements of ocean water made during research cruises. (Photograph courtesy Jeffrey Kietzmann, National Science Foundation.) | ||
|
|
Le Quéré expected to see a steady increase in the amount of carbon dioxide absorbed by the Southern Ocean between 1981 and 2004 (blue line). Instead, weather station measurements (red line) suggested year-to-year variability, but no long-term increase over time. (Graph by Corrine Le Quéré, University of East Anglia.) | |
