A New Way to View Vegetation |
|||
“The problem is that NDVI is just a qualitative measurement of vegetation density, but it is not a quantitative measure of how much vegetation is present,” says Buermann. “Many scientists don’t trust NDVI measurements enough to use them in climate models.” In other words, NDVI can give researchers an idea of how lush the vegetation is in one area of the world relative to another, but it cannot tell them quantitatively how much vegetation there is in that one spot. Only by observing NDVI in an area over a long period of time and comparing it to other regions around the world, can researchers get a fix on what the normal vegetation density is for a region. Many in the science community feel that NDVI values are too inexact to use in climate models to determine, for instance, how much carbon plants draw down each year in a given area. Buermann explains that there is a better measurement for plant density and growth known as leaf area index (LAI). LAI assigns a quantifiable value to the amount of vegetation on the ground. Simply put, LAI is the leaf area per unit ground area as seen when looking down on vegetation. One can imagine looking down on a tree canopy from a platform that stands high above the treetops. A tree canopy would have a leaf area index of one if every square inch of the ground below the tree canopy were overshadowed by exactly one leaf in the tree canopy. If exactly two leaves blocked the view of the ground then the tree canopy would have a leaf area index of two. Of course, most trees have layers and layers of leaves obstructing patches of the land unevenly. So a broadleaf deciduous forest (one that loses its leaves in the fall) typically will have a leaf area index of 3 or above in the summer, and evergreen conifer trees will have an LAI range of between 2 and 3.5 year round. Horticulturists and biologists have used leaf area index to measure leaf
density and vegetation health since the early part of the last century.
Measurements were usually made on a local scale on the ground or from an
airplane. For roughly the last decade, remote sensing scientists have attempted
to measure LAI on a global scale using satellite data. The difficulty has always
been one of accurately calculating the amount of leaves on millions of trees and
shrubs from images taken from many miles above the ground. Previous attempts
have yielded only very rough measurements of LAI directly from NDVI values.
|
|||
 |
Buermann says he and his colleagues have uncovered a way to obtain more accurate values. The Boston team has developed a computer program that takes satellite data and other information gathered about the Earth’s surface and transforms them into values for leaf area index. “Essentially, what we try to do is simulate how the light is reflected off of the vegetation canopy,” says Buermann. Given ground cover and soil type, their computer simulation calculates what light from the sun would look like after it hits the vegetation and the ground and is reflected back up through the leaves, the atmosphere, and into space. Using this computer simulation, the scientists can compute LAI values by observing near-infrared and visible light from satellite data. Together with researchers form the University of Arizona, Georgia Tech, and
Ames Research Center, the scientists first employed their method on the AVHRR
satellite data gathered from 1981 to 1990. They created global data sets/maps
that displayed the average LAI values over the globe for each month over the
ten-year period derived from the infrared and visible light readings from the
data. “We then needed to show that LAI computed from satellite data are
consistent with observed data,” says Buermann. Where they could, the
researchers compared the satellite LAI values to existing LAI values obtained by
ground-based measurements over the same period. Most of these
records were of farmland in the Midwestern Plains States and of temperate and
boreal forests of North America. The LAI values matched up well for both types
of terrain (Buermann et al. 2001a). |
Leaf Area Index (LAI) is related to, but not directly proportional to, Normalized Difference Vegetation Index (NDVI). In addition, different vegetation types (broadleaf evergreens versus needleleaf evergreens, for example) and soil types exhibit different relationships between the two parameters. The graph at left compares NDVI to LAI. Unfortunately, the relationship between NDVI and LAI is not unique (multiple values of NDVI correspond to a single LAI value), a problem which is being addressed by the current generation of satellite instruments, such as the Moderate-Resolution Imaging Spectroradiometer (MODIS). (Graph courtesy Wolfgang Buermann, Boston University Climate and Vegetation Research Group.) | |
Unfortunately, these ground-based records weren’t very extensive. To test their LAI values thoroughly in this manner, the researchers would require LAI measurements for all types of terrain and all regions of the world. But conducting ground-based surveys of leaf area index worldwide would have been incredibly costly and time consuming. As an alternative, the team compared LAI values to known changes in plant growth around the world. If the LAI values were representative of vegetation density, then they should move in concert with the changes in seasons, geography, and rainfall patterns. Buermann and his colleagues went about verifying, for instance, that LAI values of broadleaf evergreen trees in equatorial rainforests resulted in some of the highest LAI values and barren deserts resulted in some of the lowest values. They verified that seasonal changes in vegetation in the northern latitudes resulted in smooth seasonal changes in LAI. They even compared the LAI measurements to El Niño events in the 1980s. As expected, in areas that experience greater rainfall during El Niño, such as the west coast of Central America and South America, LAI values were higher. In areas that experience less rainfall, such as Australia, the LAI values were lower (Buermann et al. 2001a). “We had good agreement in semi-arid, tropical, and subtropical areas where change in vegetation and precipitation run together,” says Buermann.
|
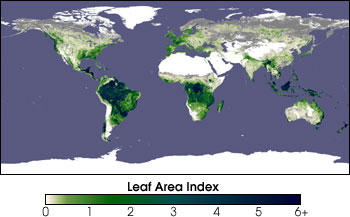
Scientists used the long record of NDVI data acquired by NOAA’s polar-orbiting weather satellites to create a long-term LAI dataset. The image at left shows LAI values from March 1991. An animation shows average monthly LAI from July 1981 to June 1991. The MODIS instruments aboard the Terra and Aqua satellites will extend this dataset with more accurate LAI measurements. (Data provided by Boston University Climate and Vegetation Research Group. Image and animation by Robert Simmon) |