Warm Weather Experiments | |||
To test how land cover change might have influenced summer climate, the team used the RAMS model to create pairs of climate simulations for three July-August periods: 1973, 1989, and 1994. The 1973 and 1994 seasons were wetter than normal, while 1989 was an unusually dry year. Marshall explains the concept behind the paired scenarios. “To test whether changing the land cover could have changed the weather, you first define the area you want to model, and then you use meteorological observations from the time period you are interested in to identify the large-scale meteorological influences that were acting on your modeling area at that time. You hold those external influences constant and run two simulations: one with the old land cover, and one with the present land cover.” For all three time periods, the team discovered significant differences in the intensity and location of precipitation when the pre-1900 land cover was replaced with the present-day land cover. South of the latitude of Tampa, two roughly parallel strips of decreased rainfall ran north to south on either side of the heart of the peninsula. Rainfall increased somewhat in a strip down the center of the state. When averaged across the region, the modeled rainfall totals for all three periods were 10-12 percent less with the present-day land cover than they would have been with the pre-1900 land cover. |
|||
Temperatures were affected, too. Urbanization increased maximum daily temperatures by several degrees, particularly around the Miami-Ft. Lauderdale area on the state’s southeastern tip. In the center of the peninsula, the daily temperature differences were amplified, with daytime high temperatures up to four degrees Celsius warmer with the present-day land cover, and nighttime lows up to 4 degrees cooler. One reason for this, Pielke explains, is the draining of the Kissimmee River Floodplain in the center of the peninsula. In the absence of other large-scale meteorological influences, the afternoon sea breeze determines where, when, and how much it rains in Florida. The sea breeze occurs each day as the Sun heats the land more than it heats the ocean. The air above the land warms and rises, and cooler air from over the Gulf of Mexico and the Atlantic Ocean flows inland. In the past, the standing water in the Kissimmee Flood Plain would have been like an inland sea, and the air over the floodplain would have been cooler than the areas on either side, between the interior and the coasts. When the dry land on either side heated up in the daytime, cool air would have flowed outward from the floodplain and collided with the onshore sea breezes, enhancing convection and rainfall. |
The draining of many of Florida’s wetlands did more than transform the landscape—it also changed the climate. This map shows the difference in rainfall calculated by a computer model using landcover data from 1993 compared to model results using the pre-1900 landcover. Areas that are now drier are brown, and wetter areas are green. Averaged across the entire state, precipitation may be as much as 12 percent less than it would have been if Florida’s pre-1900 landscape still existed. (Map courtesy Curtis Marshall, Colorado State University/NOAA) | ||
 | |||
“Overall, what we see with the current land cover is a weakening of the sea breeze, less evaporation, less rainfall, and higher temperatures,” says Marshall. By converting the wetlands of central and southern Florida into one of the nation’s most productive agricultural areas, we may have inadvertently caused the summer climate to get warmer and drier. Cool Weather ExperimentsA warmer, drier summer would not have been on the wish list of any of the region’s farmers, but the results of the team’s cold-season experiments are what really got people’s attention. Florida is one of the few places in the country where fruits and vegetables can be grown year round. The mild winter and ample rainfall are precisely why the Florida settlers appealed to Congress in the early part of the 20th century for the federal government’s help in converting the state’s “worthless” swamps into peat-rich farmlands. |
This map shows model simulations of how Florida’s wind patterns have changed since humans converted much of the state's wetlands to croplands. Arrows indicate the change in wind speed and direction, while the colors indicate the change in divergence—air flowing outward from an area. Red areas show where divergence (outward flow) has decreased most dramatically, while blue areas show where divergence has increased. The large red area north of Lake Okeechobee, in the center of the state, is where the Kissimmee River floodplain and its extensive wetlands once existed.(Map courtesy Curtis Marshall, Colorado State University/NOAA) | ||
Winter vegetable and citrus farmers in the northern and central part of the state, however, still had to fear the occasional winter cold snap that was cold enough and long enough to ruin crops. For the past 150 years, the citrus industry, first established in the less disease-prone soils of northern Florida, has progressively moved southward to escape tree-killing freezes. A major southward migration shifted production into central Florida in the early 1900s, and production flourished. But several catastrophic freezes there in the 1980s drove many citrus farms even farther south, in particular to the southwest of Lake Okeechobee. And then in 1997 came an overnight freeze that dipped down to citrus and vegetable farms in locations farther south than Lake Okeechobee. Was the occurrence of such a devastating freeze event so far south simply a random “blip” in Florida’s climate history? Was it just a coincidence that as the citrus farms moved south over the past century, the winter freezes they were trying to escape seemed to be right on their heels? The team reviewed the historical record of severe freeze impacts on the Florida citrus industry and pulled together a second experiment to answer the question. Using their pre-1900 and present-day land cover data, they created a series of paired comparisons of the modeled weather at the time of three damaging freezes: December 26, 1983; December 25, 1989; and January 19, 1997. According to the model results, the southward creep of the winter freeze line was neither a fluke nor a coincidence. It appeared to be the direct result of moving the farms farther south. |
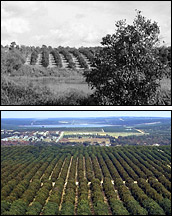
Orange groves migrated southward throughout the twentieth century to escape damaging frosts. [Photographs courtesy Library of Congress Prints and Photographs Online Catalog (top) and USDA Online Photography Center (lower)] | ||
 | |||
The team’s warm-season experiments had demonstrated that in the summer, evaporation from the standing water in Florida’s wetlands would have kept daytime temperatures down, explains Marshall. But the cold-season experiments demonstrated another way the wetlands acted as a thermal regulator. In the winter, the standing water in wetlands would have acted like a hot water bottle, holding on to the daytime heat and radiating it back into the night air. The model told the scientists that areas where wetlands had been converted to agriculture experienced nighttime temperatures that were as much as 2 degrees Celsius colder than they would have been. Two degrees may not seem like much, the scientists wrote in their article on their results, but it’s the difference between a light freeze and devastating one. In all three cases, not only were the temperatures colder in the converted areas, but they stayed below zero for longer periods. |
The most damaging aspect of landcover-related climate change in Florida is the decrease in nighttime winter temperatures in the Kissimmee River floodplain and around Lake Okeechobee. These areas, largely planted with orange groves and sugarcane, experience colder temperatures (left), and longer freezes (right). Purple and blue areas represent regions with increased risk of damaging freezes, while yellow and red represent areas less likely to freeze. (Maps courtesy Curtis Marshall, Colorado State University/NOAA) | ||
