By Eric Lindstrom
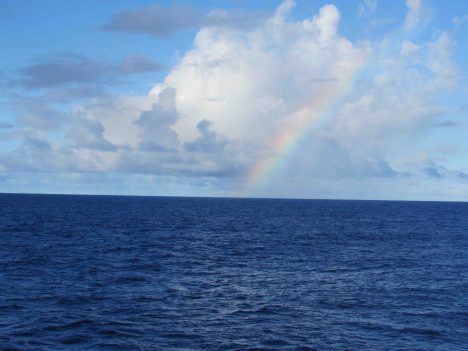
Blue sea and sky, with a nice rainbow.
The beauty of sea and sky in the open ocean of the tropics is a wonder to behold. There seemingly are an infinite number of ways to mix the sun, clouds, water, wind, and stars into poetry and science. For today I choose only a tiny slice of this infinite variety: Today is all about the blue.
Blue is the fundamental background of the sea and sky in the tropical oceanic regions of the Earth. The preferential scattering of blue light in the full spectrum of visible light from the sun accounts for the blue sky. Most open-ocean regions have remarkably clear water, which when illuminated by the sun also takes on a deep blue hue. Other visible light is absorbed quickly in the sea and it remains for the blue to be scattered back and illuminate modest depths.
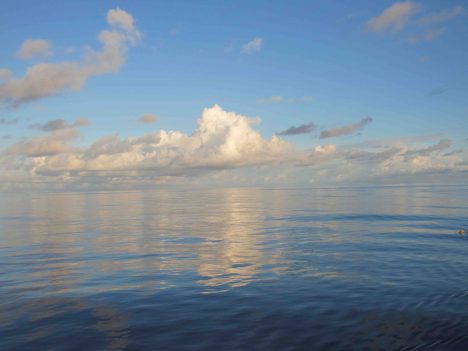
Sea and sky on a very calm day.
While clear seawater is blue, if particles are introduced to the water such as floating microscopic marine organisms (plankton) or silt and mud, it can be transformed shades of green, red, and brown. However, clear blue seawater does not indicate the absence of life: Blue ocean water is still a sea of life with submicroscopic picoplankton and marine viruses making a life in the chemical soup that is seawater.
Oceanographers like Carol Anne Clayson from Woods Hole Oceanographic Institution use a special instrument, the HOBI a-Sphere Spectrophotometer, to measure upper ocean absorption of light. The instrument uses an internal light source to measure absorption characteristics as it is lowered from the ship. This measurement is critical to estimating the transfer of radiant heat energy across the air-sea interface. Here in the SPURS-2 field site, the water is so clear that sunlight penetrates well below the well-mixed surface layer and is lost to typical energy budgeting exercises. So, the question of how much energy is lost in such calculations is a big question (considering the vast extent of this very clear blue ocean) when climate studies demand a careful accounting of heat flows to and from the ocean.
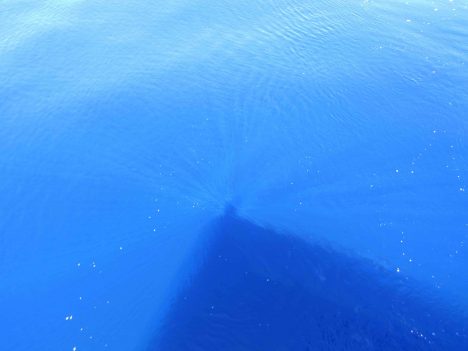
Blue ocean, with sun rays around Eric’s shadow.
It is often true and hard to imagine that those days when sea and sky are blue and the harsh tropical sun sees no cloud are when the atmosphere is feasting on its fuel from the ocean, water vapor, through the process of evaporation. We all know evaporation from the ocean is invisible, but I would use poetic license and say that evaporation is really blue! It is a clear dry wind over a warm ocean (e.g. trade winds in the tropics) that fills the atmosphere with the moisture that accounts for most of our rain. Like yesterday, when it was clear blue sky from horizon to horizon with a gentle wind leaving the deep blue ocean without a single whitecap, it is all blue and it is bonanza for evaporation.
Raymond Graham and Jim Edson from University of Connecticut (whose color brand is navy blue!) are making careful measurements of both evaporation and precipitation during SPURS-2. Despite our focus on salinity and the role of rain in forming the eastern tropical Pacific fresh pool, we must completely account for all the moisture that flows between atmosphere and ocean. The rain is visible and tangible. The evaporation is invisible but critical to the moisture budget. They are also profiling the temperature and moisture through the atmosphere using instruments on balloons (learn more about this topic in a later blog post!).
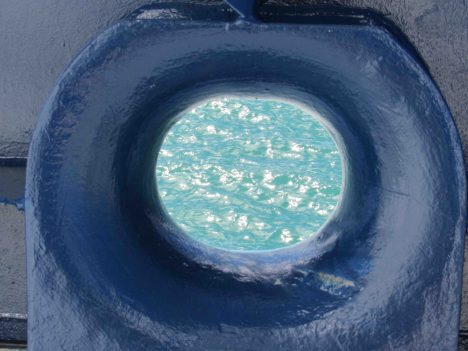
The R/V Revelle blue meets ocean blue.
Blue is the color of our daily lives in R/V Revelle. The ship is blue. The crew’s t-shirts are blue. The ocean is blue. The sky is blue. The rods and cones on our retina normally get a color workout every day. Out here, some of our retinal cells are getting a six-week vacation. The 2 percent of our cone cells tuned to blue light are getting no rest at all. Maybe that is why the colors of land (greens and reds) look so vivid that first day back ashore? Or maybe, being back ashore just makes an oceanographer blue!
By Eric Lindstrom
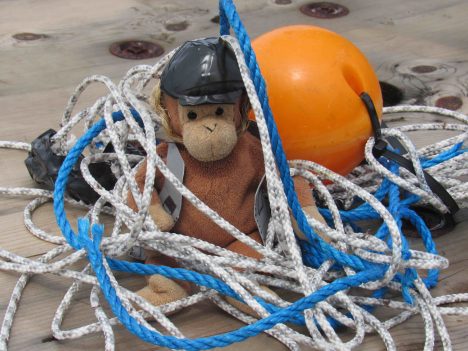
Monkey makes its own mess!
Long ago on a planet very similar to our own, oceanography was done without the Internet or regular communication with shore. It required careful planning and forecasts of the conditions to be encountered were vague at best. Executing the original plan of work for a voyage was always a good objective.
Unlike those days on that planet, the shipboard work of SPURS-2 seeks to optimize our operation as we go by depending on a “dry team” ashore for a daily flow of information. The information comes from a number of sources including satellites, in situ data (data collected in place), models, and combinations of these sources. The daily flow of information comes to us via the Internet in a “tarball.” In computing, tar is a computer software utility (originating from Tape ARchive) for collecting many files into one archive file, often referred to as a tarball. Scientists on R/V Revelle receive the daily tarball assembled by our dry team at the NASA Jet Propulsion Laboratory (in association with many SPURS-2 scientists ashore). The tarball contains files for daily weather and oceanographic analysis and a wealth of ancillary information. The tarball is information desired by the team aboard the ship, a key point that should not be overlooked in the following discourse.
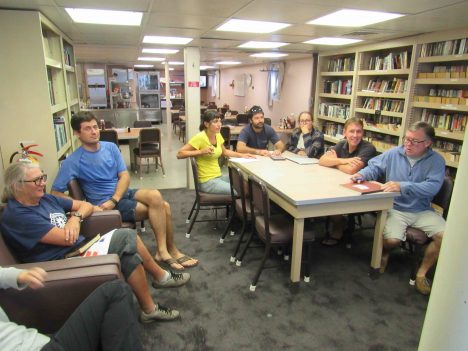
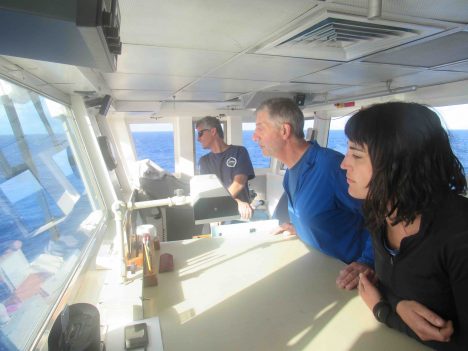
SPURS-2 planning is a daily occurrence in the R/V Revelle library. From left to right: Janet Spintall, Denis Volkov, Kyla Drushka, Ben Hodges, Audry Hasson, Julian Schanze and Jim Edson.
Well, you can see where I am going with this: a tarball is also a blob of petroleum that has been weathered after floating in the ocean, sticky marine debris from the age of oil spills. With all due respect to the efforts of the dry team, commonality of the computing and oil tarball terminology becomes all too clear when one tries to reconcile the complex flows of data from both the tarball and the vast array of instruments on the ship. The tangle of seemingly conflicting information can make you feel like you are dealing with a tarball of the sticky black variety!
The tarball does focus our attention by feeding back to us our own observations. After R/V Revelle has deployed moorings, drifters, and floats we might receive back meteorological data from the central WHOI mooring, profiles from the NOAA moorings, trajectories of surface drifters, and profiles from the Argo floats. This real information may or may not conflict with what we imagined we would see (and built our plans around). So, this tarball pushes us into consideration of whether our plans going forward need revision or remain sound.
For example, the tarball is always an implicit invitation to re-consider the planned work to take account of current or forecast conditions. Ostensibly this information enables us to make the most of our valuable ship time. However, having a constantly evolving plan of action is rough on people and their routines. Plans tend to lose their certainty.
Of course, proposals are funded and years of work are banking on our executing a planned set of measurements. However, the decisions are difficult, if we planned to collect seven days of Surface Salinity Profiler data in rainy conditions and our planned operations turn out to be south of the actual rains for the previous two weeks, do we change our plans? Or, will Mother Nature bring rain to us in the coming weeks if we simply execute the plan with which we came to sea? The tarball gives us some weather projections, satellite rain rate and cloud maps, as well as current and salinity patterns in the ocean and model forecasts to help with the decision-making. Unfortunately what seems clear and useful to those at desks thousands of miles away, can be less than clear and ultimately confusing when working on an isolated patch of ocean far from regular observation. The effort to make good use and sense of the tarball is one of the additional challenges facing modern oceanography.
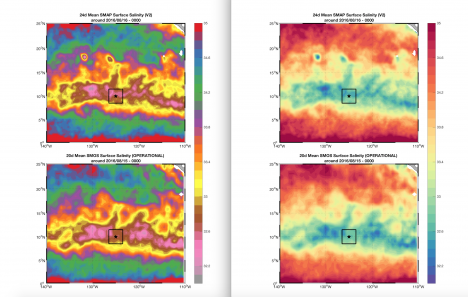
Two-panel plots of satellite salinity from the SMOS and SMAP missions. The only difference is the color scale; it is kind of a Rorschach test for oceanographers. Do you see fronts in one and not the other? Well, they are the same! What you see and interpret can be biased by how you present the information. That is another sticky mess in the tarball.
Before the tarball, seagoing oceangraphy was simpler (and more dangerous) and plans were simply to be executed. With the tarball, science is safer and more nimble and plans are malleable. I think that for us, older humans, the modern way with the tarball is more stressful. Or maybe, if you came of age with the Internet, life without the tarball is unimaginably silly and stupid. For a young oceanographer the science IS the sticky mess inside the tarball!
Whatever the reality, our information age has made a day at sea a challenge in environmental analysis. No more hoping, imagining, or guessing – it is all in the tarball if only you can figure it out!
By Eric Lindstrom
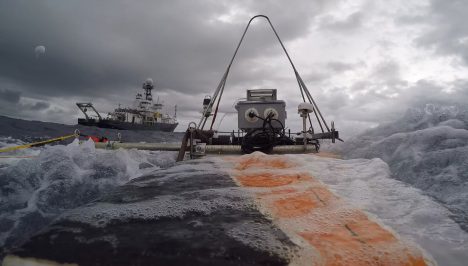
The R/V Revelle and the Lighter-Than-Air InfraRed System (on the left corner), as seen from the Surface Salinity Profiler. Credit: Dan Clark.
Kyla Drushka from University of Washington Applied Physics Laboratory (APL) received a National Science Foundation grant to participate in SPURS-2. It is one cornerstone of our work and is entitled “Rain-Formed Fresh Lenses in SPURS-2.” The idea of rainfall resulting in freshwater puddles or lenses at the sea surface is (perhaps) easy to imagine but is very tricky to observe and study in the real world. SPURS-2 will provide a wealth of new data on this subject with which to test the fidelity of our scientific imagination.
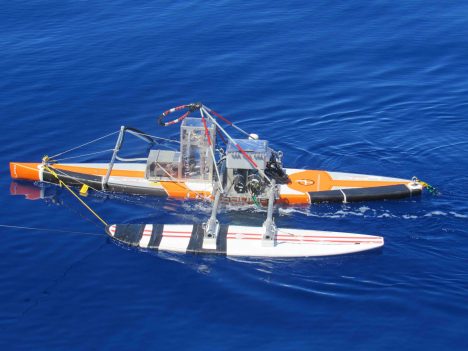
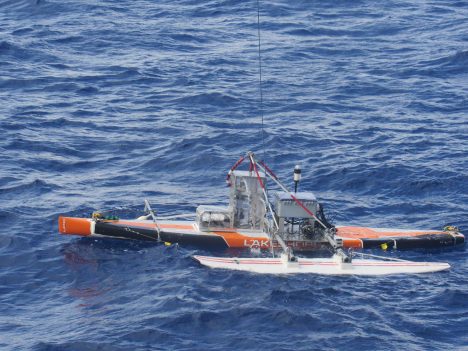
A beauty shot of the Surface Salinity Profiler.
Kyla and the APL crew have a variety of instruments aboard R/V Revelle but the Surface Salinity Profiler (SSP) is central to SPURS-2 science objectives. When you want to know the fate of rainwater after it hits the sea surface, measuring salinity (or equivalently the amount of freshwater) in the upper meter of the ocean is crucial. The profile of salinity in that top meter of the ocean is elusive for a number of reasons – technical and logistical. Technically, salinity sensors require some time and bubble-free water flow to make the measurement. However, normally the sea surface is rapidly moving up and down (because of waves!) so a sensor is not always in the water and away from bubbles until it is several meters below the surface. Finding a way to tow salinity (and other) sensors at fixed, shallow depths following the motions of the sea is another approach. APL scientists and engineers including Andy Jessup, Bill Asher, and Dan Clark designed the SSP to apply this approach.
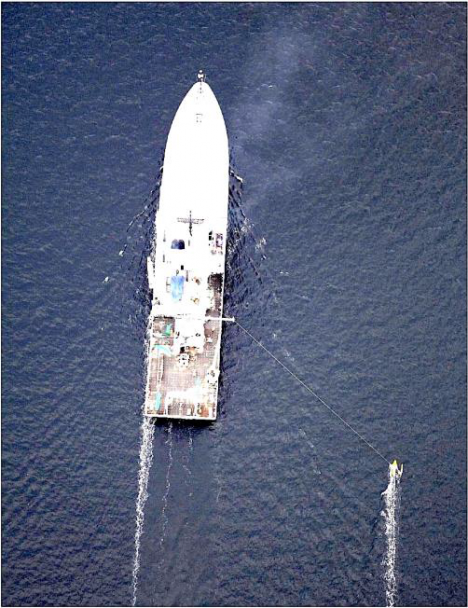
How the Surface Salinity Profiler runs outboard the ship — photo taken from the Lighter-Than-Air InfraRed System balloon camera.
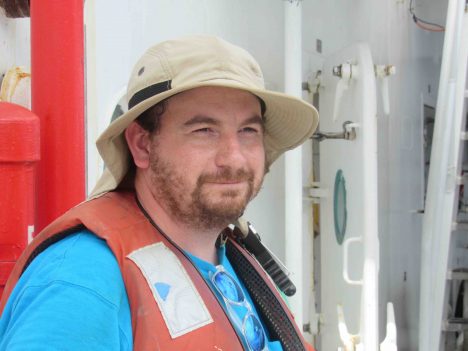
Dan Clark, APL engineer extraordinaire.
The SSP platform is a converted paddleboard with a keel and surfboard outrigger. It is tethered to the ship so it skims the sea surface outside the wake or influence of the ship. Below the paddleboard, on the leading edge of the keel, are salinity (and temperature) sensors at depths of 10 centimeters (4 inches), 30 centimeters (1 foot), 50 centimeters (1.64 feet), and 100 centimeters (3.28 feet), microstructure sensors (to estimate turbulence), and cameras. The Salinity Snake (see my last blog entry) supplements the SSP by providing temperature and salinity in the upper few centimeters of the ocean. The SSP can be towed for many hours before the instrument batteries need refreshing.
Deployment of SSP is most informative when there is a rain event, leading to stratification of the near-surface ocean with less dense fresher water on top of denser saltier water. If there is a rain event ahead of the ship, the SSP goes in the water. Then it can measure how the ocean changes over the periods from before rain, during rain, and recovering from rain. Salinity from several depths and simultaneous turbulence estimates are then used to determine how rainwater mixes into the ocean.
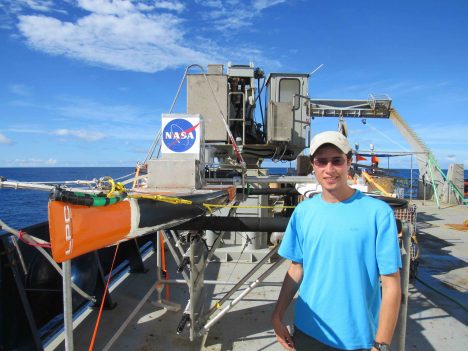
Suneil Iyer with Surface Salinity Profiler on deck (sensor to bottom left on keel)
Suneil Iyer is a new graduate student at University of Washington who will work with Kyla on interpretation of the microstructure measurements from the SSP data. He just arrived in Seattle from his hometown of Kansas City, Kansas, one week before the R/V Revelle departure from Honolulu. He just had time to find an apartment before jumping on a plane for SPURS-2. Graduate school in oceanography can be a blast of new experiences! This is not his first exposure to physical oceanography: Suneil worked on tides in estuaries during his undergraduate work at University of South Carolina.
Kyla Drushka working on the Surface Salinity Profiler.
Kyla Drushka joined UW in 2014 after PhD work at Scripps Institution of Oceanography. She is now an active member of NASA’s Ocean Salinity Science Team and the mission science team for the Surface Water Ocean Topography satellite that is planned for launch in April 2021.
This blog entry goes to press near an auspicious moment on R/V Revelle SPURS-2 voyage. Saturday at 2 am (local time) is the halfway point of our expedition! In our oceanography lexicon we would call this the “hump day” for our voyage. For all you land-loving 5-day-a-weekers hump day might mean Wednesday. For the 24/7 work at sea, we really have only a “hump moment” to mark the halfway point of a continuous work schedule. Like any good NASA activity, people aboard have countdowns running to both our hump moment and our arrival back in Honolulu (8 am on Sept. 23). Amusement is in short supply!
By Eric Lindstrom
A longstanding technical challenge for oceanography has been how to measure the sea surface – temperature, salinity, gas exchange, or surfactants – to name a few examples. Obviously enough, the surface is where the ocean and atmosphere interact and exchange heat, freshwater, gases, momentum, and particles of all kinds. So, how do we measure the properties and exchanges right at the surface? If we are on a ship or any floating platform, the platform disturbs the surface. From satellites we can measure many properties of the surface but only on very broad scales. The R/V Revelle, right now, is the ship showing how modern science is meeting the challenge. Let me tell you about some key elements.
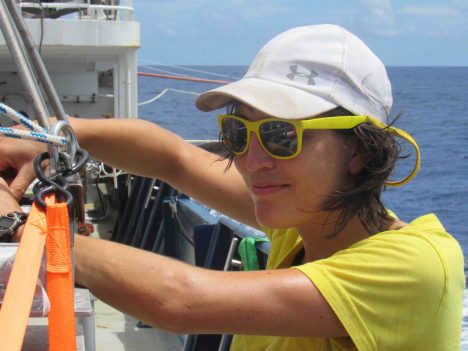
Julian Schanze from Earth and Space Research in Seattle and Jim Edson from University of Connecticut have brought two instruments aboard with innovative ways to measure the temperature and salinity at the surface – the Sea Snake for temperature (Edson) and the Surface Salinity Snake (Shanze) for, obviously, surface salinity. The former places a temperature sensor at the end of flexible hose that is hung outboard from the bow of the ship (near the wake), to continuously measure temperature. The Salinity Snake, outboard of the wake passes water through a vortex de-bubbler and thermosalinograph to obtain an estimate of salinity within inches of the ocean surface. It is an awesome “contraption” (with no offense to Julian).
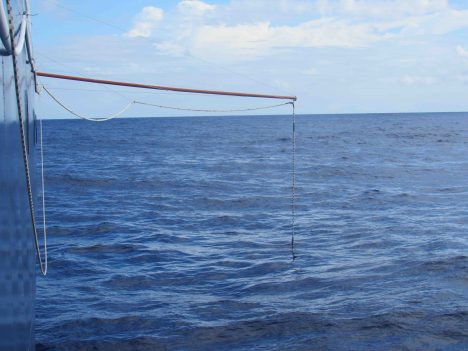
The Salinity Snake being deployed over the starboard side.
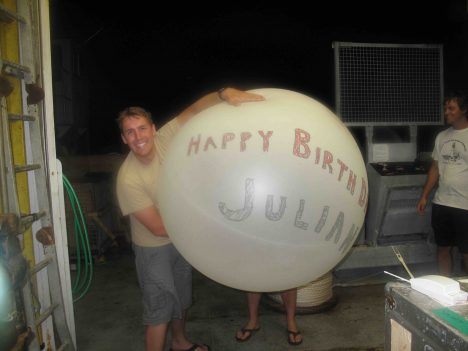
Julian Schanze’s birthday balloon.
Today is Julian’s birthday so all the Salinity Snake gear has been draped with colorful paper snakes carrying birthday greetings. Julian participated in SPURS-1 in 2012 and has since received his PhD and is making a name for himself by tackling surface salinity science from gadget to satellite and from seawater intake to space. It is wonderful to have someone so capable on the NASA Ocean Salinity Science Team!
Andy Jessup, our chief scientist from University of Washington Applied Physics Laboratory and Michael Reynolds from Remote Measurements and Research Co. in Seattle have brought a dazzling array of instruments for measuring and probing the skin temperature of the ocean. The surface of the ocean is known to have a cool skin at the molecular level. Photos of the sea surface with infrared cameras reveal complex and interesting patterns as a result of mixing, wave breaking, surfactant conditions, and wind. NASA has always had a deep interest in skin temperature because satellites do measure this skin temperature while every probe you stick in the ocean measures something deeper and different than skin temperature. From the Revelle, Andy and Michael are using several infrared radiometers and cameras to measure and depict the sea surface skin temperature. There is one on a boom to measure outboard of the ship wake, one mounted on the rail to look outward from the ship and another on a balloon to take infrared photos of the skin from 300 feet above the ship (the Lighter-Than-Air InfraRed System – LTAIRS.)
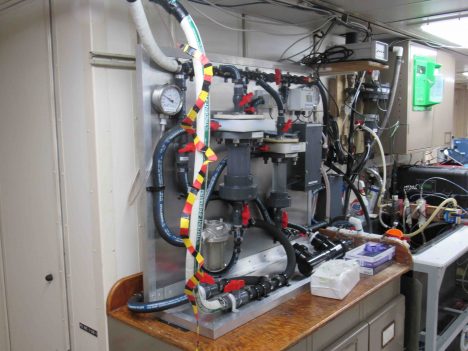
The laboratory end of the Salinity Snake and Carbon Dioxide analysis.
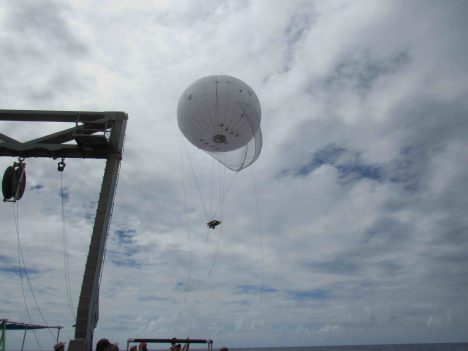
LTAIRS ascends toward 300 feet.
Eric Chan, from University of Hawaii, is aboard measuring making a suite of carbon dioxide, pH, and Dissolved Inorganic Carbon measurements for principal investigator David Ho. They study the exchange of carbon dioxide across the air-sea interface and they’re particularly interested in how rainwater on the surface of the ocean impacts the gas exchanges.
The array of instrumentation aboard Revelle is quite astonishing and the technical innovations displayed in measuring the sea surface are truly remarkable. And I haven’t even mentioned the Surface Salinity Profiler yet in this blog post. I have been teasing you with that since the start of the voyage and I PROMISE to give it a blog entry all to itself!
Today is also the birthday of the R/V Revelle Captain, Christopher Curl. I am sure I speak on behalf of the entire SPURS-2 science party when I offer him a hearty “HAPPY BIRTHDAY!” and say how pleased we are with the entire ship and crew of R/V Revelle. I guess that sharing the ship with a group of rare ocean-skin specialists with sea snakes is not how he imagined this birthday, but he is quick with a smile and will roll with our skinny offerings!
By Eric Lindstrom
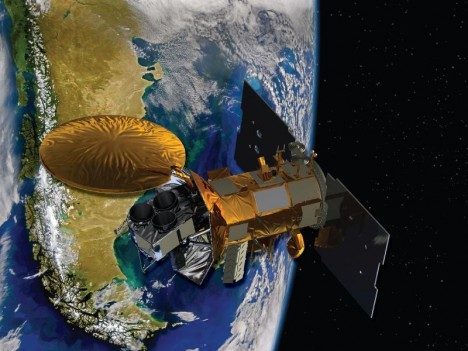
A representation of the SAC-D spacecraft, which carried the Aquarius instrument.
One of the most common questions I get (and the first comment to this blog) is “How do you measure ocean salinity from space?” During the SPURS-1 campaign in 2012 I wrote a blog post on this topic. Basically the story is one of building a very sensitive instrument (a radiometer) to detect subtle variations of L-band microwave emissions from the ocean. Aquarius, launched in June 2011 was designed specifically for that purpose. Unfortunately, the spacecraft on which the Aquarius instrument flew suffered an unrecoverable failure in spring of 2015. Fortunately for oceanography, NASA launched Soil Moisture Active-Passive mission (SMAP) in January 2015. SMAP uses similar technology (an L-band radiometer) to measure soil moisture. While SMAP is not as sensitive as Aquarius, NASA is successfully producing a salinity product from this mission’s data.
The satellite missions detect only the salinity at the surface of the ocean. This tells us much about the exchanges of water with the atmosphere once we learn how to interpret the signals. The SPURS expeditions are all about learning how the surface salinity of the ocean changes so we can use the global surface salinity maps from space to diagnose matters of the water cycle over the ocean.
The European Space Agency also launched the Soil Moisture and Ocean Salinity mission (SMOS). It uses a different technology (a synthetic aperture antenna array) to make the measurements, but also provides a salinity product we use daily. Audrey Hasson from the French space agency is aboard R/V Revelle and helping us bring all the space data (salinity, temperature, winds, sea height, waves) to the ship to guide our daily operations.
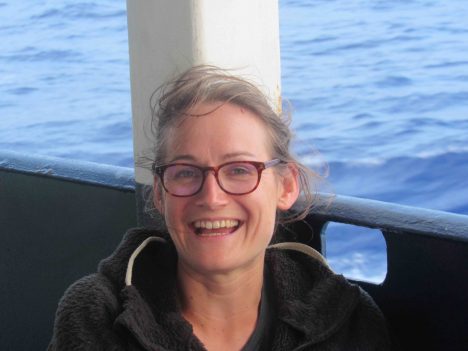
Audrey Hasson, from the French space agency, aboard the R/V Revelle.
Most of the oceanographic work on this voyage is focused on measuring and understanding the variations of salinity in the top 10 meters (~30 feet) of the ocean. Here, in one of the rainier spots on the planet, rainwater freshens the surface ocean. The degree of freshening was not really appreciated until we saw the surface salinity from space. Measurements from ships and buoys usually miss sampling the upper few meters of the ocean because it is technically difficult to make those measurements. Taking full advantage of Aquarius and SMOS surface salinity observations has required a scientific revolution in measurement of salinity in the top 10 meters of the ocean.
Getting back to shipboard life, I am happy to report that all the minor cases of seasickness are abating. Those that suffered from it are now smiling and eating. No serious cases of seasickness occurred at all, so my guess is that all the first-timers will return to sea in future!
Deploying the Surface Salinity Profiler.
Also, today was the first trial deployment of one of our key instruments, the Surface Salinity Profiler (SSP), from University of Washington Applied Physics Lab. It’s a salinity measurement “laboratory on a sailboard” that can be towed at outboard of the ship. The instrument can measure salinity simultaneously and continuously at several shallow depths away from the ship’s influence and wake. The trial was devoted to the mechanics of deployment and recovery and the dynamics of towing the system. You will hear much more about SSP as the voyage progresses.
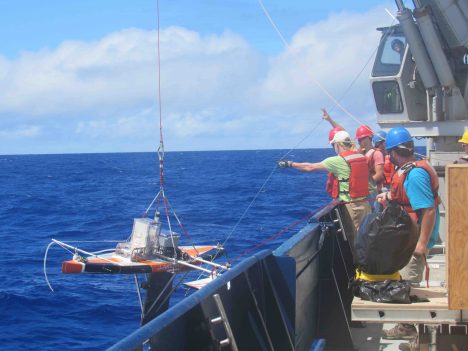
Recovering the Surface Salinity Profiler.
Winds dropped over night and whitecaps have largely disappeared. The sky is broken clouds with an occasional very light rain shower. Air temperature is 80°F. So overall, the weather conditions for test deployments off the ship are much better today!
