By Eric Lindstrom
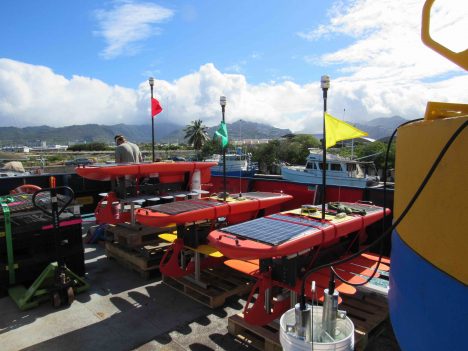
Our wave gliders, ready for action.
Fieldwork in physical oceanography, like many sciences, requires enormous preparation followed by a shorter very intensive period of action. SPURS-2 is no exception. The work over the next six weeks has been in the planning and staging for several years. Now, all the gear and scientists have reached the ship and we are on our way to completing all of our the carefully laid plans.
It is tempting to express the mood aboard the R/V Revelle as a great sense of anticipation. From discussion around the ship, it seems like no one has seen a voyage with these many sensors and equipment installed aboard this ship. There seem to be instruments mounted everywhere from bow to stern! And, of course, the scientists and technicians are deeply interested in what each sensor will tell them and what kind of scientific discoveries will emerge. These instruments are designed to see the delicate slow dance between the ocean and atmosphere around the ship over the coming weeks. Other gear will be deployed to continue the careful watch on ocean and atmosphere for the next year. All our time and investment is focused on understanding the aspects of this “slow dance” that involve water exchanges between ocean and atmosphere. In the atmosphere we will be looking at the characteristics of rainfall and evaporation at the sea surface. In the ocean we will be study the characteristics of the temperature and salinity patterns induced by the rain. These interactions are a newly accessible field of study resulting from the advent of satellite rainfall and salinity measurements and new shipboard tools for studying the upper few meters of the ocean.
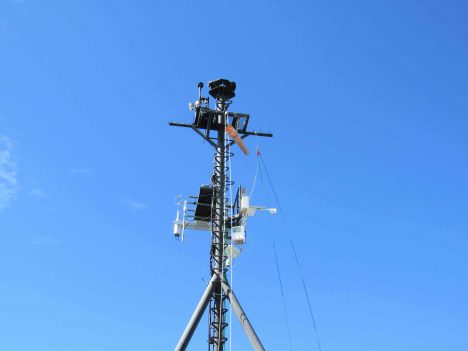
One of the numerous meteorological masts installed on the R/V Revelle for SPURS-2.
All the scientific party on R/V Revelle likely feel some sense of adventure, since the precise nature of what we will see and discover is a matter of conjecture. We do know from the Aquarius satellite data that there is a large pool of relatively fresh water built up seasonally at the surface of the eastern tropical Pacific north of the equator. Oceanographers are curious as to how this pool is trapped in the region for part of the year and how it is seasonally released to the west. As physicists, we are tackling the problem by careful examination of the individual processes that bring the water into the ocean (rain), maintain the fresh pool in the ocean (dynamics), and subsequently release the water to the west or to the deep (dynamics and mixing). If we knew the answers, it wouldn’t be research. The unknown beckons! The combined feelings of curiosity and anticipation –and that our work may result in deeper understanding of nature–, just seem to make this feel like an adventure!
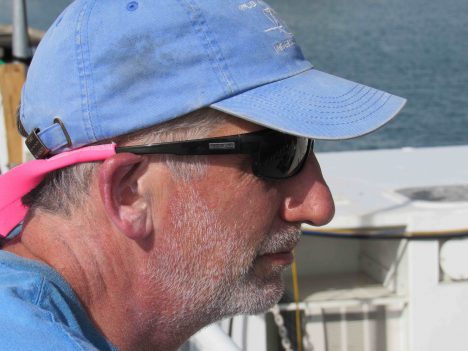
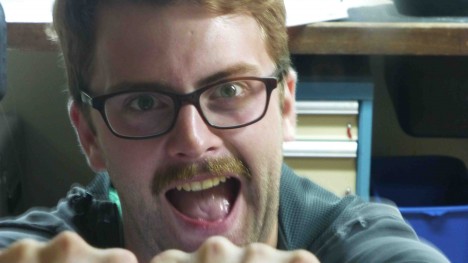
The chief scientist of SPURS-2, Andy Jessup, is ready for action too.
So here we are, all primed for discovery but with five days more to go before being where we really want to work. We are like kids in the back seat of the car asking “are we there yet?” Every piece of gear is at the ready and the teams are completing their training. We are doing dry runs to iron out the deployments of new devices that just have not seen that much action. In later entries, I’ll introduce you to the Sea Snake and the Surface Salinity Profiler and the Lighter-than-Air InfraRed System (LTAIRS), a balloon. These are very new ways of examining the air-sea interaction near the ship. They will be used in conjunction with many of our standard tools – drifters, wavegliders, and moorings, for example. We hope they will lead us to deeper insights about the water cycle at the ocean surface. I will give you a preliminary view of what is discovered during the week-long return voyage to Honolulu at the end of September. For now, we simply prepare for action!
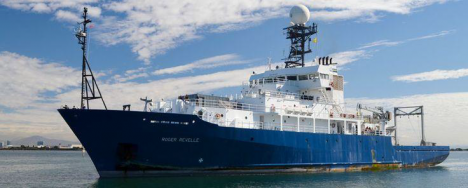
The R/V Revelle.
By Eric Lindstrom
I am writing this while on a plane headed toward Honolulu to join the Research Vessel (R/V) Roger Revelle for six weeks at sea in the Pacific Ocean. It feels great to be heading to sea again. This NASA field campaign will last more than a year, with intense shipboard work near the beginning and end of the year. A web of sensors will be deployed to monitor one oceanic region over an entire year.
As Physical Oceanography Program Scientist at NASA Headquarters for nearly 20 years, my primary job is supporting our satellite missions related to measuring physical characteristics of the ocean (principally, temperature, salinity, sea level, and winds) and supporting the oceanographers that generate knowledge from such data. True understanding requires our fully appreciating the variations of the satellite data in the context of ocean physics. And that requires getting out there and getting wet from time to time!

Your blogger, Eric Lindstrom.
R/V Revelle (home port: Scripps Institution of Oceanography, San Diego, California) leaves Honolulu on 13 August 2016 and returns to Honolulu on 23 September. The central location of the field work is about 8 days voyage southwest of Hawaii at 10N, 125W. Details of the expedition plans are available here. I hope to bring you a steady stream of expedition blog posts between now and the end of September 2016, including why NASA is focusing attention on this particular spot in the open ocean.
Since NASA’s launch in June 2011 of the Aquarius instrument to measure ocean surface salinity from space, the agency has embarked on field campaigns to understand surface salinity in great detail. This work has illuminated new ways of thinking about the ocean’s role in the global water cycle. Our field campaign, dubbed Salinity Processes in the Upper Ocean Regional Study-2 or SPURS-2, is the latest work to link the remote sensing of salinity with all the oceanic and atmospheric processes that control its variation.
The ocean is the primary source of moisture for the atmosphere. Evaporation of water from the sea surface leaves the ocean saltier (more saline). Precipitation over the ocean leaves the ocean fresher (less saline). The global pattern of average salinity at the sea surface approximately represents the balance of evaporation and precipitation at any locale (other factors such as river runoff, ice melt, and ocean motion and mixing complicate the picture). Many details of the interaction between ocean and atmosphere that lead to moisture transfer and signatures in ocean salinity are poorly understood. SPURS-2 is particularly focused on how, in one of the rainiest places on Earth, rainwater enters and impacts the ocean. Through this blog during the coming month, you will hear more about how and why oceanographers focus on such a problem.
The first SPURS campaign, which took place in the North Atlantic Ocean in 2012-2013, focused on the study of ocean processes where evaporation dominates the salinity of the surface ocean. I blogged during the September 2012 work from R/V Knorr. Among other things, we learned that surface salinity variations in that part of the world can be directly connected with precipitation patterns over the nearby continents. I’ll discuss that scientific finding and others in this blog over the coming month.
At the opposite extreme from SPURS-1, SPURS-2 focuses on an oceanic regime where precipitation dominates the salinity characteristics of the surface ocean. The two extremes call for significantly different approaches to measuring and studying the upper ocean. We will uses many of the same tools from SPURS-1 (instrumented moorings, profiling floats, surface drifters, and gliders) but deployed in new and novel ways.
The crew and scientific party on R/V Revelle will be more than 50 in all. As you read future blog entries you will get some sense of what its like for such a group to work closely together for six weeks in the confined space of an oceanographic research vessel. Seasickness? Food? Watches? Sleep? Drama? Boredom? Sea life? You’ll find out soon and get a sense of how some oceanographers go about their work, what technologies are involved, what is discovered, and how all this impacts lives, including yours, and what you might experience if you were aboard.
By Eric Lindstrom
“Ships at a distance have every man’s wish on board.” — Zora Neale Hurston
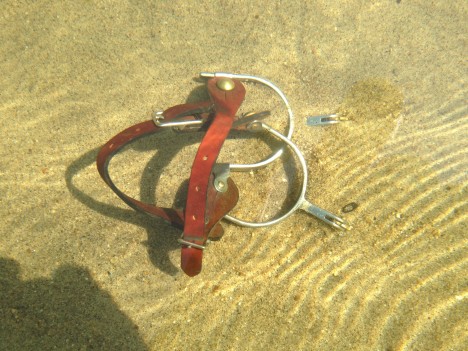
Actual spurs.
So, we are back in port in the Azores Islands of Portugal. Knorr 209-1 was a fabulous voyage and it did feel that we had many a man’s wish on board. Those included wishes for our data collection from all the scientists involved in SPURS and well wishes from all the family members of the expedition and finally the good wishes of you, my blog audience.
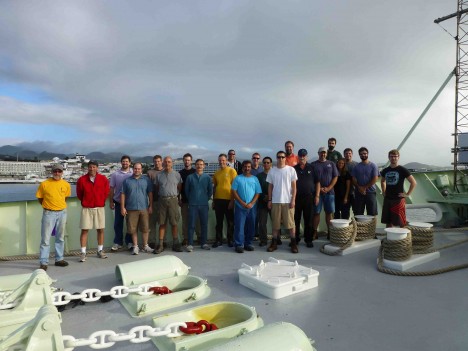
The Knorr SPURS science group.
Thank you all for following my SPURS adventure so far. The saga continues for another year. We have instruments in the water and more expeditions ahead (in March and September 2013). Each expedition will be slightly different in nature but overall working toward the SPURS goal of understanding the surface salinity maximum in the Atlantic and the water cycle on the planet. I’ll be going into a different mode of blogging now, to provide you updates on the science and the observations as the year goes along. With good fortune, I will get back to sea for the final leg of SPURS in September 2013. If you would like another voyage blog from the Sargasso Sea in 2013, let your voices be heard in the comments section below!
After several days of riding a lumpy swell from Tropical Storm Oscar, we were greeted by the magnificent sight of greenery and civilization at Ponta Delgada on the island of São Miguel.
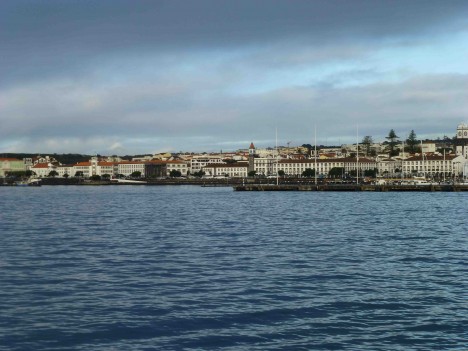
Ponta Delgada’s water front.
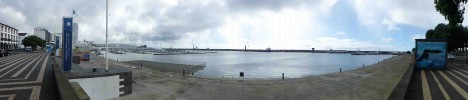
Panorama of Ponta Delgada’s waterfront.
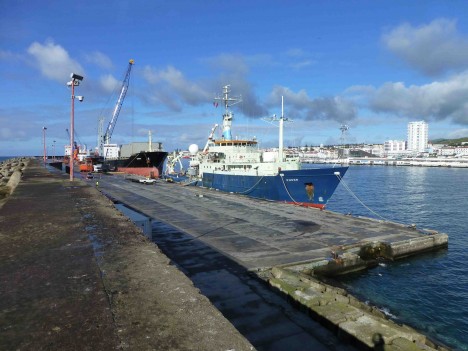
The Knorr in Ponta Delgada.
The expedition was a success scientifically. We got our sensor web in the water for the coming year: three moorings, 25 Argo floats, 18 surface drifters, three Wavegliders, three Seagliders, and a Lagrangian Mixed Layer Float. We completed a wide variety of shipboard deployments: 764 Underway CTD casts, 100 CTD/LADCP Stations, 30 Vertical Microstructure Profiles, 33 AUV missions, three Slocum glider turbulence missions, and a full suite of continuous measurements including ocean velocity profiles, thermosalinograph and meteorology/fluxes. We accomplished the objectives we had laid out for us – deploy the sensor web (week 1), do a control volume survey around the moorings (week 2), and map a mesoscale ocean feature (week 3). We were able to squeeze in some extras, like a 24-hour time series in the saltiest water and pick up a glider from the French expedition in August.
The expedition was a success for NASA and WHOI. We even caught the attention of the International Space Station and had a great 30-minute chat with Commander Sunita Williams about research in sea and space and the strong connections between the space program and oceanography.
The expedition was a success in interagency cooperation. SPURS is led by NASA, but has enormously important contributions from NSF, NOAA, and the Office of Naval Research. It takes a village to put on a good oceanographic process study!
I created a “SPURS Illustrated Campaign Summary” from our Knorr expedition. I will make it available to all of you as part of a future post. There will also be movies available from the Space Station call and from the expedition, which are still in the editing process.
Your questions and comments on SPURS are always welcome. Use the comments section of any of the posts and I will get the message. Your interest and curiosity provides directions for future blogs and helps me put into words some of the technical aspects of SPURS that may not be fully understood.
Thanks you all for again following along on our Knorr SPURS expedition. There is much more to come, so stay tuned!
By Eric Lindstrom
Channel fever: an unusual excitement or restlessness common among a ship’s crew when the ship nears port after a voyage (The term probably refers to the English Channel, between southern England and northern France.)
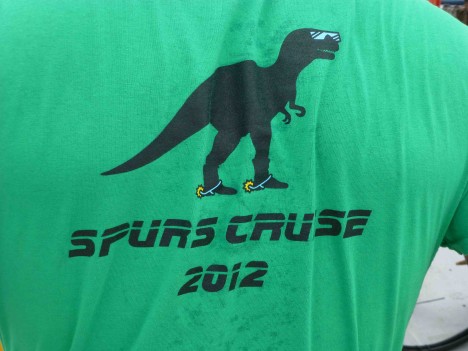
Knorr-crew T-shirt for SPURS – there is no significance to the dinosaur as far as anyone knows.
Now that all the oceanography is done, it’s four days of steaming to the Azores. During that time there is still plenty to do. A shipping container is being prepared for freight to Woods Hole. People are comparing notes on their flights out of the Azores and taking guesses at what time we will be getting off the ship.
We are writing expedition reports (something your blogger has pretty well in hand!). I took over 2,000 pictures during the voyage and wrote 32 blog posts. I plan on finishing this trip with an epilogue as next posting. Then, after I return home, you will be able to access my presentation entitled “An Illustrated SPURS Campaign Summary,” which captures the entire expedition accomplishments in pictures. Remember too, if you have become a fan of SPURS, that there are more expeditions in 2013 and a sensor web in the water until next October. I will be blogging periodically to keep you up-to-date on developments and findings. For now, I need a rest from blogging. It feels like channel fever!
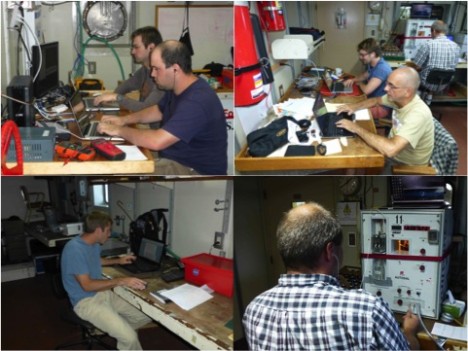
SPURS members writing reports.
Personal gear has to be packed and cabins cleaned. That leaves people with time to think about what they will be doing in the Azores or when they get home. People are laughing more and joking more. Sometimes, with all this activity, happiness emerges as channel fever.
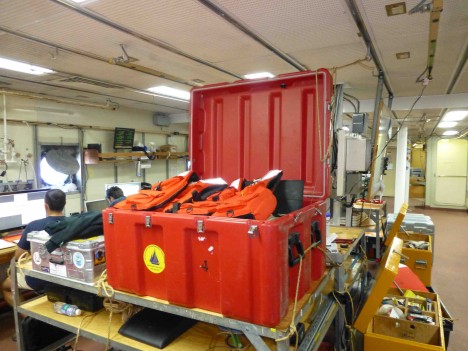
Our bags are packed.
Does Julius have channel fever?
Maybe it’s the transformation of the ship – from being loaded down with gear to empty cleanliness. There are empty reels and baskets indicating our success at deploying moorings. The CTD master control station, hub of so much activity for the past weeks, is now quiet. Everywhere you look, it’s looking like its over. It’s enough to bring on channel fever.
The reels are empty now.
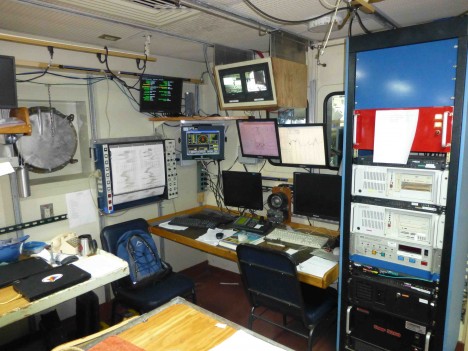
All the CTD stations are over.
We are taking stock at what we have done. We deployed three moorings, 100 CTD stations, 764 Underway CTD casts, 25 Argo floats, 18 surface drifters and a Lagrangian float. We left three Wavegliders and three Seagliders patrolling the seas near the moorings. The salinity field over a 120×120 mile piece of ocean was pretty well mapped. We have gigabytes of data to sift through and analyze. And we are pleased. We are weary. And we know when we see the Azores we are nearly home. That feels like channel fever!
We leave the lovely blue Sargasso Sea in our wake, but we can feel the harbor channel in Ponta Delgada, Azores in our future. We feel the accomplishment of the mission, and the promise of home. That is channel fever.
By Eric Lindstrom
When on land, an oceanography brain usually associates the term ocean motion with the movement of seawater in the form of ocean currents.
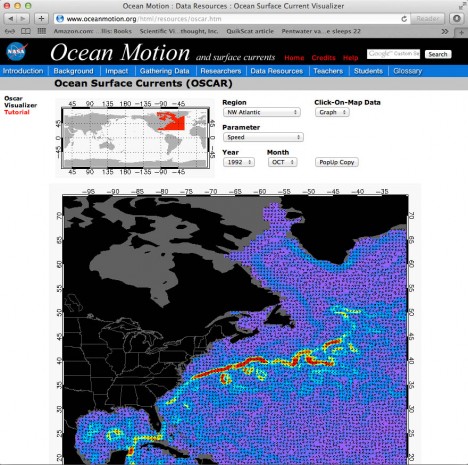
Depictions of ocean surface currents derived from satellite data can be viewed at NASA’s OceanMotion.org web site.
However, when actually on the ocean, the biggest signal for our oceanography brains to cope with is the role of ocean motion in the pitch and roll of the ship (due to wind seas and swell). OK, so I am telling you that feelings matter. If you have ever been seasick, then you know what I am talking about!
So, if you spend 33 days on a small vessel at sea, you get a great appreciation of ship motion. There are actual six axes of motion of two kinds (lateral and rotational). Laterally there are surge (fore and aft), sway (port and starboard), and heave (up and down). Rotation also occurs around three axes that are more commonly discussed (maybe because we feel them more?). They are pitch (around port to starboard axis), roll (around bow to stern axis), and yaw (around the vertical axis). We can definitely feel all these motions but some do matter to our feelings more than others. Perhaps the most noticeable ones for land-loving creatures like humans are heave (the accelerating elevator feeling) and rotational motions largely absent in our daily lives (pitch and roll). Together, these can be combined into a kind of perfect storm of corkscrew-like motion that weakens the resolve of even veteran mariners. Lucky for us, the SPURS cruise has been pretty calm and no one has been suffering from seasickness.
By far the most noticeable and everyday motions on a ship are that of pitch and roll. Pitch is especially noticeable when navigating into a swell or into the wind. Going downwind or in the direction of the swell is much more gentle pitch-wise (sailors are wished good luck by offering them “fair winds and following seas”). Roll is especially diabolic when one is navigating nearly parallel with the troughs and crests of the swell. This is something you DO NOT do when the seas are large because you may very well roll over (not good; do not try this at home!). Faced with large seas, the safest course is to ride the weather facing into the wind and waves (and just suffer the horrible pitching).
Sorry to go on for so long about the ship motion, but its an ever present partner to our expedition and you deserve a share for sticking with us!
You may be wondering about the difference of wind seas and swell. Good question! Swell and wind seas are both manifestations of surface gravity waves. Swell is caused by wind forcing of the ocean in some remote location. Wind seas are the jumble of more disorganized waves that come up directly under and within a wind event. There has been a good swell running in the SPURS region for the last two weeks due to Hurricane Nadine hundreds of miles away. On top of the swell, the wind waves cause whitecaps and noticeable roughness above wind speeds of about 10 miles per hour.
Well, on Knorr we are not out here to study wind waves (just feel them). I should get on to talking a little about ocean surface currents. Our main focus is the surface salinity and how it gets to be the way it is. Ocean currents moving patches of different salinity around is one key factor in accounting for salinity changes at any site in the ocean (we call this advection of salinity). The Ocean Motion web site produced for the NASA Physical Oceanography Program has a wealth of background information on ocean surface currents. Here in SPURS we believe there are only weak average currents (a year of moored measurements will determine that for sure), but that the wind-forced transient currents play an important role in the local water cycle (and surface salinity values). One obvious reason to think this is that the salinity maximum here is hundreds of miles north of the maximum in evaporation minus precipitation. The simplest explanation for this displacement is the northward movement of surface waters induced by the trade winds. On average, upper ocean waters forced by wind move 90 degrees to the right of the wind in the northern hemisphere so the easterlies of the trades give the ocean waters a push toward the north. This hypothesis will be tested by the SPURS observations over the coming year.
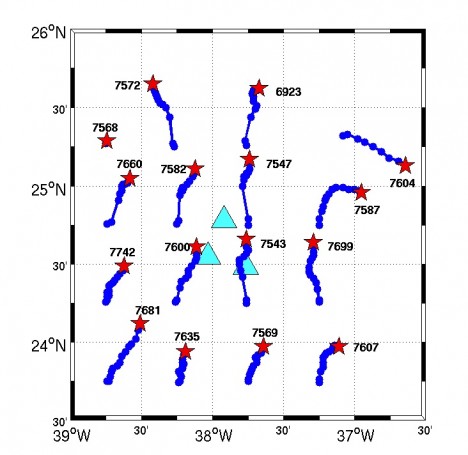
SPURS Argo float locations over time indicating flow at their parking depth of 3,300 ft. (Courtesy of Jessica Anderson.)
Out here it is extraordinarily difficult to fully appreciate the complexity of the currents around us in the upper ocean. The average current is small, but there are eddies and fronts with stronger flows around us that we observe sporadically as we move around from hour to hour.
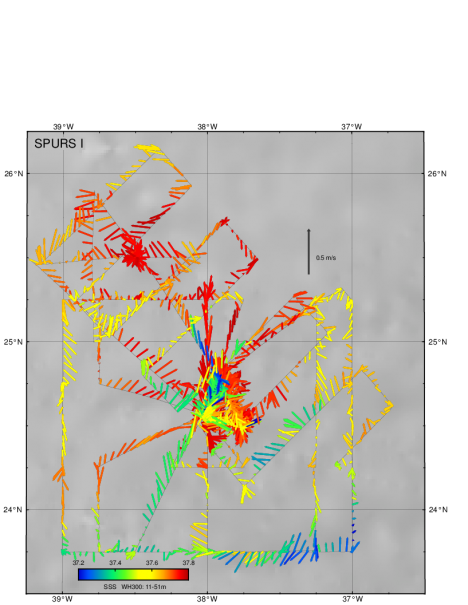
Map of current vectors in the upper 167 feet (51m) along our track color coded by the surface salinity. (Courtesy of Phil Mele.)
We will only be able to make sense of our hour-to-hour estimates of ocean motion once we return to shore and can fully integrate the satellite and model information into the picture. We obtain details profiles of current vectors on each station but honestly have a tough time “connecting the dots” in real-time. It will take a good bit of analysis to understand the complex flow field.
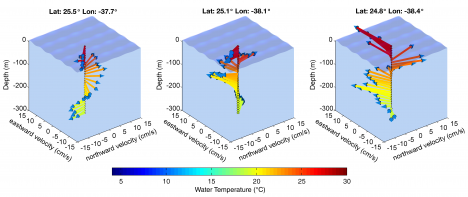
Vertical variation of velocity vectors at three adjacent stations on the same day. (Courtesy of Julian Shanze.)
It feels a little like mapping Washington, D.C. in one day, from your car, driving around with a simple still camera. We get some great snapshots, but we can only place them in a larger context when be have full access to maps, satellite images, and historical records (stuff most people cannot examine in their car while driving around!)
As in rest of life, context is important in oceanography. We strive for it, but as with most things, the perspective of hindsight provides the best context. Feeling seasick is no exception! It’s so awful in the moment, and such a trifle in the glory of the entire expedition.
