Going to sea slows one down from the hectic sprint of modern city life and car travel. We travel slowly (~12 mph) over the vast Pacific Ocean. It is a five-day journey to get to our “office” in the Inter-Tropical Convergence Zone (ITCZ). The “work day” will change from 8 hours per day to 24 hours per day. There are no weekdays and weekends, only workdays and off-hours. As your blogger, I look into all the projects aboard ship and fill my day with writing, photographing action, and fact-finding for my reporting. I aim to provide a new blog four days-per-week (Tuesday-Friday). If needed I serve on a shift where extra hands are required.
A highlight of our departure from San Diego was being greeted by a large pod of small toothed-whales (porpoise/dolphin family). They seemed as curious of the ship as we were curious of them. We had slowed the ship as we passed the Coronado Island group (off northern Baja, Mexico) to deploy a 42-foot boom off the starboard bow. This is the support structure for Julian Schanze’s “salinity snake” that provides a “clean” intake of surface water outside the wake of the ship. I imagine the whales had never seen such an operation before!
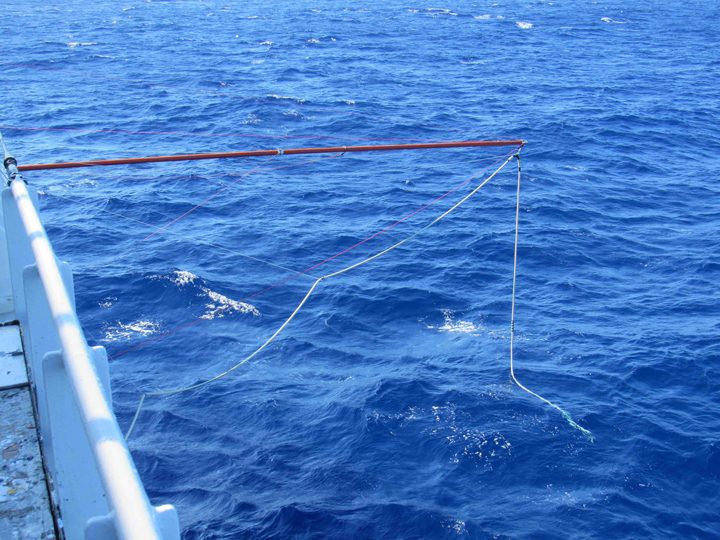
The 42-foot boom for the salinity snake.
The first two days at sea have been calm and sunny. This has been great for the newbies to get their sea legs. As far as I know no one has suffered severe sea sickness.
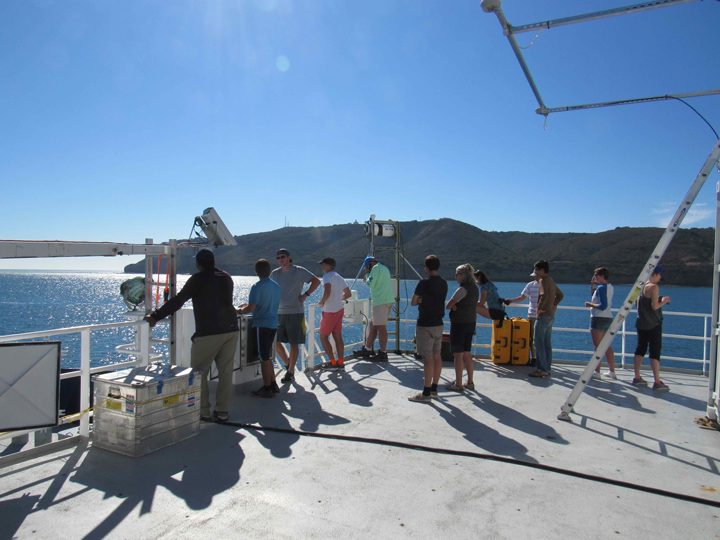
In the midst of our five-day commute we stop or slow down for training on occasion. Everyone needs to learn or refresh their knowledge on how instruments are deployed from the ship and safely recovered. This is the time to make sure all gear and personnel are ready for action. I will tell you more about the instruments and projects over the next month. Shipboard life is best when everyone is busy and every project is assisted to full success. During these initial days at sea there is much “cross-training,” you come to sea for one project, but you immediately train to assist on other projects.
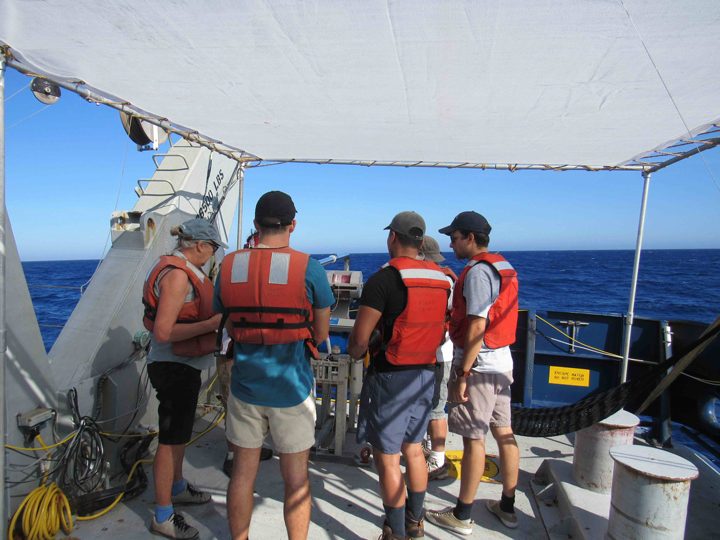
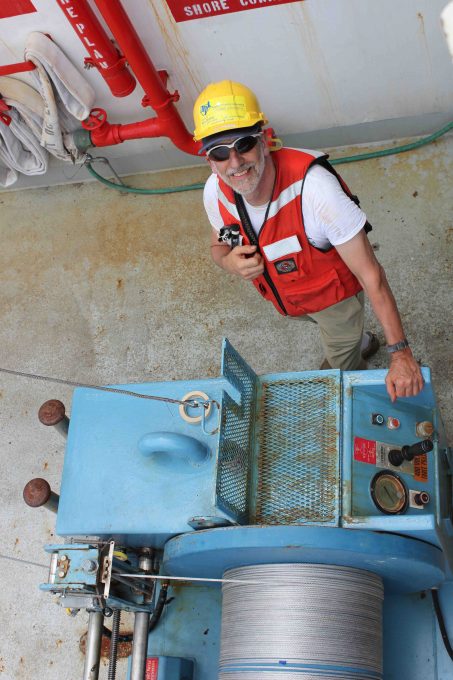
Training class at the underway CTD winch.
As we move slowly south to the tropics we also have some small assignments to accomplish on behalf of the oceanographic community. We will deploy some Argo floats along the 125W meridian. These temperature and salinity profiling devices join a global array of nearly 4000 floats that monitor the upper 2000m of the ocean.
We know our 24/7 work begins when we reach 11N, 125W and begin the process of recovering the NOAA mooring that has been there for the last 13 months. There are three moorings in the SPURS-2 array and all will be recovered on this voyage. Generally, these moorings become teeming islands of life in the open ocean environment, attracting their own ecosystem of fish. So, fishing gear will also be at the ready and we can expect tuna and mahi-mahi for dinner the day of a mooring recovery.
Finally, it looks like there will be some Halloween celebration aboard R/V Revelle. The Captain has brought pumpkins for a carving contest. I hear that some people have costumes at the ready. I am sure some unique nautical and oceanographic twists can be brought to Halloween. We shall see. Never underestimate the imagination of people confined to a ship for five weeks!
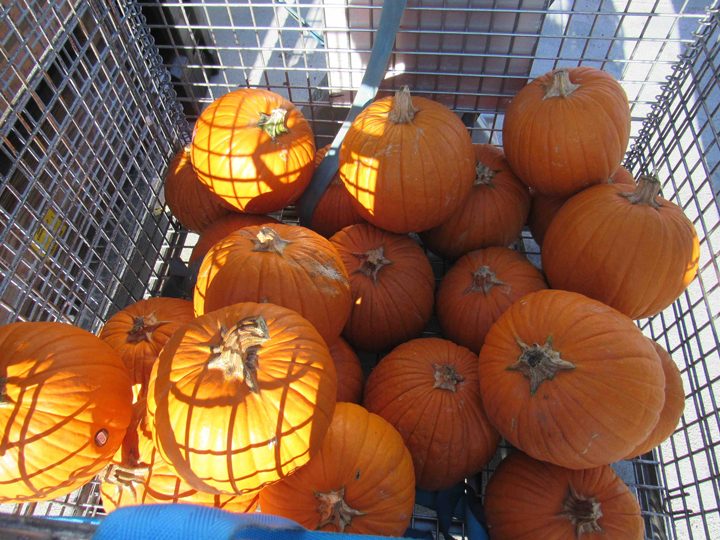
Pumpkins at the ready for the Halloween pumpkin carving contest.
Yesterday, Monday October 16th, I joined the Research Vessel (R/V) Roger Revelle for five weeks at sea in the Pacific Ocean. It feels great to be heading to sea again. This NASA field campaign has lasted more than a year, with intense shipboard work starting in August 2016 and finishing with this voyage in October-November 2017. A web of sensors has been deployed to monitor one oceanic region over an entire year. The primary goal of this voyage is to provide one last intense snapshot of the ocean and to recover moorings and other gear deployed over the last year.
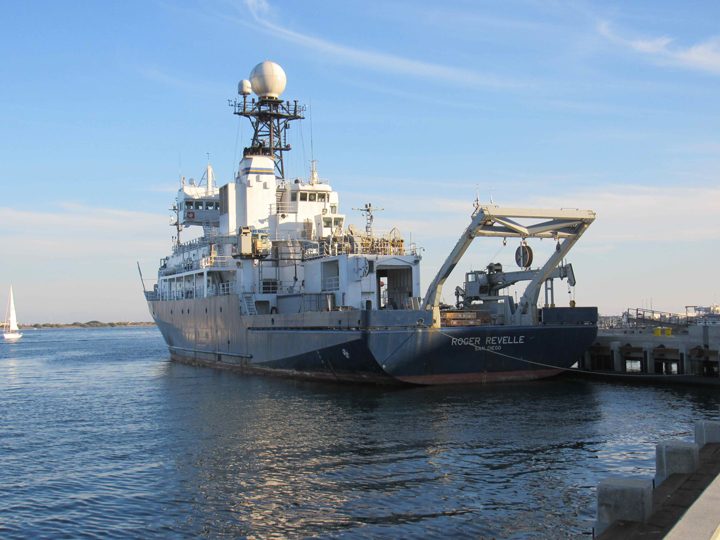
The R/V Roger Revelle in San Diego just before departure.
Scientists take one last look at San Diego as we depart.
The history of SPURS, from SPURS-1 in 2012-13 in the North Atlantic Ocean to SPURS-2 in the eastern tropical Pacific Ocean is captured in prior blogs to this site.
As Physical Oceanography Program Scientist at NASA Headquarters for the last 20 years, my primary job is supporting our satellite missions related to measuring physical characteristics of the ocean (principally, temperature, salinity, sea level, and winds) and supporting the oceanographers that generate knowledge from such data. True understanding requires our fully appreciating the variations of the satellite data in the context of ocean physics. That requires getting out there and getting wet from time to time.
R/V Revelle (home port – Scripps Institution of Oceanography, San Diego, CA) departed San Diego on 16 October 2017 and returns to San Diego on 17 November. The central location of the field work is about 5 days voyage southwest of San Diego at 10N, 125W. Details of the expedition plans are available here. I hope to bring you a steady stream of expedition blogs between now and mid-November 2017, including why NASA is focusing attention on this particular spot in the open ocean.
Since NASA’s launch in June 2011 of the Aquarius instrument to measure ocean surface salinity from space, the agency has embarked on field campaigns to understand surface salinity in great detail. This work has illuminated new ways of thinking about the ocean’s role in the global water cycle. SPURS-2 is the latest work to link the remote sensing of salinity with all the oceanic and atmospheric processes that control its variation.
The ocean is the primary source of moisture for the atmosphere. Evaporation of water from the sea surface leaves the ocean saltier (more saline). Precipitation over the ocean leaves the ocean fresher (less saline). The global pattern of average salinity at the sea surface approximately represents the balance of evaporation and precipitation at any locale (other factors such as river runoff, ice melt, and ocean motion and mixing complicate the picture). Many details of the interaction between ocean and atmosphere that lead to moisture transfer and signatures in ocean salinity are poorly understood. SPURS-2 is particularly focused on how, in one of the rainiest places on Earth, rainwater enters and impacts the ocean. During the blog in the coming month, you will hear more about how and why oceanographers focus on such a problem.
In 2012-2013 SPURS-1 in the North Atlantic Ocean focused study of ocean processes where evaporation dominates the salinity of the surface ocean. I blogged during the September 2012 work from R/V Knorr. Among other things, we learned that surface salinity variations in that part of the world can be directly connected with precipitation patterns over the nearby continents.
At the opposite extreme from SPURS-1, SPURS-2 focuses on an oceanic regime where precipitation dominates the salinity characteristics of the surface ocean. The two extremes call for significantly different approaches to measuring and studying the upper ocean. We use many of the same tools from SPURS-1 (instrumented moorings, profiling floats, surface drifters, and gliders) but deployed in new and novel ways.
The crew and scientific party on R/V Revelle almost 50 in all. As you read future blog entries you will get some sense of what its like for such a group to work closely together for five weeks in the confined space of an oceanographic research vessel. Seasickness? Food? Watches? Sleep? Drama? Boredom? Sea life?
So, if I get this right, and you continue to follow this blog, you will get a sense of how some oceanographers go about their work, what technologies are involved, what is discovered, and how all this impacts lives, including yours, and what you might experience if you were aboard. I’ll do my best to get this right!
Eric Lindstrom, physical oceanography program scientist at NASA Headquarters, and blogger for the SPURS-2 campaign.
By Eric Lindstrom

Science party on the R/V Revelle.
Salinity Processes in the Upper-ocean Regional Study #2 is underway for the next year. Lots of science remains to be done, so it is very early to be writing an epilogue! However, the first big field campaign with a large research ship is completed and it seems right to sum up some of the operational conundrums be articulated as we plan for further operations with the Lady Amber over the coming year and the R/V Thomas Thompson in October 2017.
Conundrum#1: Finding “Just Right”
Like Goldilocks, the R/V Revelle team went in search of very special conditions. Conceptually, SPURS-2 is built around observing all the processes that lead to rainfall mixing into the ocean and the resulting large-scale variations of salinity that we detect from space.
One of the concepts is that rain falling into the ocean will reveal itself as low salinity “lenses” at the surface than mix into the ocean over time. Well, not unexpectedly, if the wind is anything but calm, the rain mixes quickly into the upper ocean mixed layer and cannot be seen as a lens – only tiny variations of salinity that build up over time. In order to see the strong signal of a lens of fresher water, one needs to observe the ocean during calm winds and rain. The difficulty with this is finding the simultaneous occurrence of rain and low wind conditions in a vast ocean with a platform with a top speed of about 12mph. During SPURS-2, it became apparent that the regions with more certain rainfall (those large cells and fronts visible from space) were also stormier and windier than ideal for measurement. In areas of calm winds, there are patches of rainfall but they don’t seem predictable (“It’s the tropics” says Jim Edson!)
So, the perfect observing condition for us were more difficult to find than we expected ahead of time. Probably no surprise that mother nature throws a great curve ball! In the end, we targeted the low-wind regime by following the surface wind forecasts and hoped to run into rain (which we did). After a few weeks at sea we learned and prevailed.
Conundrum#2: Risk
It is always tricky to balance risk and reward. Equipment deployed at sea is always at risk of loss. The reward for taking the risk is valuable data to expand our scientific understanding. We had several occasions to examine and balance these risks and rewards.
For example, the CODE drifter was an instrument that was modified ashore by addition of a salinity sensor but not tested prior to shipping five of them to R/V Revelle. In the parlance of oceanography, drifters float at the surface, while floats are neutrally buoyant and can sink and return to the surface to transmit profiles of the ocean. In a test deployment of one drifter, it appeared to stay at the surface (just), but when released from the ship it simply sank, never to be seen again! Not the behavior you like to see in a drifter! So, although modification to its four sister drifters were undertaken, it was eventually decided that these drifters were not ready for prime time. Lucky we tested one! The small experiment with CODE drifters will have to wait until next year.
The Lighter-Than-Air InfraRed System (LTAIRS) balloon deployments were quite complicated by variations in the balloon lift during rain and by variations in wind speed and direction. Dipping the balloon payload (expensive camera) in the water is a big risk. However, the data – infrared movies of the sea surface skin temperature in rain – are super interesting and scientifically novel. We learned a lot about making waterproof payloads, the best material and size of balloons, and weather characteristics unfavorable for ballooning. This knowledge was hard won with near misses and close calls and exhaustion of the helium supply. We all think it cost our chief scientist Andy Jessup some new gray hairs! However, the grin on his face when he shows you the data is priceless. Well worth the drama and risk in the process. LTAIRS work will go more smoothly next year on the R/V Thompson and the team will likely make some interesting discoveries about the thermal properties of the sea surface during rain.
Final Thoughts
It was a great pleasure to work with and support the scientists and crew on R/V Revelle. It is a capable ship and crew and the science party was very well prepared for the challenges and risks. Morale was high during the entire voyage – maintained by a busy schedule, everyone pitching in, and good food and fellowship. The teams from University of Washington Applied Physics Laboratory, University of Connecticut, Woods Hole Oceanographic, and Scripps Institution of Oceanography came to R/V Revelle super-prepared and ready for action. The schooner, Lady Amber, will be making periodic voyages during the coming year to service and renew out drifting (Lagrangian) experiment. As always, your blogger enjoyed every minute of our six weeks at sea. Its wonderful to watch scientists and engineers face the challenges of understanding the ocean while in its grip. I’ll keep you posted on developments during the coming year!
By Eric Lindstrom
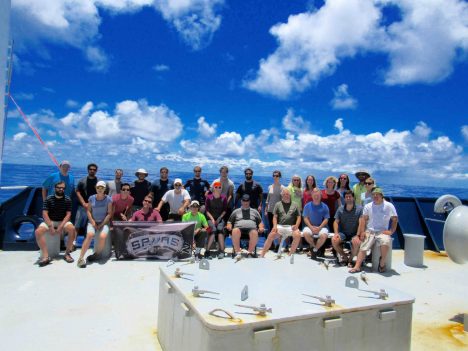
The SPURS-2 science party on the R/V Revelle.
The R/V Revelle expedition has been the opening round in a yearlong effort to understand the upper ocean physical processes in the eastern tropical Pacific. We put moorings in place to collect a time series of upper ocean measurements over the year. We launched the first round of Lagrangian drifters and floats. Lady Amber will be servicing these assets at regular intervals and launching new drifters and floats into the array.
It is with some caution and caveats that I try to summarize our findings from the last six weeks of effort. Ideas are still young and data processing is still in its early phases. Only data from shipboard measurements are complete but still require careful screening, calibration, and validation. Despite the caveats, some of our questions and challenges are much clearer now than before we left Honolulu.
The Conductivity, Temperature and Depth (CTD) work, led by Janet Sprintall, charting the variations of temperature, salinity, and oxygen in the upper ocean, revealed some quite interesting features. Janet and her team will be looking at salinity-compensated temperature inversions in the upper ocean that seem to be closely associated with the edges of the east Pacific fresh pool.
Jim Edson and Raymond Graham have a wonderful three-week time series of 80 atmospheric profiles from their radiosonde launches via weather balloons every six hours. Ray will be working these up for his MS degree research project, so I won’t steal any of his thunder. Needless to say, we all think he will have an awesome project because it is such a rich data set!
Ray also assembled all the rainfall data daily and found that during SPURS-2 we had about 10 inches of rainfall in our 3 weeks on site near 10N, 125W.
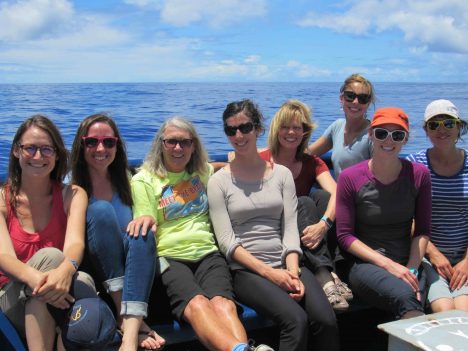
The women of SPURS-2.
Carol Anne Clayson has collected more than 1,500 air-sea flux estimates (20-minute averages) to be analyzed in conjunction with the upper ocean data sets from numerous platforms. She has already been able to run her mixed layer model using initial conditions from early in the expedition and the raw flux estimates to compare with later expedition measurements. It gives us great optimism for new discoveries out of this data set.
Michael Reynolds brought the Remote Ocean Surface Radiometer (ROSR, from Andy Jessup) and the Infrared Sea surface temperature Autonomous Radiometer (ISAR, from Carol Anne Clayson) to SPURS-2 to examine the surface skin temperature of the ocean during rainfall. Michael successfully engineered the instruments for this purpose (normally a fair weather measurement). He has put together some exciting compilations of data comparing his measurements with other temperature measurements made on the ship.
Julian Schanze from Earth & Space Research in Seattle is the man with the Salinity Snake. It has provided a virtually continuous record of the salinity in the top 2 inches of the water column. Julian has identified nearly 40 fresh lenses where salinity at the surface is significantly lower than ship intakes at 6.5 feet (2 meters), 9.8 feet (3 meters), and 16.4 feet (5 meters depth). These measurements, when further combined with the Surface Salinity Profiler data from the upper 3.3 feet (1 meter), will constitute a rich data set for analysis of fresh water lenses induced by rainfall.
Ben Hodges from Woods Hole Oceanographic Institution (WHOI) has been following the three Wavegliders deployed near the SPURS-2 central mooring. They have salinity sensors near the surface and at 19.7 feet (6 meters) depth and will be hard at work over the entire coming year. One of the Wavegliders had an experimental package of sensors on it called the salinity “Rake” with sensors at every 3.9 inches (10 centimeters) depth from the surface to 3.3 feet. The Rake, invented by Raymond Schmitt at WHOI, recorded data internally and was recovered after a few days of operation to check functionality (it has not been to sea before). The data is amazing; but it only lasted one day before mechanical failure and short circuits took it out of commission. However, that vertical resolution and the interesting features that it saw were a new peek at the ocean surface salinity that really has not been seen before. More engineering work needs to be done at home before it can be re-deployed. The team at Woods Hole will be highly motivated to get this instrument to sea again soon, based on what we saw in just one day. The Waveglider was re-deployed without the Rake.
The Surface Salinity Profiler (SSP) team led by Kyla Drushka has a very successful run with 18 deployments (not counting various tests and trials). The data is still being assembled and examined but, like the Rake measurements, the SSP focus on the top 1 m of the ocean is going to provide new insights on ocean processes. The SSP has the added benefit of microstructure probes to provide information on turbulent mixing. The biggest difference in salinity seen over 3.3 feet by SSP was 9 units!
Eric Chan had the rare opportunity to focus a study on the air-sea exchange of carbon dioxide during rain events. The simultaneous analysis of his gas exchange data with the salinity snake and meteorological data will be enlightening. Certainly the raw carbon dioxide data show the dip in pCO2 expected during rain events when the salinity drops.
Andy Jessup, voyage chief scientist, at work.
Finally, I’d like to heap praise on our chief scientist, Andy Jessup, who managed execution of all the projects and requirements with great skill and diplomacy. The whole SPURS-2 team owes Andy a great deal for making the R/V Revelle expedition such a successful initiation of the SPURS-2 Program.
Next blog post: PORT!
By Eric Lindstrom
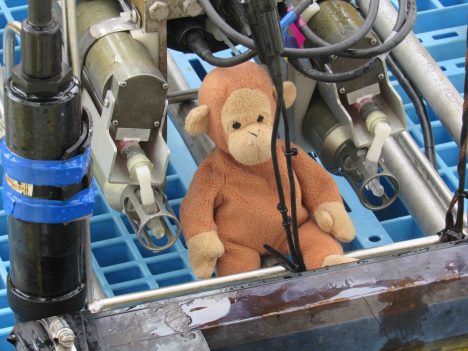
Our mixed-up Monkey looks everywhere for microstructure probes.
One of the challenges of oceanography (and many other sciences) is telling a coherent story of the environment across a vast space of space and time scales. For example, cosmologists tell the story of the universe from subatomic particles to the breath of the visible universe and from first nanoseconds of the big bang to billions of light years.
For SPURS-2, mixing is obviously an important factor in telling the story of how rainwater combines with seawater to bring about the east Pacific fresh pool that we see from space. That mixing primarily happens in the upper ocean at scales of centimeters, where turbulence is caused by phenomena such as wave breaking, current shears, convection in unstable layers, and the rain itself hitting the sea surface. In order to understand the big picture, we need to estimate the magnitude and location of the centimeter scale turbulent mixing.
Over many decades oceanographers have become quite adept at estimating mixing from measurements of centimeter scale temperature, salinity, and velocity variations – otherwise known as microstructure. Now, along with our standard instruments for measuring temperature and salinity, we also deploy microstructure probes – very fast sampling sensors of ocean variables.
It is beyond the scope of this blog to explain how microstructure measurements are transformed into ocean mixing estimates, but it is one of the more helpful developments in modern oceanography.
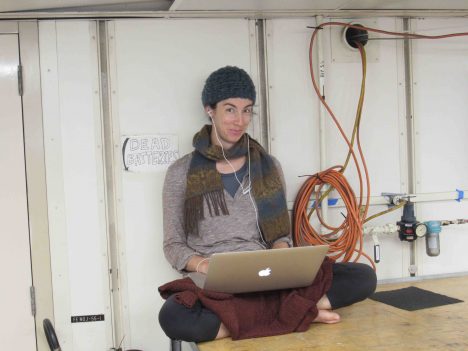
Caitlin Whalen, working on her review article for the Bulletin of the American Meteorological Society.
Caitlin Whalen of the University of Washington Applied Physics Laboratory (APL) is an expert in ocean mixing. While on the SPURS-2 expedition, she has contributed to a review paper on the subject for the Bulletin of the American Meteorological Society. During SPURS-2 she oversaw the addition of the Seagliders to the Lagrangian experiment.
The Seagliders will provide us with a picture of how the turbulence in the SPURS-2 region varies at deeper depths and over a longer time period than we will learn form our ship-based measurements. Over the next six months the Seagliders will repeatedly travel between the ocean surface and a depth of one kilometer, collecting data during each trip. From this data we will be able to determine how the turbulence in the ocean varies with depth and how it is related to other events such as heavy rain and the continuously changing density patterns of the water. Knowing where and when turbulence occurs will help us understand how the fresh rainwater eventually mixes deep into the salty ocean.
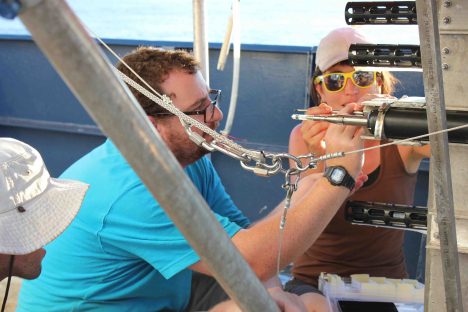
Dan Clark and Kyla Drushka of APL make final adjustments of the SSP microstructure probes.
Kyla Drushka and Suneil Iyer, also from APL, have deployed microstructure probes on the Surface Salinity Profiler (SSP). They will try to determine, from these measurements and the vertical structure of salinity in the upper meter of the ocean, how quickly rain-formed low salinity lenses are mixed into the upper ocean during individual events. Their big challenge during SPURS-2 has been to get a snapshot of salinity lenses at various stages of their lifetime. Being in the right place (low wind conditions) at the right time (just as rain begins to fall) with the right gear (SSP) actually deployed has been challenging. Still, I am sure we have collected more such data this expedition than previously existed. Finally enough data to find great exemplars for discussion in the scientific community! This is a wonderfully “fresh” topic for a graduate student like Suneil to tackle.
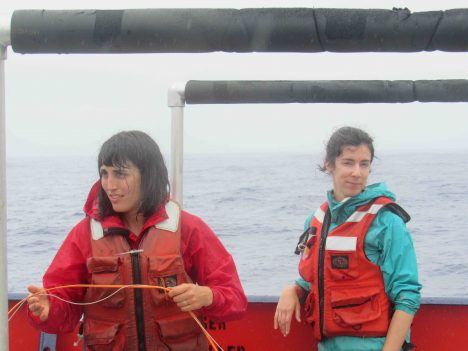
Kyla Drushka and Caitlin Whalen from APL, hard at work in the rain.
Just about everyone doing analysis of SPURS-2 data will use estimates of mixing in some way or another in the telling of their part of the story of salinity in the eastern tropical Pacific. It will be part of any salinity budget calculations and used in the description of salinity fronts. It will be an essential part of the story in explaining the seasonal patterns of salinity we see from space. The story of the smallest scales in the ocean meets up with the story of the planet as seen from space!
