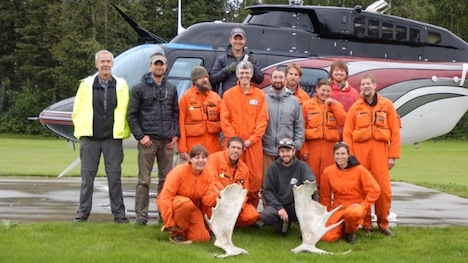
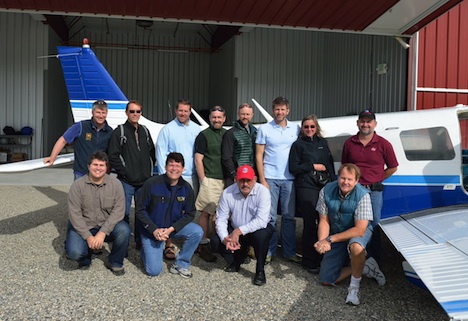
The USFS Forest Inventory & Analysis (FIA) crew before departing Delta Junction by helicopter to sample a remote field plot. Front Row: Katie Rigby, Misha Yatskov, Dan Irvine, Ashley Lehman; 2nd Row: Ken Winterberger, Chad Oukrop, Eric Straley, Seth Ayotte, Brendt Mueller, Michelle Hansen, Warren Childe, Ray Koleser; and 3rd Row: Pilot Josh Toal, Matt O’Driscoll, Warren Childe.
The Alaska G-LiHT Campaign is a partnership between scientists and NASA and the U.S. Forest Service (USFS). The design for the research is to link field measurements of forest structure, vegetation composition, and soils with airborne remote sensing data from G-LiHT. At this stage of the mission, the flight planning looks a little like a technicolor version of Pac-Man. Pink lines on the flight GPS units intersect points showing the location of ground measurements. In flight, the goal is to gobble as many of these dots as possible. Sometimes you wonder if the familiar “wocka wocka” noise of the old video game can be heard above the noise of the engine.
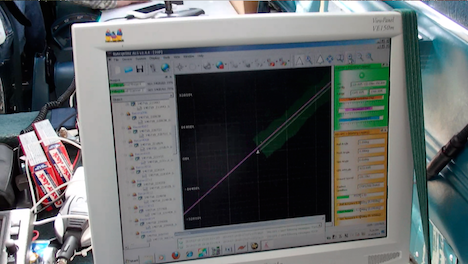
G-LiHT flight computer during data acquisition. The swath of lidar data appears green, the flight line pink, and real-time information on ranging distance and laser returns.
NASA and USFS partners have also worked hard to connect G-LiHT flights to other research activities in the valley. Within NASA, overlapping G-LiHT and MABEL flights are planned to characterize ice cover high in the Alaska Range west of Denali and across the Nebesna Glacier in Wrangell-St. Elias. Overlapping coverage is also planned with two hyperspectral missions from USGS (PI Ray Kokaly) and the U.S. Army Corps of Engineers (PI Steve Newman), offering the chance to compare different hyperspectral imaging systems and share ground calibration data.
G-LiHT flights will also cover a range of existing forest inventory plots collected by collaborators at the Department of Defense lands (Dan Rees), National Park Service (Carl Roland, Colin Malone), and the Alaska Department of Natural Resources (Chris Maisch, Doug Hanson). A dense network of flight lines is planned in and around the Bonanza Creek Experimental Forest and the Caribou Poker Creek Research Watershed to cover research plots established by scientists at the University of Alaska Fairbanks (Jaime Hollingsworth, Glenn Juday, and David McGuire, among others).
Further afield, still more dots on the flight plan represent long-term studies of forest recovery from fire. More than 40 percent of the watershed has burned since 1950, and G-LiHT will sample about 80 percent of large wildfires that have burned over the past 60 years. Record rainfall this summer has kept fire activity in check, but G-LiHT data from 2014 will also provide a benchmark for assessing changes from fires in coming years. Each of these intersecting lines and points represents a new opportunity for collaboration with the Alaska G-LiHT Campaign in 2014.
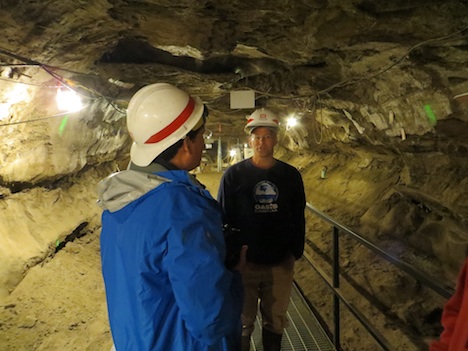
G-LiHT PI Bruce Cook talks with Tom Douglas (US Army Corps of Engineers) during a tour of the Permafrost Tunnel Research Facility before a joint field visit to the Cold Regions Research and Engineering Laboratory (CRREL) field sites outside Fairbanks, Alaska.
Text by Robert Foster
City College of New York – CUNY
Here we are ending the 4th full day aboard the R/V Endeavor, and I can hardly believe it! Time really does fly when you’re having fun! Amid the rush of running cables, installing sensors, learning new and exciting science and making new friends, I couldn’t be happier. I am a 3rd year Ph.D student in the Electrical Engineering department of The City College of New York, and through extremely fortunate circumstance I found myself working in the Optical Remote Sensing Lab of NOAA-CREST.
Life aboard the R/V Endeavor is both exhilarating and exhausting! During our safety briefing I jumped into an immersion “Gumby” suit for the first time, giving my colleagues a good laugh as I tried to close the face flap with my lobster claw gloves.
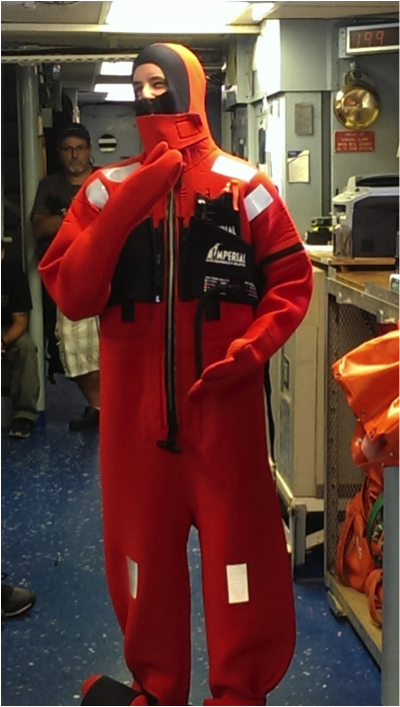
I’m trying on the immersion suit for the first time and posing “mannequin-style” for the safety briefing Friday morning. Photo courtesy of Ivona Cetinic, University of Maine
Although we’re currently 18 miles off the shore of New Hampshire, we’ve already had several visitors!
On Saturday morning we spotted a pod of whales in the distance. They were too far away to photograph, but we could clearly make out their sprays and tailfins when they dove.
And the dolphins! This was the best part. Just a couple hours after leaving port on Friday the entire science team was on deck learning how to deploy the CTD when a pod of dolphins started leaping out of the water not 20 feet from the ship! It was almost as if they wanted to see us off on our journey! We managed to snap some really fantastic photos.
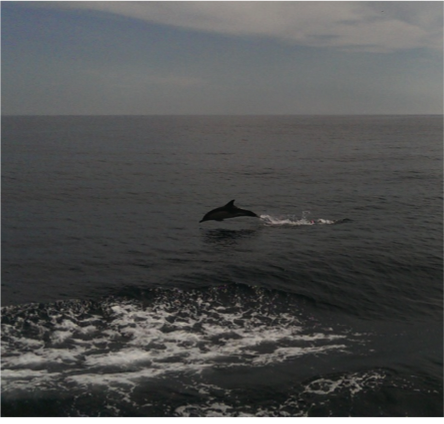
Dolphins jumping out of the water to see us off! Photo courtesy of Ivona Cetinic, University of Maine
Slightly more numerous than dolphins are the tiny phytoplankton which provide us with so much of the oxygen we breathe. Inside Endeavor’s main lab is an amazing instrument that can actually take pictures of these microscopic creatures and count them! Since one of SABOR’s primary science goals is to quantify how much carbon is being converted into oxygen by marine life, it is vital that we know exactly what species are present and in what concentrations.
Of course it’s impossible for the R/V Endeavor to be everywhere at once, so we must rely heavily on satellite observations. Current sensors such as MODIS (Moderate-Resolution Imaging Spectroradiometer) aboard the Aqua satellite and VIIRS (Visible-Infrared Imaging Radiometer Suite) aboard the Suomi NPP platform are designed to observe the ocean and atmosphere. Although they do it quite well in a general sense, there is still too much uncertainty to make absolute assessments of climate change and carbon cycling.
When we as humans look at an object, what is it that we’re actually seeing? (No, it’s not a philosophical question!) We see color and brightness. Seems sufficient, doesn’t it? But it turns out that there is actually another hidden property of light that we can’t see with our eyes, and it’s called polarization.
So if we can’t see the polarization of light, why do we care about it? Why is it a major focus of SABOR? The answer is because it’s becoming more and more difficult to increase the accuracy of satellite measurements using color and brightness alone. By incorporating polarization into our measurements, we are opening up a whole new dimension of information that was previously inaccessible. Our laboratory at the City College of New York is studying the way light becomes polarized in various conditions both above and below the surface of the ocean.
The first of the two instruments that we designed at City College is called HyperSAS-Pol. It is designed to automatically look at a fixed angle relative to the sun, regardless of the direction the ship is facing. HyperSAS-Pol measures both the polarization of sky light, and also light coming from the ocean.
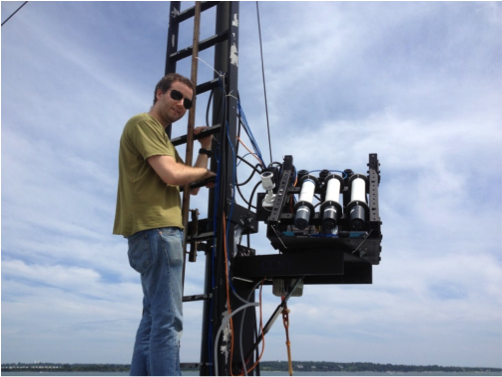
I’m setting up HyperSAS-Pol on the bow tower of the R/V Endeavor. Photo courtesy of Alex Gilerson, City College of New York
Our second instrument floats on the surface of the ocean and measures the polarization of light underwater. We can rotate the instrument by using propellers that are attached to its arms. The sensors themselves are attached to a stepper motor which can look up or down in the water. With these two motions we can measure polarized light in any direction. By the way, this instrument doesn’t have an awesome code name like HyperSAS. We just call it the polarimeter… pretty boring name, I know. Maybe you can think of a better one? Post a comment!
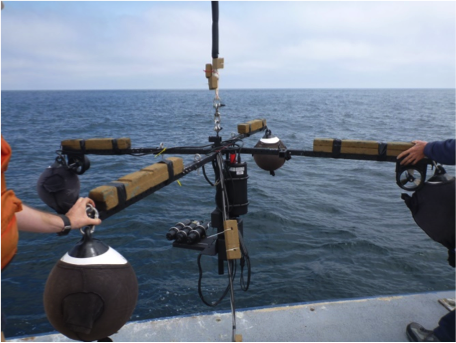
Our floating polarimeter. Photo courtesy of Alex Gilerson, City College of New York
While we are taking measurements on the R/V Endeavor, a plane will be crossing our path several times with a sensor capable of measuring polarization, as well as a LIDAR. During their test flight on Sunday afternoon we were able to watch the plane corkscrew down from the clouds to circle the ship! Too cool. They even took a picture of us!
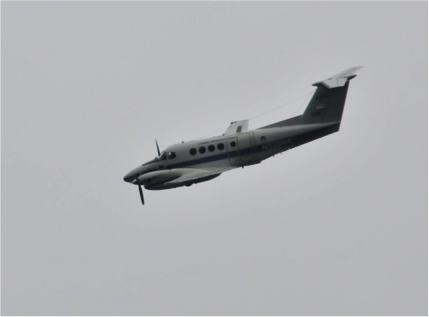
The NASA Langley plane circling the R/V Endeavor on Sunday afternoon. Photo courtesy of Wayne Slade, Sequoia Scientific
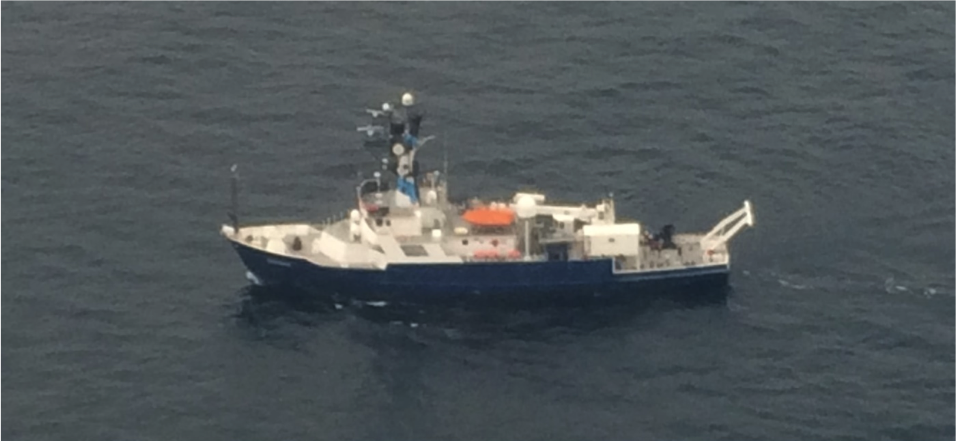
The R/V Endeavor as seen from the sky! Photo courtesy of David Harper, NASA Langley Research Center
Between the combined efforts of everyone onboard the R/V Endeavor and in the sky, we will be able to trace the complete path of polarized light coming from the sun, down through the atmosphere, into the water, interacting with all the little sea critters and finally emerging back into space to be captured by one of NASA’s Earth Observing satellites. If successful, our work here will be instrumental in the design of next generation satellites, such as the PACE mission.
We have one final visitor who is here in spirit, and his scientific value is without doubt. He makes sure that no light gets reflected off the white buoys and contaminates our underwater sensors. He is a childhood friend of mine, but I’m sure that you’ve met him before too!

Our very special colleague. Photo courtesy of Chris Armanetti, R/V Endeavor
Text by Doug Morton
NASA’s Goddard Space Flight Center
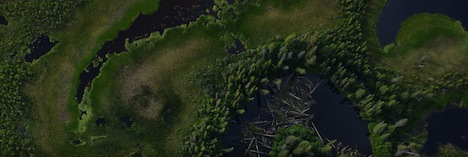
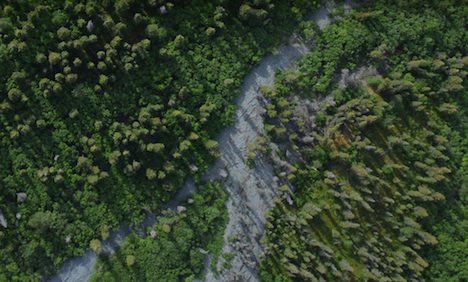
G-LiHT DSLR image of forests and open water near the Tetlin National Wildlife Refuge east of Tok, Alaska. Credit: NASA
I have always enjoyed looking out the window of a plane. From the typical cruising altitude of a commercial jetliner, the view of lakes and fields and mountains is familiar (but still fascinating) to a NASA scientist used to looking at Earth from space. Vegetation and land use follow the topography in predictable ways — agricultural fields on the flattest lands and dense forest cover on the warm, south-facing slopes.
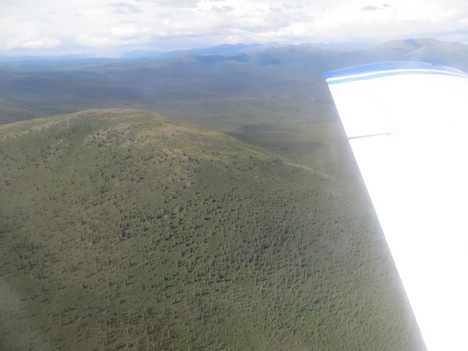
Spruce forest in the Yukon-Charley Rivers National Preserve north of Delta Junction, Alaska. Credit: Ross Nelson/NASA’s Goddard Space Flight Center
In Alaska, the G-LiHT campaign is flying low and slow to provide a very detailed look at forest structure, topography, wetlands, and forest health. At 1,100 feet above ground level, the view from above is stunning. Looking down, you see individual trees, small polygons formed by permafrost, and subtle changes in topography that allow vegetation to flourish on dry ground or wallow in the wetlands of the Tanana flats. Small black spruce trees, barely head high and the width of a dinner plate, are packed together in stands too thick to walk through. Looking out, you can see the vast expanse of the Tanana Valley, a lush green carpet of forest. The braided channels of the river flash in the sunlight as the milky white water heads out of the mountains. Ahead, the steep rise of the Alaska Range signals the end of another flight line.
Seeing the landscape from the same perspective as the G-LiHT sensors provides essential context for the project. The G-LiHT operators on the plane can switch between the real-time view of the incoming data stream and the landscape below. G-LiHT PI Bruce Cook noted, “it’s a little dizzying to watch the imagery fly by on the screen, but matching the bird’s eye view to the data gives an idea of what is possible with the analysis and interpretation of the G-LiHT data.”
Update: As of July 19, the piper had flown more than 70 hours for data collection (9,300 miles), and with more than half of the planned flight lines in the Tanana region completed.
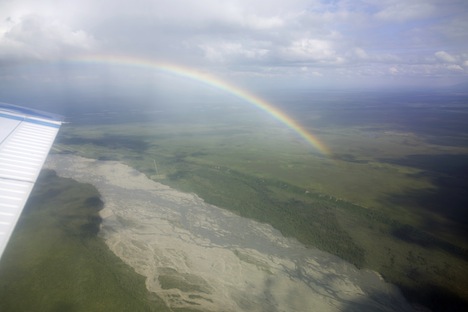
Rainbow over the Tanana River. Credit: Bruce Cook/NASA’s Goddard Space Flight Center
Not content with looking at ice from the air, on their day off from flying last week the MABEL and ER-2 team decided to look at ice underground. About a dozen of us went to visit the Permafrost Tunnel Research Facility, a U.S. Army site north of Fairbanks, Alaska, where the crew is based for a summer campaign.
Cut into a forested bluff, with just a red, shed-like structure leading into the hillside, the Permafrost Tunnel doesn’t look like much from the outside. But inside, there are thousands of years of sediments, plants, and ice-age mammal bones frozen in the wall.
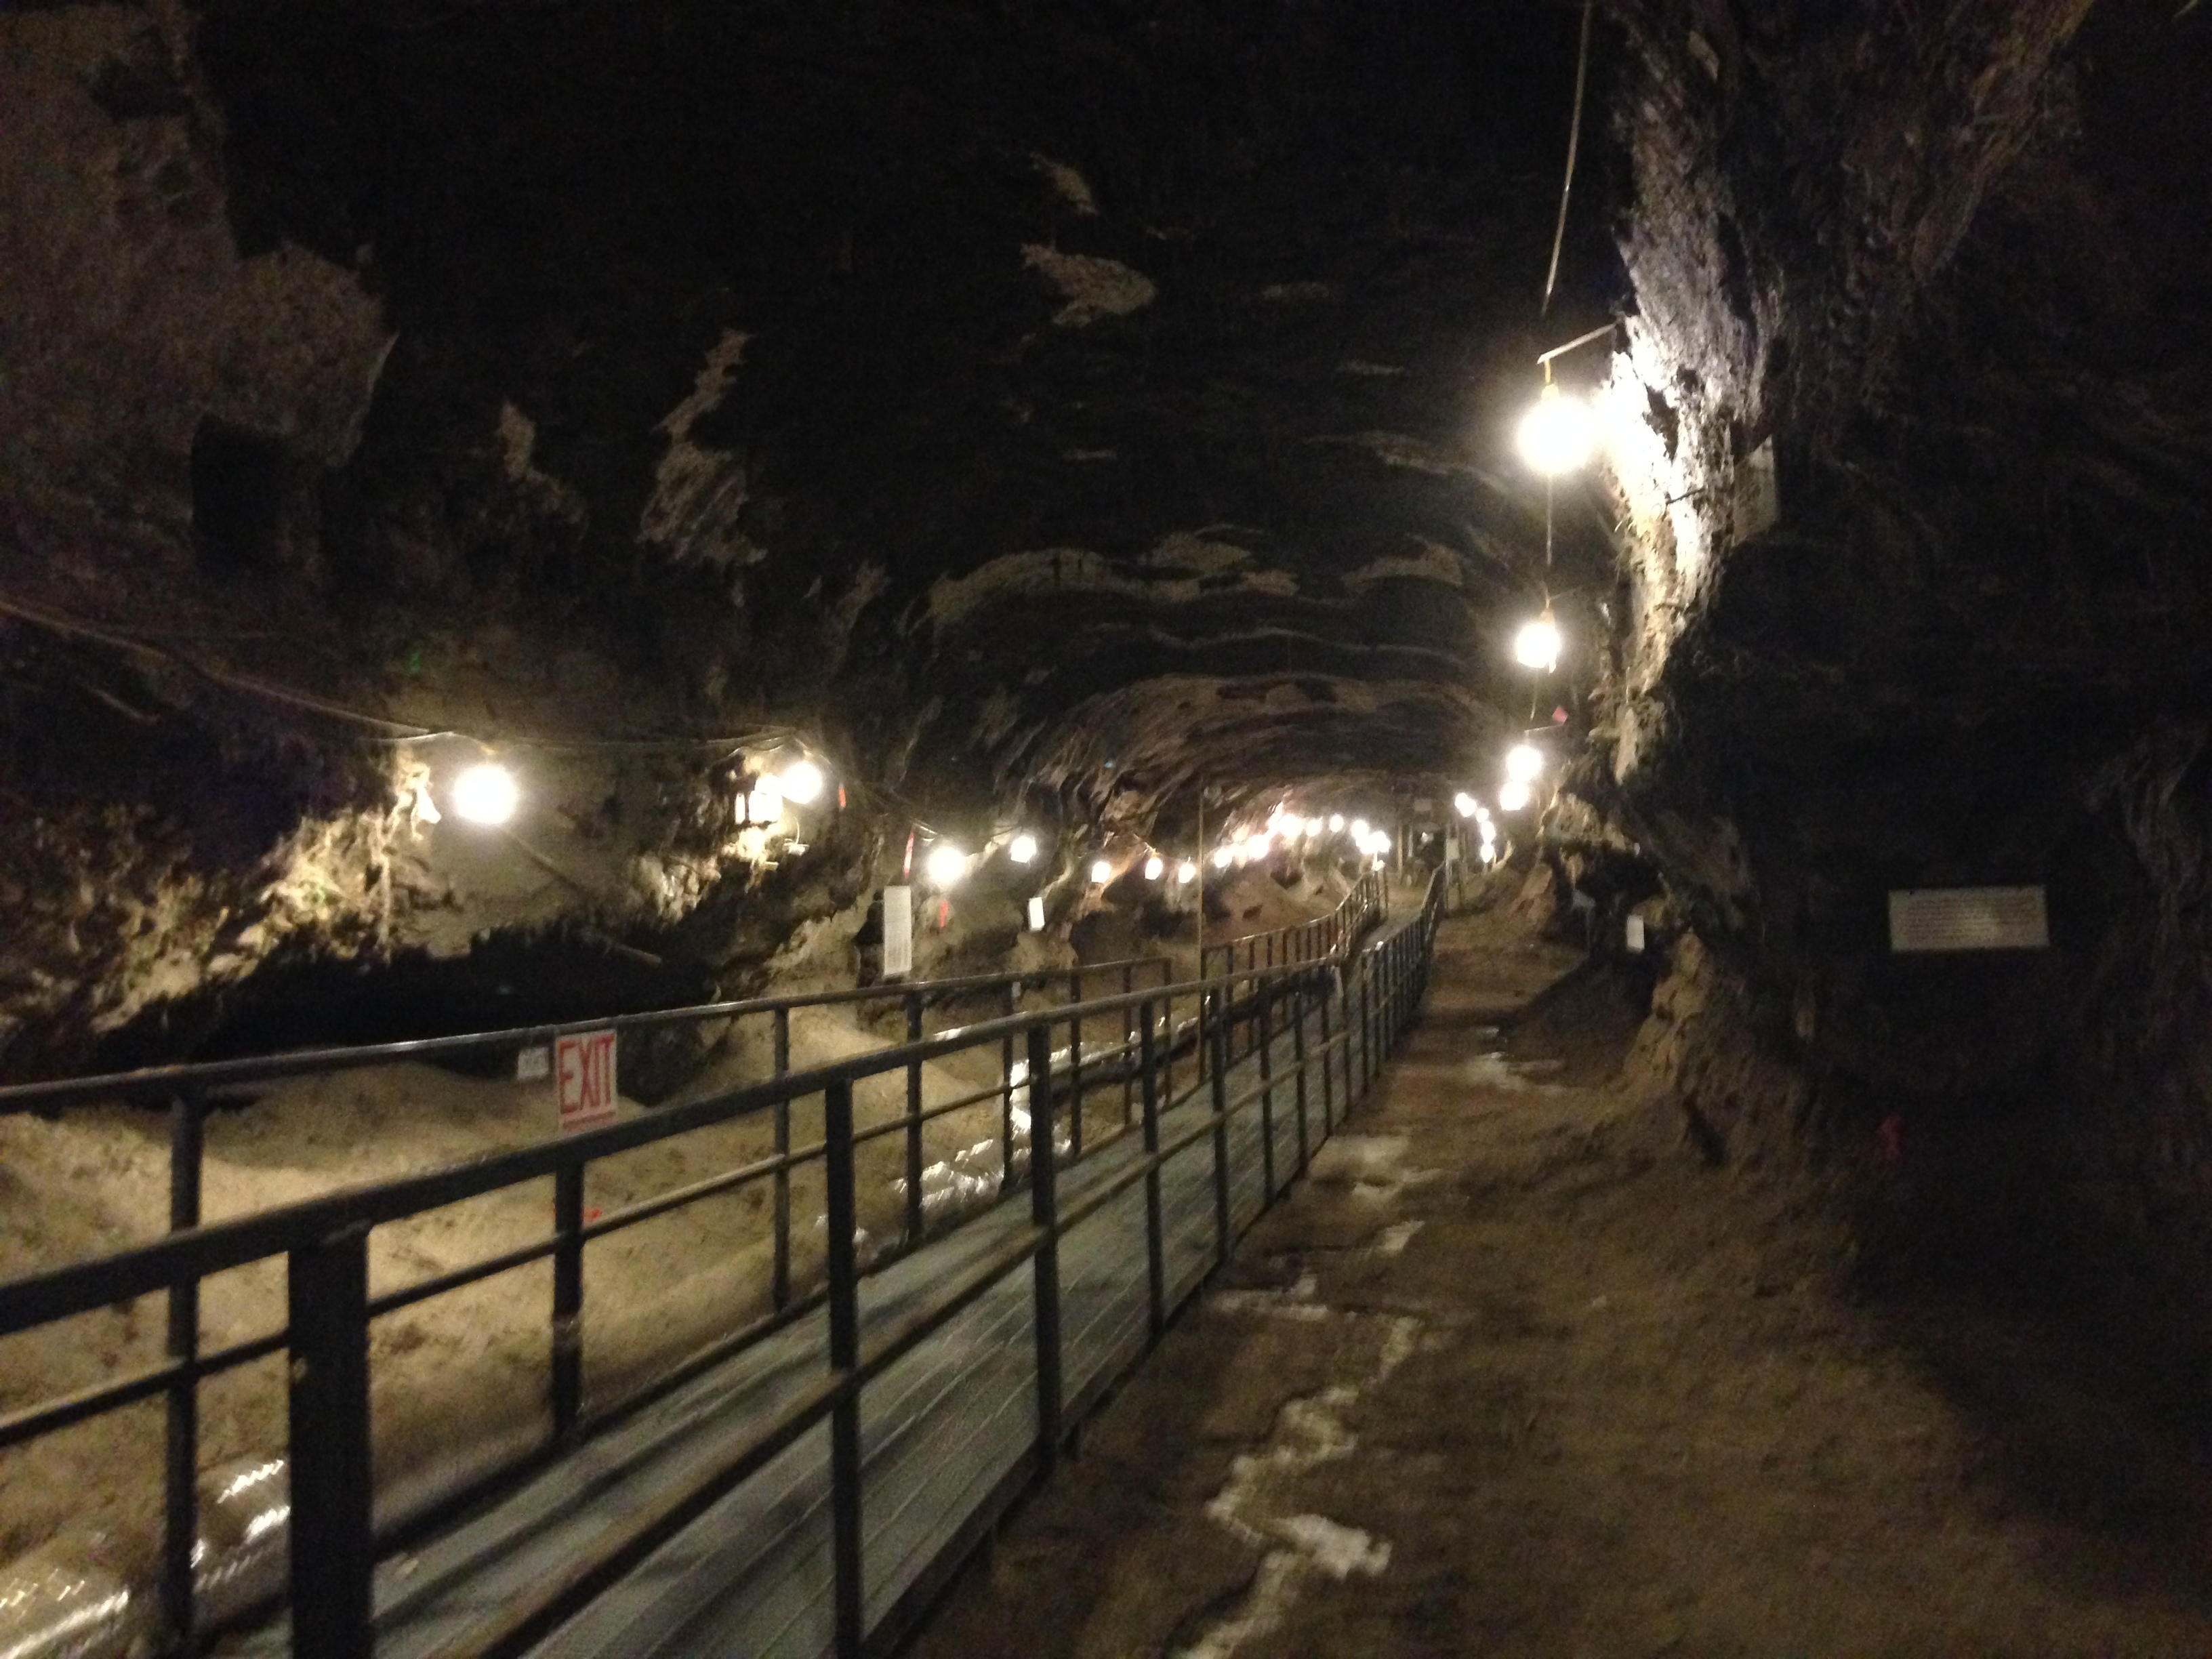
The Permafrost Tunnel Research Facility, dug in the mid-1960s, allows scientists a three-dimensional look at frozen ground. (Credit: Kate Ramsayer/NASA
It’s hard to say what you notice first: the cold or the smell. The cold – it’s kept at a brisk negative 3 degrees Celsius (26.6 degrees Fahrenheit) – is now maintained during the summer with a chiller system. Opening and closing the tunnel door for decades, along with warming outside air temperatures, would otherwise melt the permafrost. The smell, explained our guide Tom Douglas, a geophysicist with the Army who conducts research in the tunnel, is from all the decaying organic material in the walls – plant and animal matter – coming into contact with the air and oxidizing.
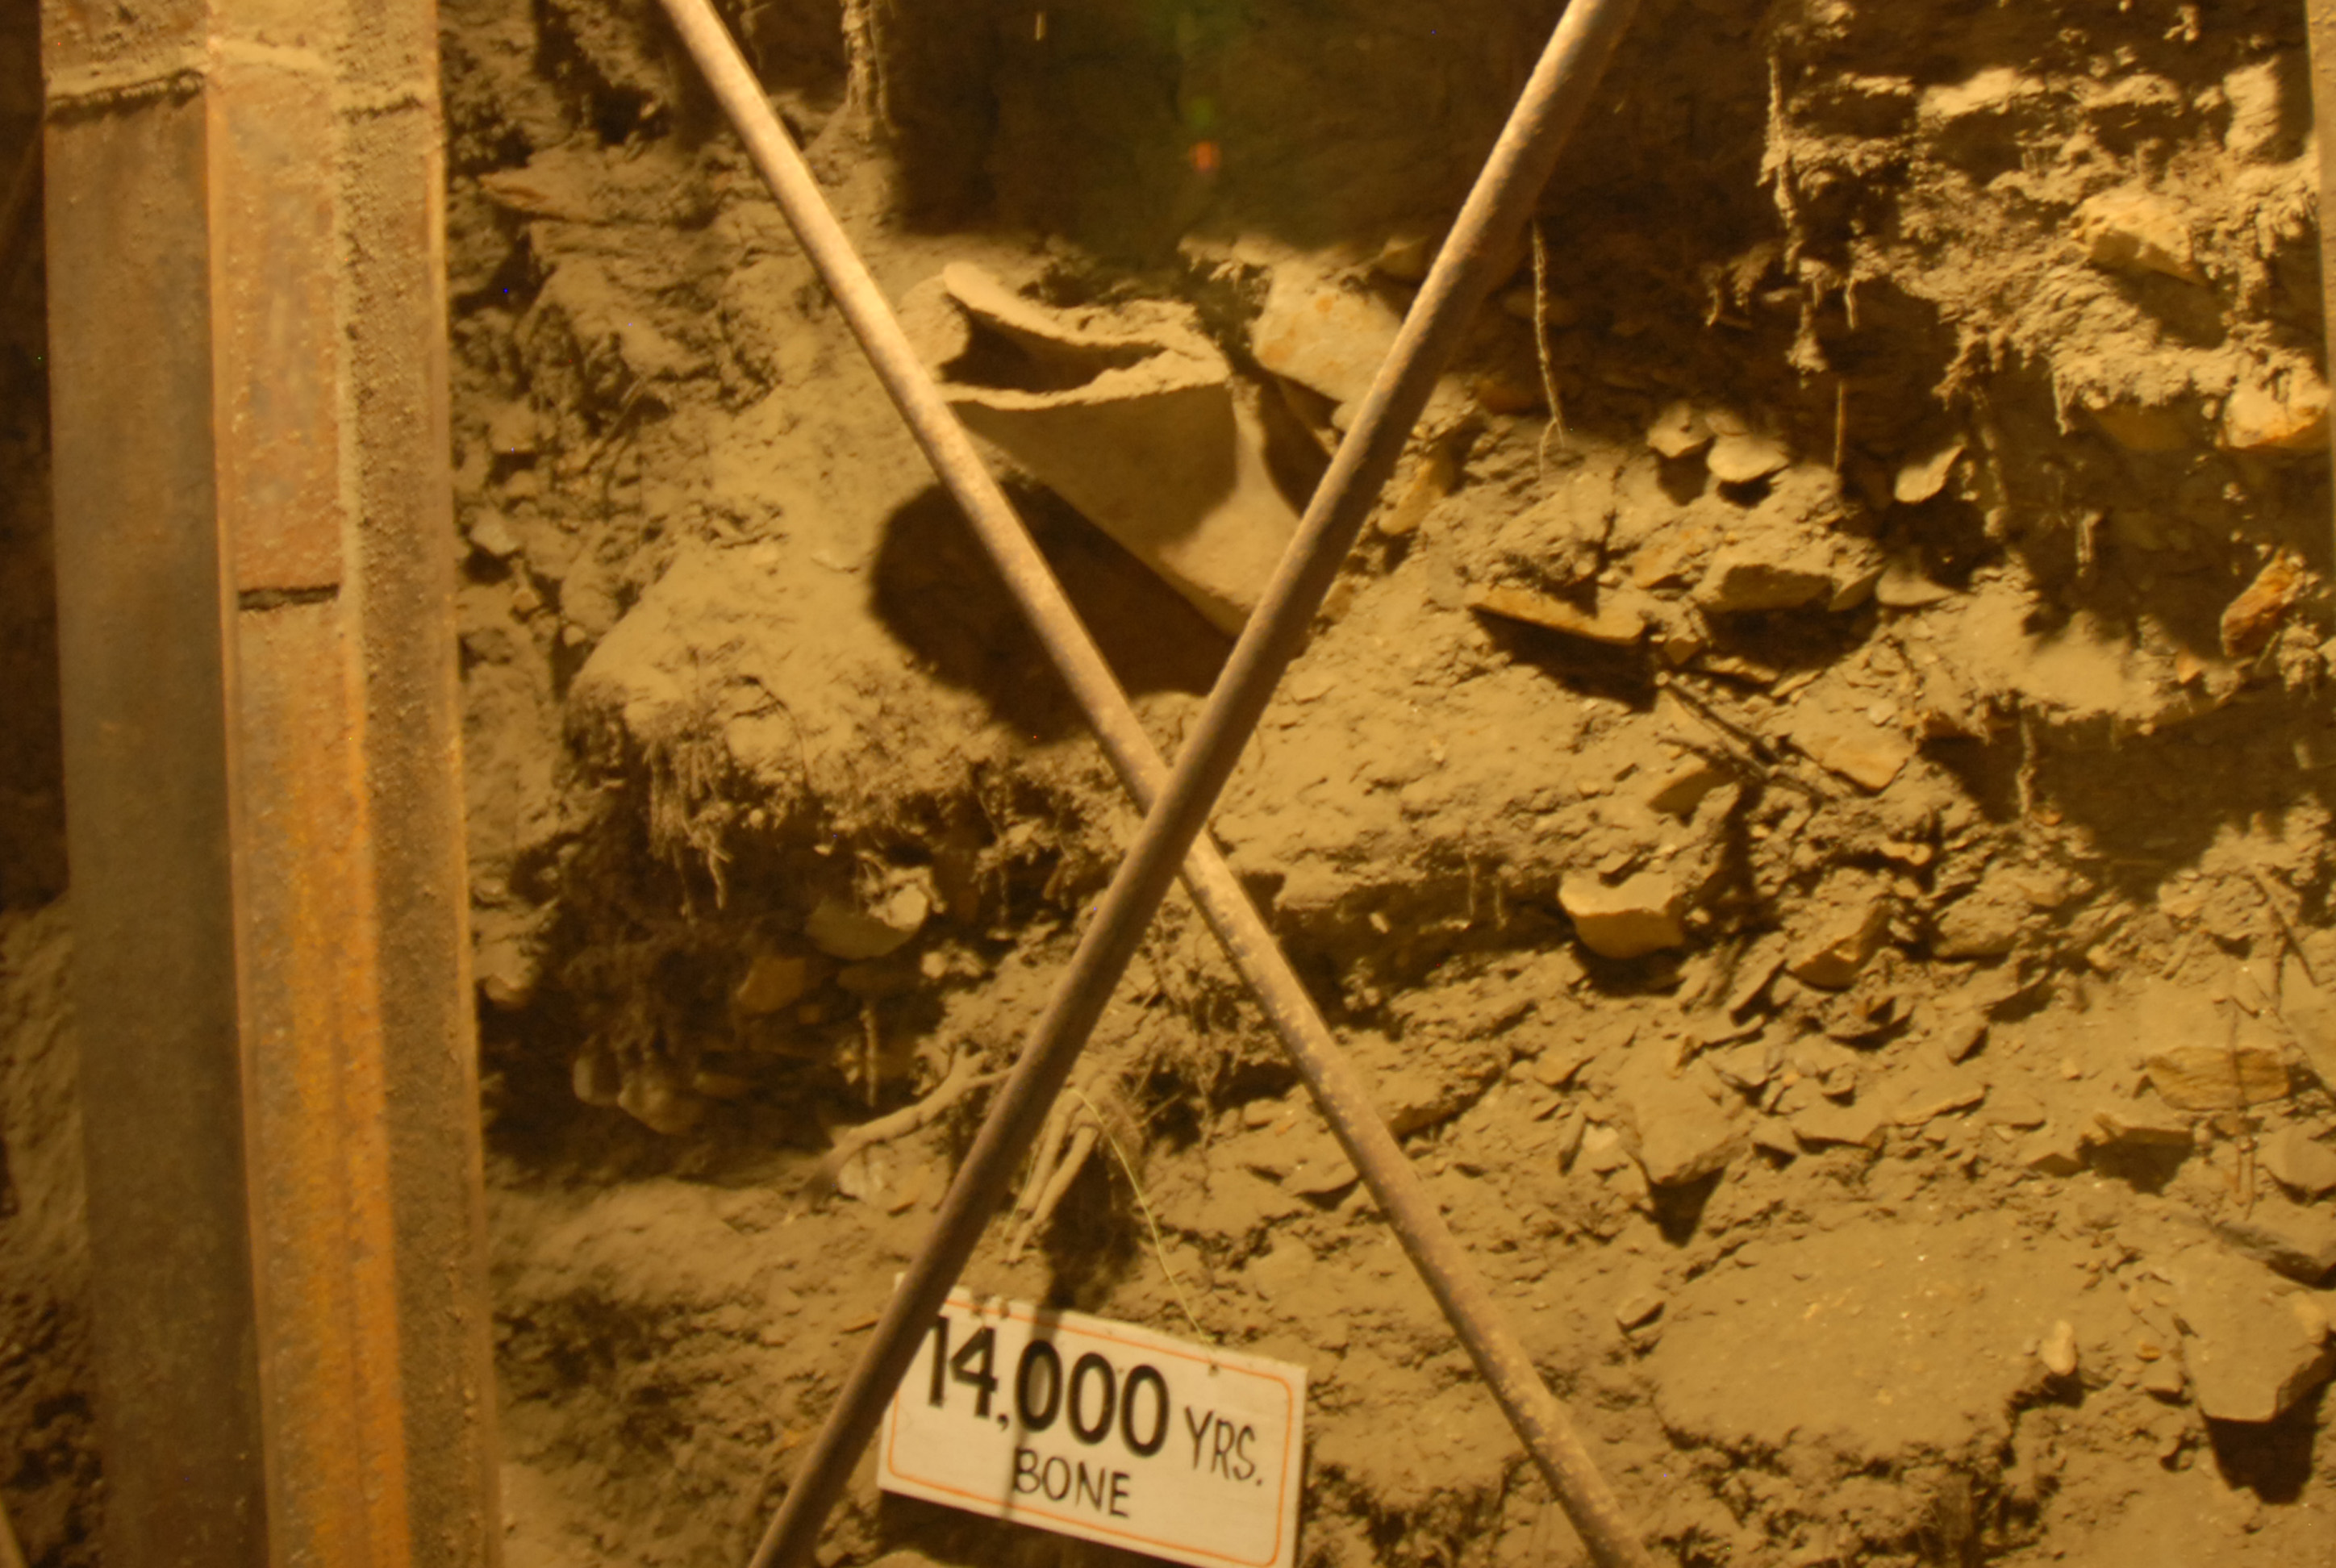
A mammal bone sticks out of the wall of the Permafrost Tunnel. (Credit: Kate Ramsayer/NASA)
Permafrost is ground that stays frozen for more than two years – including the summer months. In cold areas like Central and Northern Alaska, permafrost can build up over millennia, creating a kind of time capsule. In the Permafrost Tunnel, tiny roots of grasses and trees that lived 20,000 to 30,000 years ago drip from the ceiling.
“They’re preserved,” Douglas said. “They tend to be freeze-dried a little bit.” A giant, and surprisingly heavy, mammoth femur was found in the tunnel; horns of bison-like creatures still stick out of the wall. In a wedge of ice cutting through the permafrost, Douglas explained, researchers had melted a sample and found microscopic organisms that hadn’t been previously described.
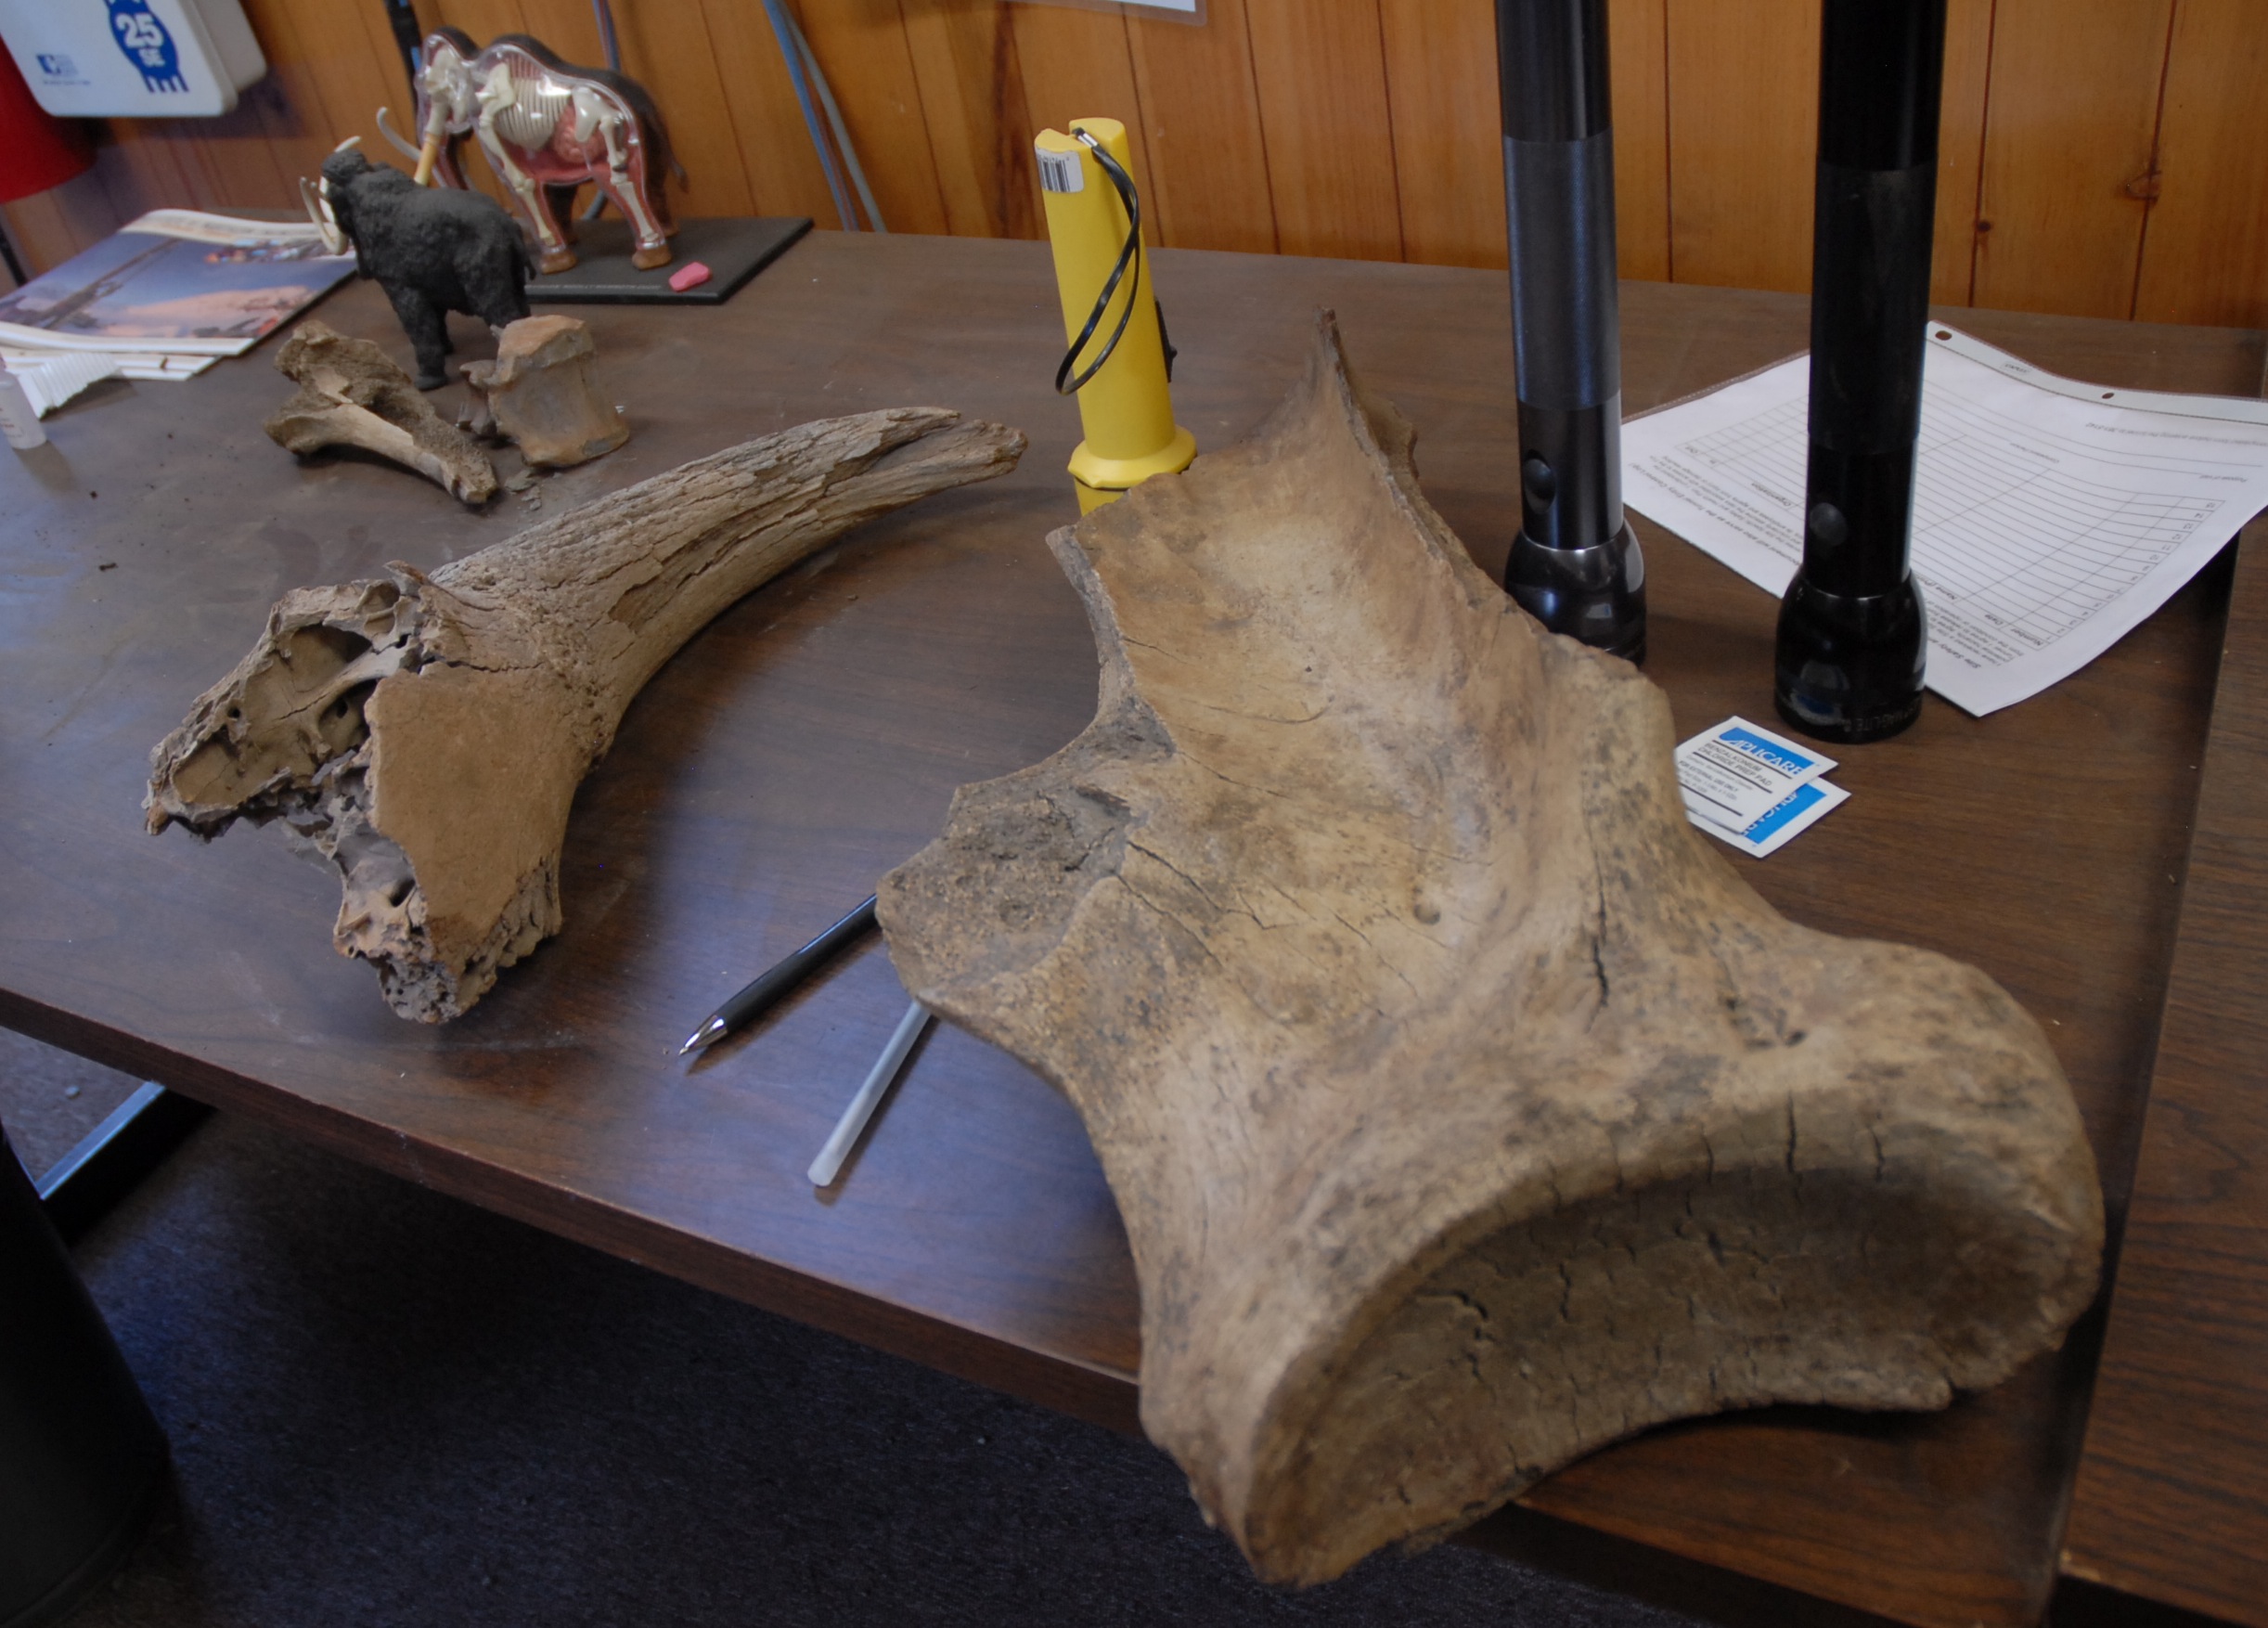
The tunnel turned up a variety of ice-aged mammal bones – including the giant leg bone of a mammoth. (Credit: Kate Ramsayer/NASA)
The ice wedges themselves are some of the tunnel’s most impressive. They’re created when the surface of the ground freezes and contracts in the winter, creating cracks in the ground. When spring comes, meltwater fills in those cracks, freezing when it reaches the permafrost layer. The next winter, when the ground cracks again, it often does so along the weak areas where it cracked before – and then another round of spring meltwater freezes, pushing the ground apart even further. Over the years, a lattice-work of wedges forms.
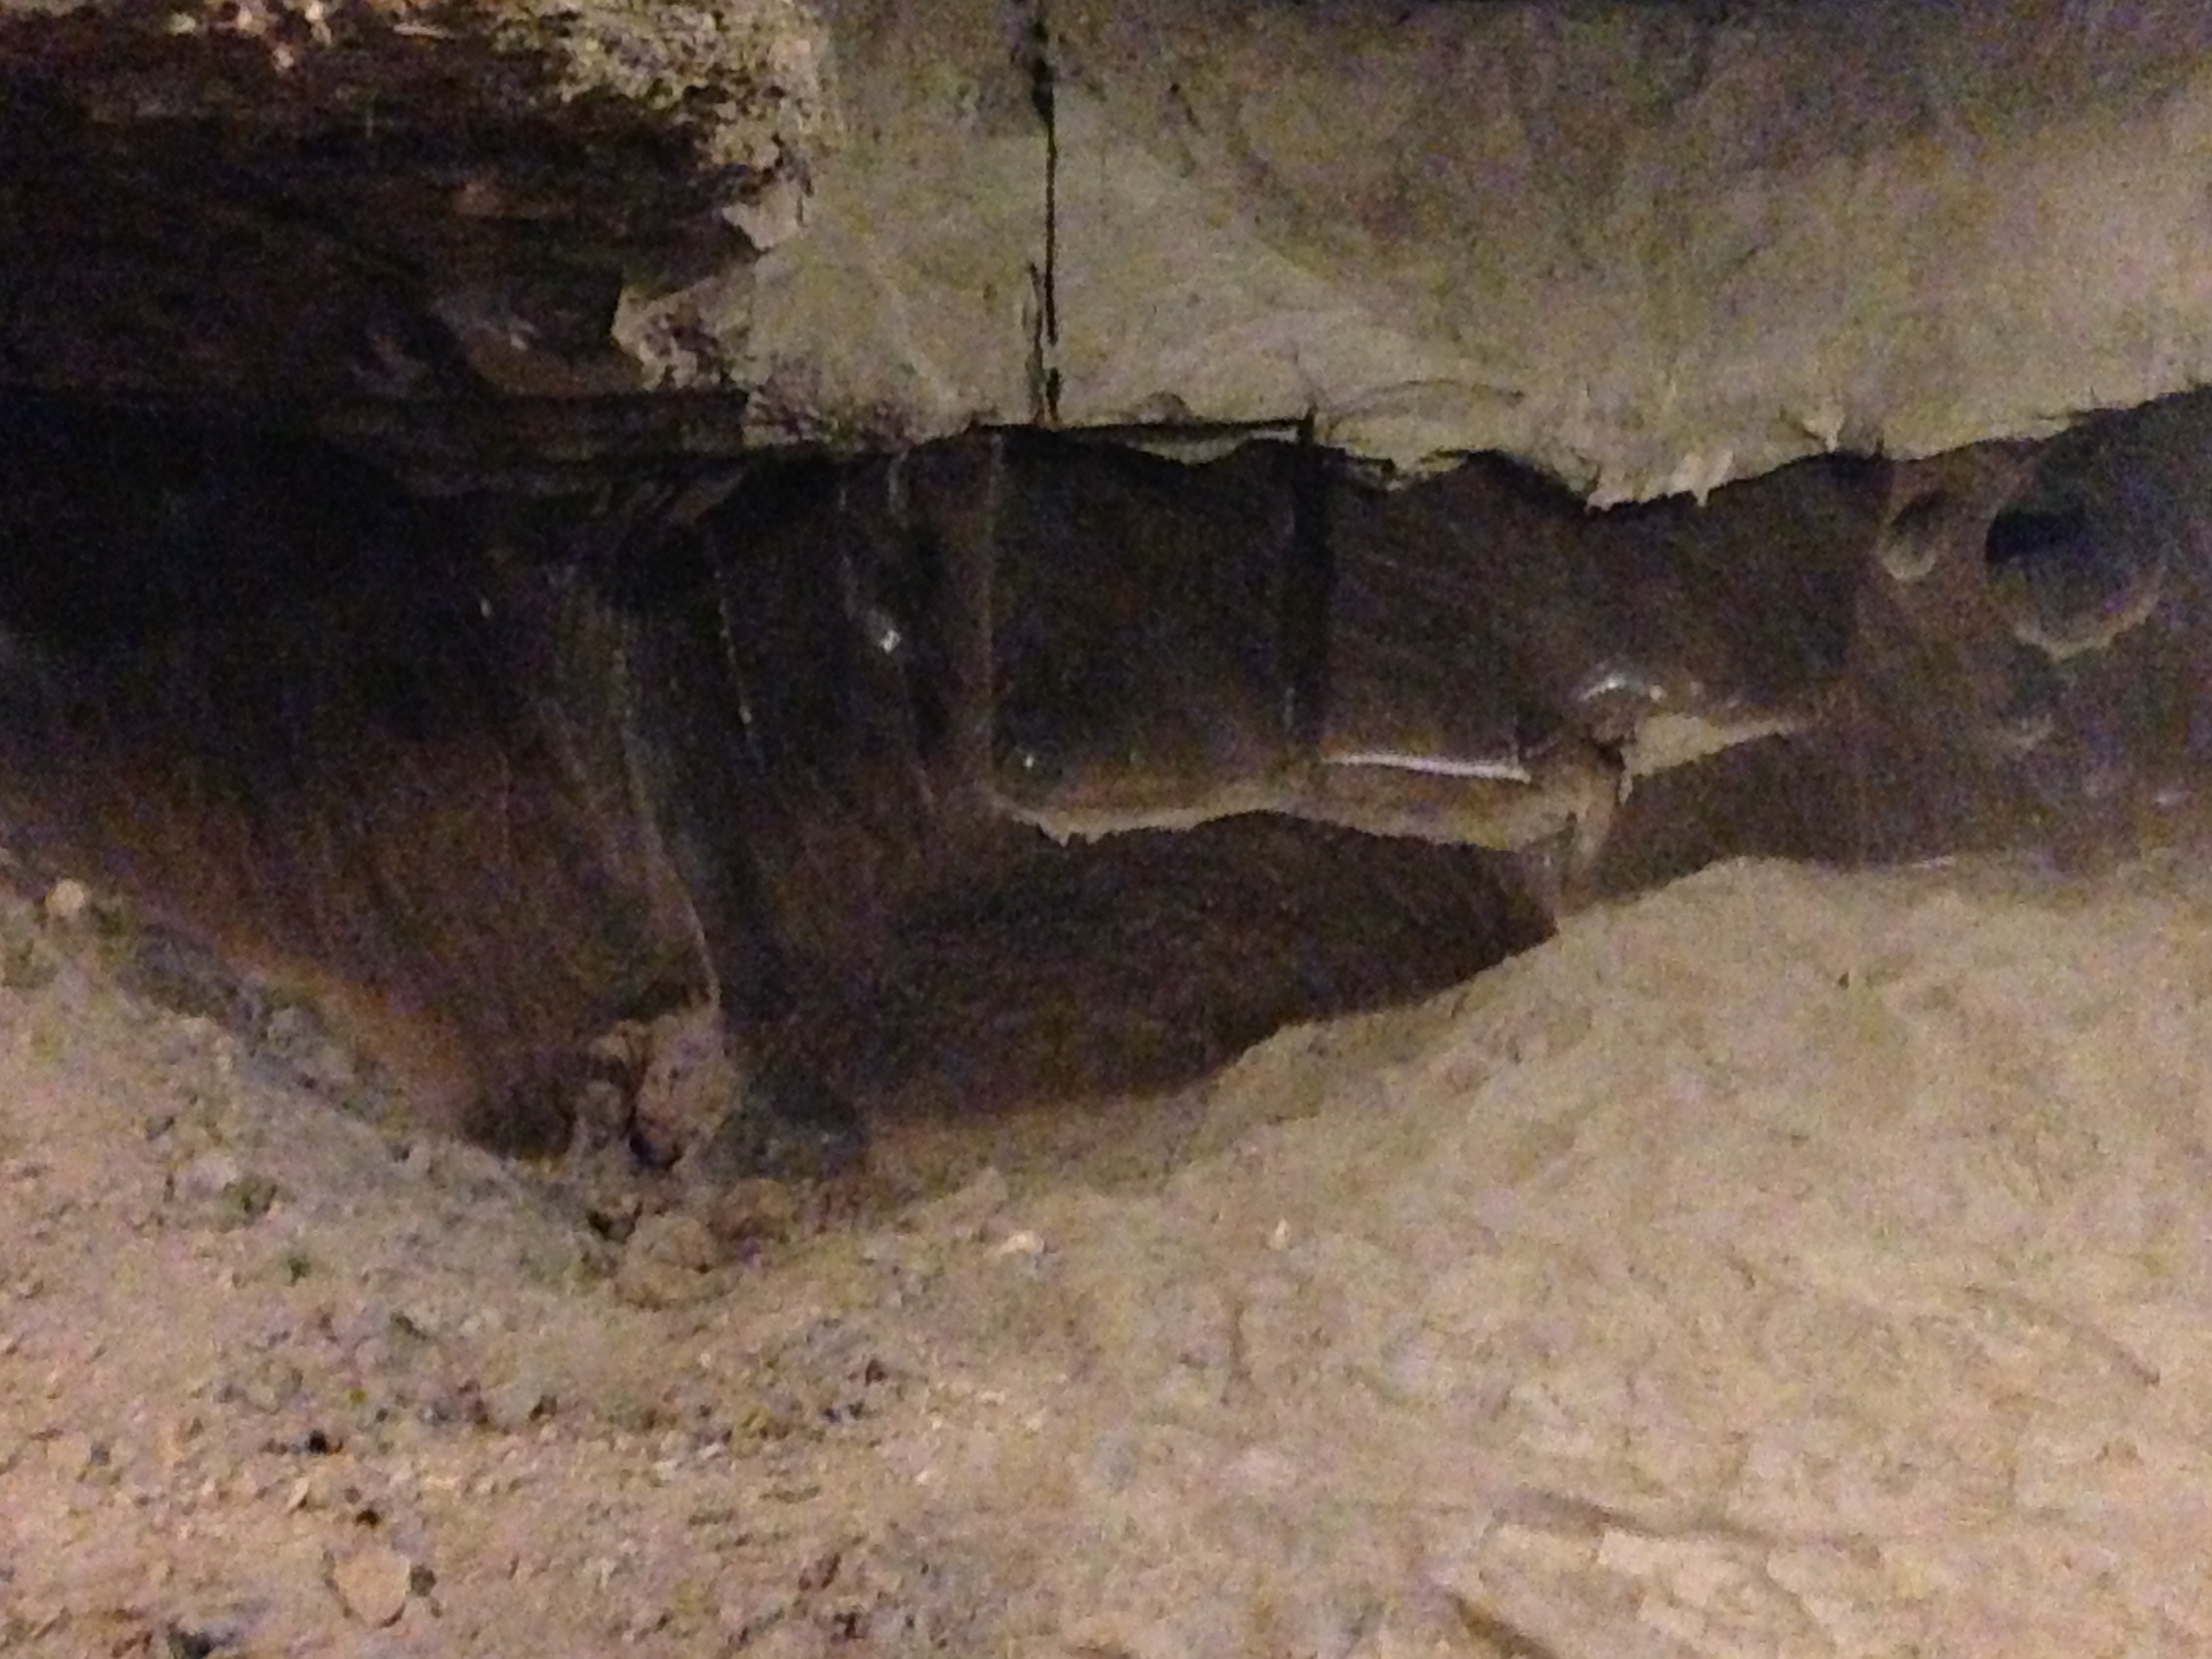
Ice wedges form over centuries, creating polygonal patterns in the permafrost. (Credit: Kate Ramsayer/NASA)
The tunnel was dug in the mid-1960s, Douglas said, and has been used for a variety of research. One question he investigates is how well different radars and surveying equipment can identify underlying permafrost, which is key for building and road construction – you don’t want to build on ground that could thaw.
The necessity for that kind of research was evident on the way back to Fairbanks – the road dips along the hillside, thanks to the dynamic ground underneath.
Text and photos provided by Doug Morton
NASA’s Goddard Space Flight Center
Credit: NASA/Doug Morton
NASA and USDA Forest Service scientists are collaborating on an ambitious project to inventory forest resources in the Tanana Valley of interior Alaska, a region the size of Iowa. The pilot project, funded by the USDA Forest Service Pacific Northwest (PNW) Research Station and NASA’s Carbon Monitoring System (CMS), combines forest inventory plots and airborne remote sensing data from NASA Goddard’s Lidar, Hyperspectral, and Thermal Airborne Imager (G-LiHT). The remote forests of interior Alaska have never been included in national inventories of U.S. forest resources based on the costs and complexity of acquiring field data in remote and difficult terrain.
The partnership between NASA and the Forest Service leverages unique capabilities for airborne remote sensing and ground surveys of forest structure and composition. For NASA, key research questions include the spatial distribution of forest carbon stocks, disturbance and recovery from fire, and data fusion—including the opportunity to characterize forest composition using a combination of lidar, hyperspectral, and thermal data from G-LiHT. G-LiHT data collections will also benchmark conditions across the Tanana Valley, an important part of the research domain for NASA’s Arctic and Boreal Vulnerability Experiment (ABoVE). For the Forest Service, the project will test the tradeoffs between a traditional ground-based surveys of forest resources and a hybrid approach to combine a limited ground sample with extensive coverage using G-LiHT airborne lidar and image data. Both NASA and the Forest Service are interested to track changes in forest cover and composition from wildfires and warming climate in coming decades.
As of July 14, the G-LiHT team had completed 40 percent of the planned flight lines across the Tanana region, totaling 3 TB of raw data and more than 2 billion laser shots fired. The flight crew is currently based out of Tok and Fairbanks, Alaska.
On July 14, 2014, NASA and USFS collaborators in Fairbanks, Alaska, prepare for G-LiHT flights. Top row: Hans Andersen (USFS PI), Tom Wirth (EPA), Grant Domke (USFS), Hobie Perry (USFS), Chris Woodall (USFS), Doug Morton (NASA), Gretchen Nicholas (USFS), Larry Corp (NASA/Sigma Space). Bottom: Matt Fagan (NASA/ORAU), Bruce Cook (NASA), Greg Reams (USFS), Ross Nelson (NASA)
