By Eric Lindstrom
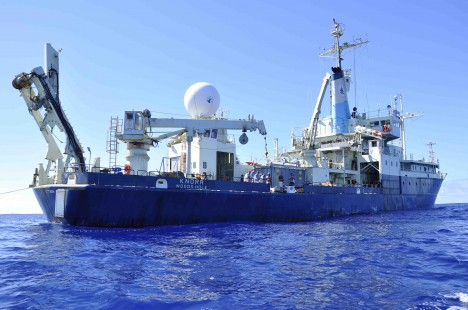
The R/V Knorr, in the beautiful Sargasso Sea.
One of the things that we worry about on the ship, as part of our daily routine, is trash. Nothing goes over the side unless it is biodegradable. We have separate trash cans for plastics, foils, and other such material that would pollute the ocean. There are cans with paper liners for food scraps and paper waste. We keep the deck clean and our eyes open for any loose cable tie or anything else that could be washed overboard. It’s our duty to pick these things up and dispose of them properly.
It may be surprising to some of you how much plastic is already in the ocean. It’s both amazing and depressing. If one stands by the ship’s rail and watches the water go by, as one wants to do in an idle moment, it is quite shocking to realize that more man-made objects can be observed than natural ones (like fish). A 2005 report from the U.N. Environment Program estimated that, on average, more than 13,000 visible pieces of plastic litter were floating on any square kilometer of ocean.
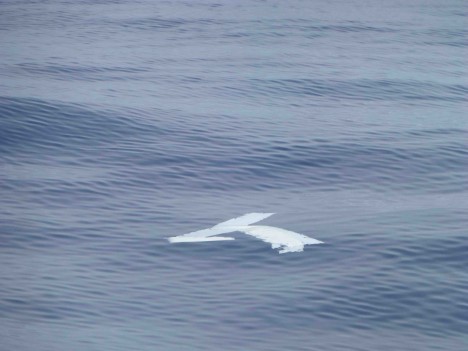
A piece of plastic debris floating near the Knorr.
Given the fact that plastic takes so long to break down, it should come as no surprise that this problem is still getting worse by the year, despite decades of effort to reduce the sources of pollution.
As a physical oceanographer, I know that the major ocean basins have gyre circulations at mid-latitude. The water moves in a great loop around the center of the ocean basins in the northern and southern hemispheres. Surface waters tend to converge toward the center of these gyres and trash of all sorts concentrates in these spots, far away from the coasts of the continents. In the North Pacific, there is the so-called “Great Garbage Patch” between California and Hawaii. Similar, but less well-known patches occupy dynamically similar regions in the other oceans. Nikolai Maximenko at University of Hawaii, a NASA-funded physical oceanographer studying the Pacific circulation, uses satellite and drifter data to understand this surface circulation in great detail. He made news with his analysis of the fate of tsunami debris from the 2011 Japan disaster.
Here in the Sargasso Sea, we have yet to see some giant patch of garbage (well, except for my desk in the upper lab!), but plastic does abound. I thought that I should testify as to my personal experience of observing so much plastic along our path. It’s more than I remember seeing 30 years ago, when I last sailed for an extended period in the Sargasso Sea. Its certainly not a scientific observation, but it reminds me that we are the creators and users of these materials and we should be the stewards of their disposal as well. So, pick up and recycle any loose plastic you see! It could wind up in the ocean.
By Eric Lindstrom
Your SPURS blogger, Eric Lindstrom, showing off the NASA logo on the surface buoy.
The central mooring at the SPURS site is a critical piece of gear. It will provide us with a time series of upper ocean properties at one location over the entire year. We’ll build the other SPURS measurements around this spot on this and future voyages. We’ll “fly” the gliders in patterns centered on this location.
Our first order of business is to survey the bottom depth in the vicinity of the proposed mooring location (near 25N, 38W). The water depth we are aiming for is near 17,390 feet (5,300 meters).
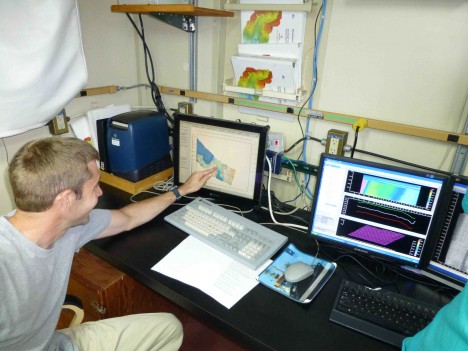
Tom, working on the survey of bottom depths prior to mooring deployment.
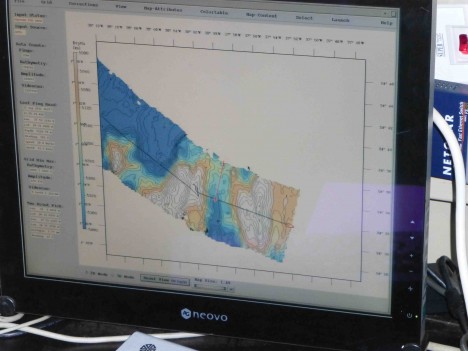
Seabeam maps the bottom along a swath 8 miles wide.
The mooring is anchored to the bottom (with a 10,000 pound anchor). A large, heavily-instrumented buoy at the surface holds the entire string of instruments below. Just above the anchor is an acoustic release mechanism that can disengage the mooring from the anchor on command from the ship next year. Above the release are 80 glass floats (inside hardhats) that serve to float the bottom of the mooring to the surface after release.
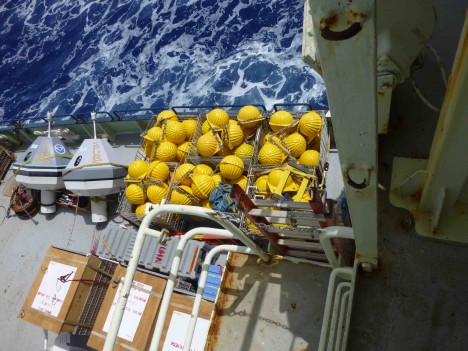
80 glass floats in hardhats go at the bottom of the surface mooring.
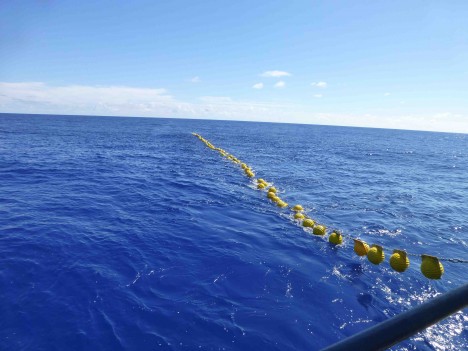
The glass floats at the bottom of the WHOI mooring, trailing behind the R/V Knorr.
It’s a process of many hours to deploy the mooring. The ship will position itself some miles from the proposed anchoring site (depending on wind and currents) and start steaming toward the spot very slowly. The length of mooring and gear are then deployed over the stern starting with the top of the mooring, the surface buoy. After that various current meters, salinity and temperature sensors are attached in turn with various lengths of chain and shackles. As they are joined, they are in turn lowered over the stern and the surface buoy begins to distance itself in the ship’s wake. About 8 hours after the start of the deployment, the 16,000 feet of mooring is laid out on the surface behind the ship, and all that’s left on deck is the anchor.
At this point, location is everything. If timed correctly, the ship will be some distance past the location mooring intended to land on the bottom (say 10 percent of the water depth). If so, it is time to drop the anchor. As it falls, the length of mooring will drag it back toward the spot it will finally come to rest. We will see the surface buoy begin to rush swiftly back toward the ship (hopefully finishing up at its intended target location).
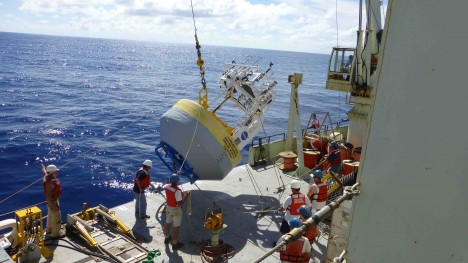
Lifting the WHOI buoy for deployment.
The buoy is away!
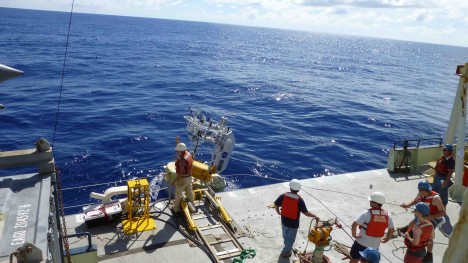
The mooring wire and equipment are gradually added.
Such work has been done thousands of times over the decades, but every deployment presents its own challenges of ocean bottom topography, wind, currents, and equipment. The length of the mooring needs to precisely cut for the water depth in which it is anchored. If it is too long, the mooring swings around too much at the surface. If it is too short, the mooring may be under too much stress or snap.
By Eric Lindstrom
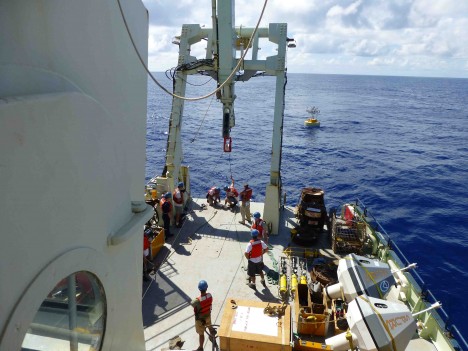
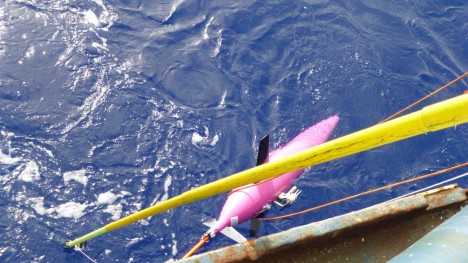
We just launched the first of our autonomous vehicles – a pink Seaglider with the sexy name of #189.
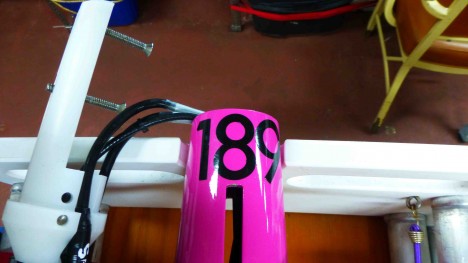
The story of Seaglider 189 begins.
Underwater gliders are the longest-range autonomous undersea vehicles in the oceans by virtue of their very simple propulsion mechanism: the translation of a vertical force into an horizontal one through use of wings. Gliders adjust their buoyancy by alternately inflating and deflating a small swim bladder appended to the vehicle’s body, a mostly rigid pressure hull. A volume variation of only a couple of thousandths of the overall vehicle’s volume is enough to provide an upward or downward buoyancy force that balances a combination of lift and drag forces, resulting in forward and vertical motion, the essence of gliding. Gliders, in effect, use wings as their propellers.
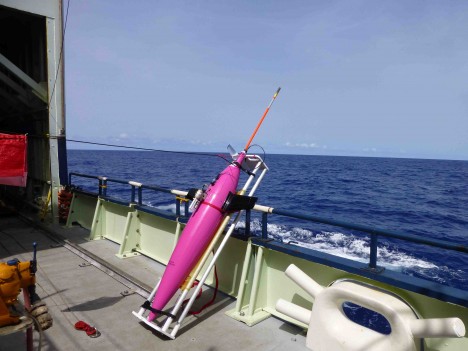
About an hour away from deployment.
Once made heavy, Seagliders sink to a prescribed depth where an electric motor drives a pump to change the vehicle’s density from heavier to lighter than the surroundings, causing them to ascend. They slice through the ocean along sawtooth paths.
The fixed supply of electrical energy aboard the glider in the batteries is used for propulsion and instrument operation. At SPURS we are using gliders in somewhat opposite extremes: some of them (the Slocum gliders — more about them later) are packed with power-needy instruments that limit their mission length to a couple of weeks, while others (Seagliders) direct a greater portion of energy to propulsion and operate a less hungry suite of sensors to achieve the 7-month mission duration required by the SPURS ship schedule.
Gliders were developed to probe the oceans independently of ships. Persistence is their virtue. The Seagliders launched from R/V Knorr are meant to repeatedly survey a limited region of the ocean, every fortnight repeating a 150-nautical mile (480-kilometer) circuit to provide a four-dimensional description of the upper ocean across wide area of ocean centered on the SPURS moored array. Profiles of temperature, salinity, oxygen, chlorophyll fluorescence, and optical backscatter will be transmitted ashore at the end of dive cycles to 0.6 miles (1 km) depth, repeated about thrice daily.
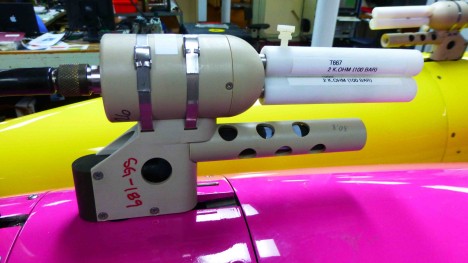
A close-up of Seglider 189’s sensors.
These gliders are completely autonomous once submerged, until they make a call over the Iridium satellite network to report data collected and accept new instructions from ashore controllers that manage everything, from flight to sampling strategy. They steer toward instructed target positions by moving the battery pack to one side or the other, inducing a vehicle roll that results in a turn. They follow a calculated compass heading to approach each target and, once there, dive toward the next. Seagliders even predict the effects of currents on their progress to choose an efficient heading with which to approach the next target. Vehicle pitch is similarly controlled during flight and the nose is depressed at the sea surface to raise the trailing antenna above the waves to gather position information and communicate.
In addition to the standard suite of measurements, the SPURS Seagliders are carrying brand new temperature microstructure probes. These are intended to measure turbulence in the upper ocean over nearly 2000 km (more than 1000 nautical miles) of track through the ocean by each vehicle on each mission. The hope is that upper ocean turbulence, long exclusively measured by ship surveys, will in SPURS be extended over the course of a year in autonomous surveys. The salinity and temperature profiles collected by more conventional aboard instrumentation, together with turbulence profiles, will reveal where the ocean mixes with respect to the myriad fronts and eddies to be encountered in the SPURS region.
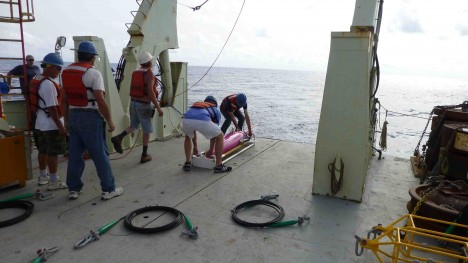
Members of the SPURS team, ready to deploy the Seaglider.
Getting lowered…
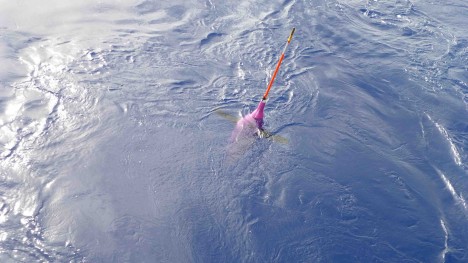
Free at last!
Finally, to answer the inevitable question: to what does Seaglider #189 owe its garish color? The original project engineer in Seaglider development, Jim Osse, had some paint left over from a human powered submarine contest his University of Washington team entered in Florida. He chose the hue selected by the customer ahead of him at the counter of a Seattle auto parts store, destined for a 1942 Ford Coupe (and, it turns out, a bevy of Seagliders, too): Hot Rod Pink. We are hoping that #189 stays in the pink and safely hot rods around the ocean until recovered next March!
By Eric Lindstrom
“Why do sharks swim in saltwater? Because pepper water makes them sneeze!”
Jokes aside, why is saltwater so important? Find out using our educational resources about ocean salinity.
Along with our expedition, there are many web resources for educators wishing to incorporate oceanography and salinity into their curricula. This post highlights some of the resources and points of contact for Aquarius and SPURS expedition.
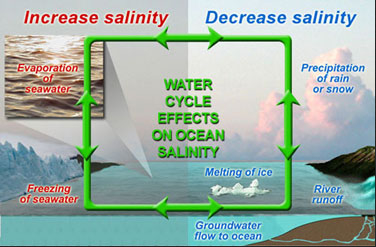
First, the Aquarius mission teamed up with Annette DeCharon and the Centers for Ocean Science Education Excellence-Ocean Systems (COSEE-OS) over the past several years to create educational materials on the Aquarius mission website. Created throughout the life of the Aquarius mission, these materials include classroom activities and data-driven tools that allow non-scientists to see the implications of ocean change on the environment. Here you will also find standards-oriented lessons, such as “Salinity Patterns & the Water Cycle,” which are organized according to grade-level and highlight the role of salinity in Earth and Ocean processes.
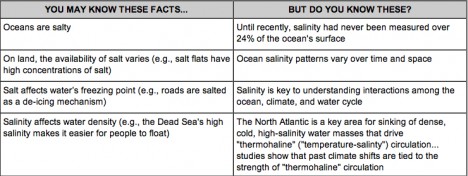
Test your knowledge of salinity on the Aquarius web page.
In addition, the COSEE-OS website has a variety of resources related to the Aquarius mission and ocean salinity. These include the COSEE-Ocean Systems/UMaine publication “Teaching Physical Concepts in Oceanography: An Inquiry-Based Approach,” and content-driven webinars and interactive concept maps created by NASA Aquarius scientists. These webinars focus on the technology and scientific process involved in measuring ocean salinity from space, emphasizing the role of salinity in regulating ocean circulation and Earth’s climate and weather.
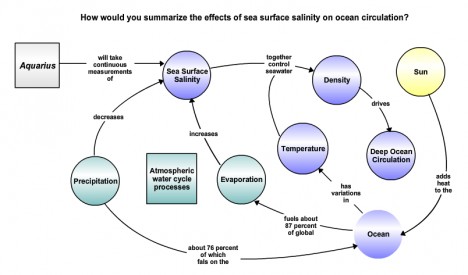
View of the concept map created by Aquarius Principal Investigator, Gary Lagerloef, explaining the science goals and broader implications of studying sea surface salinity.
Example of one of the many freely-available assets from interactive concept maps and searchable on the COSEE-OS website.
Second, Phoebe Jekielek, also from COSEE-OS, joined us in Woods Hole for the pre-expedition media event. She certainly got up to speed on SPURS if you have questions! Currently available resources on the SPURS website include a Sampling Strategy Challenge, using the JPL Trajectory Tracking Tool, designed for in-class use to introduce teachers and students to one of the modeling tools SPURS scientists use to plan their cruise. Check back for more materials, pictures and interviews highlighting the scientists, technology and instrumentation of the cruise and the importance of understanding ocean salinity. Phoebe collected much of that information last week.
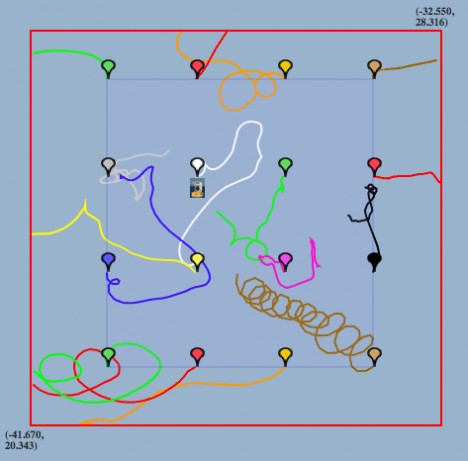
Example of the viewing window in the JPL Trajectory Tracking Tool showing “balloons” representing deployed drifters, long/lat coordinates and the “drifter track”output after running the simulation.
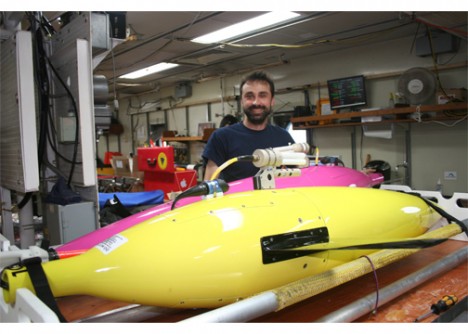
Dr. Andrey Shcherbina aboard the R/V Knorr with seagliders being deployed during the SPURS cruise.
Other, more general, resources include the NASA Physical Oceanography Program production on ocean motion dedicated to providing materials about ocean surface currents using figures, movies and links to other resources. Additionally, this site provides useful data visualization tools for use by teachers and students.
The BRIDGE also provides a wide selection of teacher-approved marine-related resources.
But the biggest resource for the next month is the team at sea on Knorr working on SPURS. I would welcome feedback and questions from students and teachers on my postings. Your questions might stimulate fresh directions on the postings and there is interest from those aboard ship in helping to answer your questions. Hope to hear from you soon!
By Eric Lindstrom
A workhorse of our voyage is the two primary means of measuring salinity from the ship. We use two different Conductivity, Temperature, and Depth (CTD) instruments. One is used on station, when the ship is stationary and the other is used while we are underway (smartly dubbed the underway CTD). Remember that salinity is directly related to conductivity, so each of these instruments provides salinity profiles. On station, the CTD package can be lowered (via winch) all the way to the ocean bottom and is capable of also collecting water samples at 23 different levels. The underway CTD is a small, self-contained unit that makes measurements to only 1300 feet (400 meters) depth and it’s deployed on the end of a string and recovered using a small electric reel.
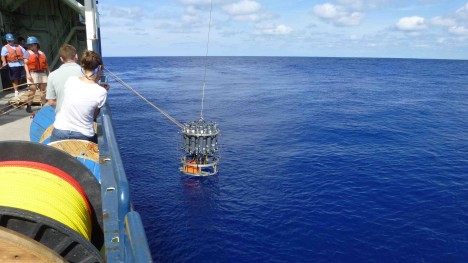
First CTD cast away.
I say these are our workhorses because we will use these instruments 24/7 for weeks on end. We plan stations 4-6 times a day with CTD casts to 3280 ft (1000 m) and an additional deployment per day to 6561 ft (2000 m). While en route, we plan to drop the underway CTD every hour.
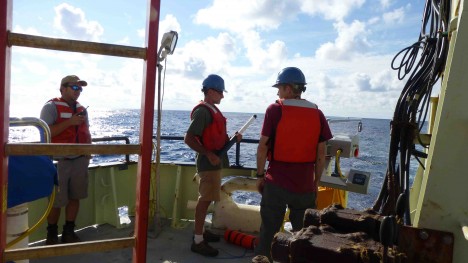
Jeff, holding the underway CTD unit prior to deployment.
Gradually, over the course of many days, we will be able to map the upper ocean salinity and temperature fields from the individual profiles.
When we are out on deck deploying these instruments during the day, it is always remarkable how the color of the ocean and sky change from hour to hour. I think everyone marvels at the deep blue of the Sargasso Sea and the contrasting blues of the ocean and sky. The hues change as the sun angle changes during the day or clouds intervene. The cloud shadows on the water give the blues of the ocean a varying texture.
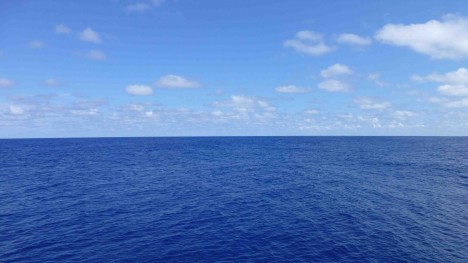
Shades of blue.
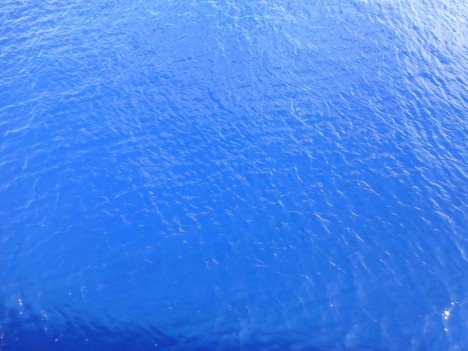
We love the color of the Sargasso Sea.
Everyday in the Sargasso Sea we see flying fish. They are best seen leaping from the bow wave of the Knorr and flying hundreds of feet to escape the ship. They are adapted to escape predators with their speedy swimming and wing-like fins that allow them to stay airborne when they leap out of the water. It’s a show that is always available while we are underway. We just go to the bow and watch for a few minutes. I have not yet heard reports of whales or large fish observations. I did see one small school of smaller fish go by quickly while underway. It’s always fun to take a few minutes to just watch the ocean. There are plenty of things to see, if only you are prepared to observe them!
When we start 24/7 operations later in the week we will have deck lights on at night and that provides another observing opportunity. The lights may attract fish and squid to our locale. More on that next week!
