By Eric Lindstrom
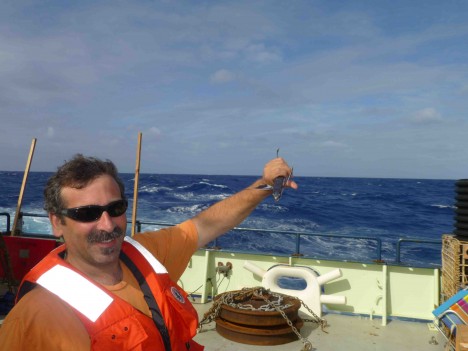
John snags a flying fish in mid flight.
There are not many places in the open ocean that get their own special name as a “sea.” Most seas are what we call marginal seas – offshoots of the major ocean basins.
The Sargasso Sea, as a vast track of the western subtropical North Atlantic Ocean is known, has a special characteristic – something noted by Portuguese sailors for centuries and even visible from space. It is the home waters of Sargassum, a genus of brown macroalgae (seaweed) that inhabit the open ocean. The sea is named after the seaweed and it seems that small clumps are nearly always within sight of the ship (we have yet to see giant mats of the stuff in the SPURS region). Anyway, the Sargasso Sea is special because of a plant. Well, it is more complicated than that!
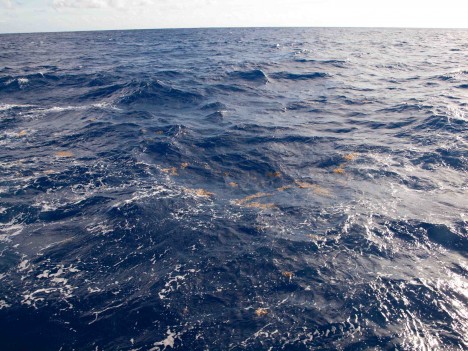
A patch of Sargassum at the surface (Photo: Julian Shanze.)
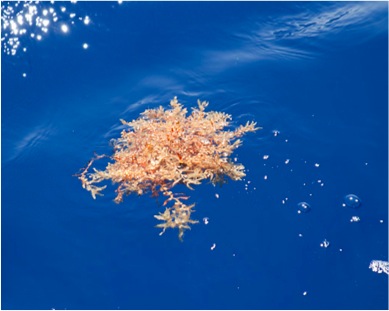
Sargassum, up close.
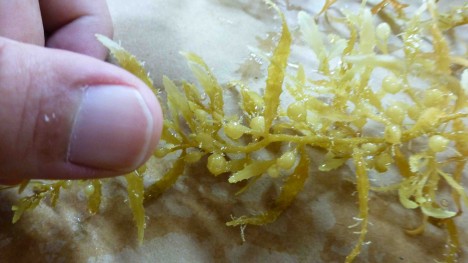
Closeup of Sargassum.
In my opinion, the really cool thing about Sargassum is that each clump can be a teeming ecosystem by itself. Several varieties of fish (e.g. Sargassum fish and flying fish), crabs , and nudibranchs live in close association with the weed. Each clump is a complex island of life floating free at the surface of the deep ocean. When you are out here in the vast emptiness of the open ocean, it is just hard to imagine how this intricate web of life came to be, survived, and actually thrives. Every time I am in the Sargasso Sea, it seems such a wonder.
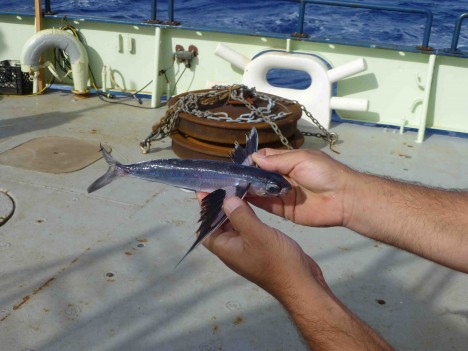
A flying fish.
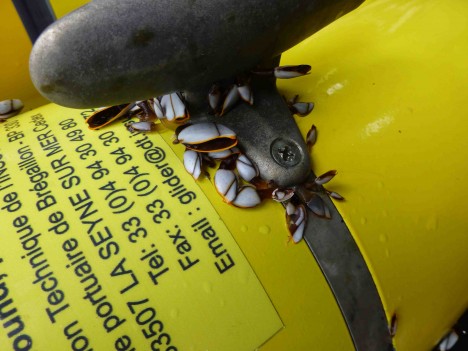
Barnacles on French glider recovered by Knorr.
We had spectacular sunset last night and I was reminded of the old adage: “Red sky at night, sailor’s delight. Red sky in morning, sailor’s warning.” Here we are still in proximity to Hurricane Nadine and is this saying true, or is it just an old wives’ tale? Like the answer to most questions, there is a web site for that. In fact I think it may be true for us; we are well south of the hurricane weather and forecasts have good weather for in days ahead.
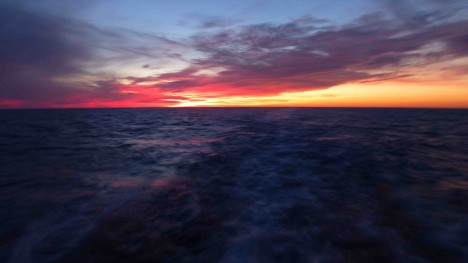
Sunset sen from the Knorr.
An interesting sidebar to today’s blog topic is another kind of life we have found in great abundance at our SPUR study location. It was a mystery for a few days – we were seeing lots of floating microscopic reddish dusty particles. Some said it looked a little like sawdust (but where are the trees?), and some wondered whether it was floating dust from the Sahara. Well, thank goodness for the Web again. I discovered that it’s a bloom of an important nitrogen-fixing bacterium (Trichodesmium) also known as “sea sawdust.” It certainly reinforces the idea that a key to identification is a good description!
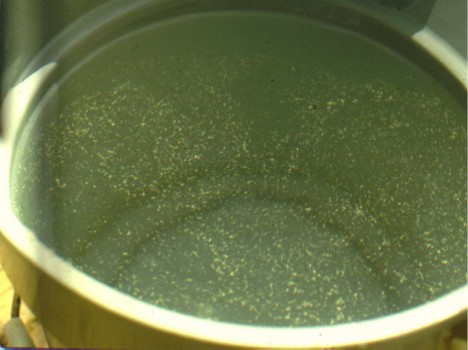
Trichodesmium in a bucket of sea water.
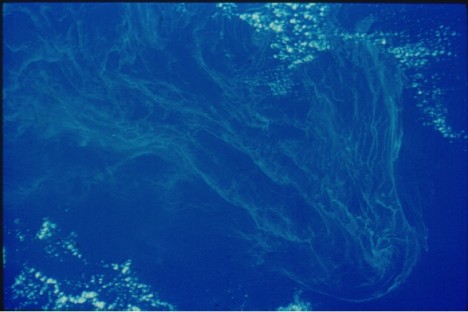
A Trichodesmium bloom in the Pacific Ocean seen from space.
Trichodesmium, it turns out, just loves these sea conditions – just as much as SPURS oceanographers love the North Atlantic salinity maximum!
By Eric Lindstrom
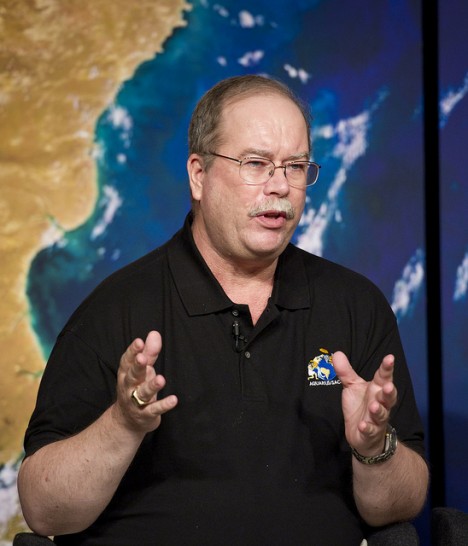
Your SPURS blogger, Eric Lindstrom, discussing the Aquarius mission.
After several weeks of your following my postings from the field, I thought it would be good to tell you a little about myself. Maybe that will help explain the weird wanderings of the blog or the subject matters I choose to write about.
Let’s start at the beginning: I grew up in Seal Beach, California, very near the ocean. It seems to me like I actually grew up on the sand and in the water. So, I am pretty well infused and enthused by the seas. This has driven me toward a broad knowledge of ocean subjects. I felt that drive vindicated when National Geographic Society tapped me as senior scientific consultant (pro bono) on their first ocean atlas project.
When did I decide to become an oceanographer? I was pretty interested in the field in middle and high school. Science seemed like where I was headed. Being a good student, I was able to get into the Massachusetts Institute of Technology. There, before I finished my freshman year, I fell in love with the Earth and Planetary Sciences Department. It was a short course in astronomy that got me hooked. They really reeled me in when I realized that Earth science was just then being revolutionized by the ideas of plate tectonics and that oceanographers at MIT were bringing back the first pictures of hydrothermal vents on the mid-ocean ridges. There was not much in the way of undergraduate education in oceanography at MIT, but lots of good basic math, physics, geology, geophysics, and research opportunities. I can date myself by recalling the glorious summer of 1976, when I stayed in Boston for the bicentennial and to do my undergraduate research project on data from Lake Ontario. The lake wasn’t salty, but it was a great little laboratory for oceanography ideas! That summer truly set me on course to pursue physical oceanography as a career (and provided my first publication with Prof. John Bennett: “A simple model of Lake Ontario’s coastal boundary layer,” in Journal of Physical Oceanography, July 1977). Most scientists remember their first publication quite fondly and I am no exception!
Graduate school at University of Washington was filled with studies and expeditions. It took me six years to get my Masters and a Doctor of Philosophy in Physical Oceanography degrees. My dissertation was on eddies in the North Atlantic Ocean. It turned out that eddies deep below the surface of the ocean can carry water across the ocean from quite distant places and arrive in the Sargasso Sea with evidence of their origins from as far afield as the Labrador Sea, the Antarctic Circumpolar Current, or the Mediterranean Sea. The idea that these origins and travels could be traced using salinity measurements was intoxicating (in a nerdy sort of a way) for a young oceanographer. I loved the data collection part of the project; being part of the right team with the right equipment in the right place at the right time to make some discovery that would move science forward. The ocean is still virtually unexplored, so every well-planned expedition has potential for great discovery. Once oceanographic expedition science is in your blood, it’s hard to give it up! I found a great opportunity for doing more expedition research by moving to Australia in 1983. The country had expanded ocean research greatly at that time due to advent of the Law of the Sea and extended Exclusive Economic Zones. Sometimes, timing is everything!
In Australia, I became engrossed in studies of the western tropical Pacific Ocean circulation and in the planning for the World Ocean Circulation Experiment (WOCE). By the end of the 1980s, the former had seen me on many expeditions near exotic tropical islands and the latter looked to be the oceanography opportunity of the 1990s. I moved back to the U.S., still working on the same projects, but with a new home base. By the mid-1990s I was the US WOCE Program Scientist in Washington, D.C. That involved organizing scientific plans, budgets, and logistics for the largest mapping of ocean waters ever undertaken, involving voyages across the globe for nearly a decade. I was bitten by the vision of global ocean observing provided by WOCE and still suffer from that fever.
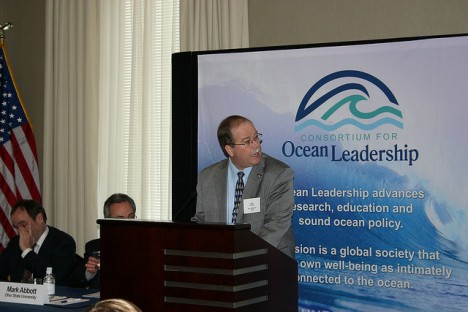
Eric, giving a talk at the Consortium for Ocean Leadership.
When the opportunity arose in 1997 to lead NASA’s Physical Oceanography Program, I had the right stuff: solid experience with the ocean, ocean programs in DC, ocean researchers in general, and virtually no heritage at all with satellite oceanography (but NASA said I could learn that on the job!)
It was in my first days at NASA HQ that I began energizing NASA’s drive toward measuring ocean salinity from space. All I had to do was enable those with the knowledge and skill to realize the dream (it certainly was not a new idea) – and prove to NASA that it was both possible and useful. And here we are today. I am back out on a research vessel, doing what I love, with Aquarius, our ocean surface salinity instrument, on orbit overhead and a whole community of scientists curious about ocean salinity and the global water cycle. It’s one small victory for this man, and one giant leap for physical oceanography.
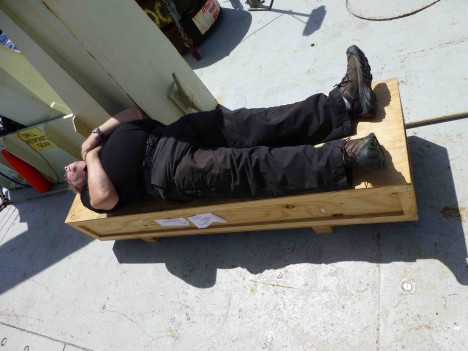
Eric, taking a break on an Argo float box after a long day of blogging at sea.
By Eric Lindstrom
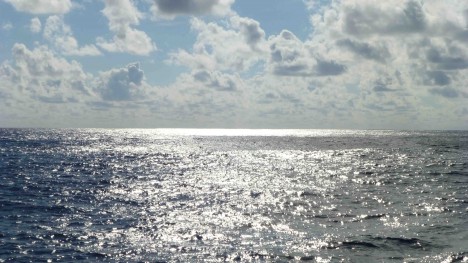
A beautiful day in the trade winds zone, with its typical cumulus clouds.
From the shipboard perspective, all we really see of the sea is the surface. Of course we can see into the water a short way, right close to the ship, but not very far. The horizon is 360 degrees and the great dome of sky seems endless.
Being that we are about a thousand miles from the nearest port, it is also fair to say that all we see from the ship is sea surface and sky. These are the shades of blue that I referred to in an earlier post. When this is all one has to see aside from the Knorr, our shipmates, and interesting oceanographic data (OK, we watch movies too!), it should come as no surprise that everyone becomes sensitive to the moods of the sea and sky. When you want a moment alone, the likely place to go is on deck, and there you are confronted with some new variation of the sea and sky.
[youtube Y4OqMnxiGzU]
We are working in what is called the trade winds zone. It is a belt of generally east and northeast winds north of the equator and east or southeast winds south of the equator that are quite steady and global in extent (in the days of sail, one’s trade depended on using routes through these reliable wind zones). In the trades zone, we might expect relatively steady 10-15 mph winds and fair skies with broken clouds. One characteristic of the fair weather cumulus clouds in the trades is that they lean over because of wind shear in the atmosphere. The blue sky dominates the evenly scattered puffy white leaning clouds that seem to all have the same base (maybe 3,000 feet above the sea).
The trade wind cumulus clouds break up the bright shades of blue on the sea surface by casting rapidly evolving shadows across the sea. The color of the sea surface certainly depends on the light reflected from the sky (a gray sky can give the ocean a grayer look) but also depends on the intrinsic color of water, which is blue.
We had few days where there seemed to be a pink hue to the sky (especially at the low sun angles of morning and late afternoon). This is likely the result of having more Saharan dust suspended in the atmosphere. It is quite common for dust storms to carry thousands of miles out over the ocean.
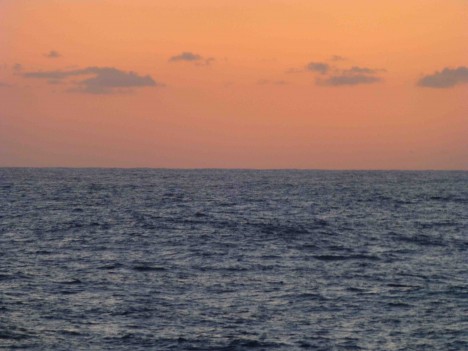
Sunset in the Sargasso, with hints of Saharan dust.
The color of the water depends on the angle at which you view it and the height of the sun. One of the cool things I see in the open ocean is that when you look down into the deep waters in the middle of a sunny day there is a radiation of sunbeams seemingly coming back at you from the depths. It gives the blue ocean a kind of jewel-like quality.
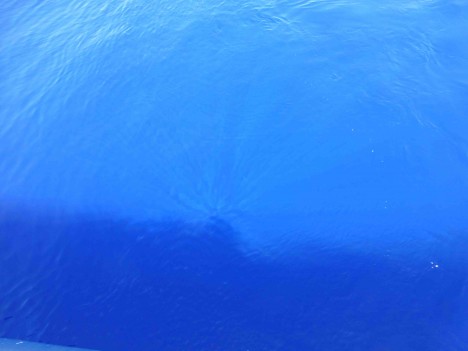
Sun beams in the Sargasso Sea.
By Eric Lindstrom
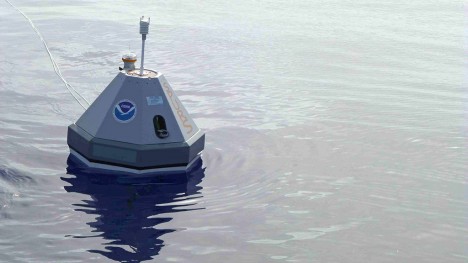
A NOAA buoy in the water.
When we are doing work at sea, it hardly seems fair for NASA to hog the limelight. We are usually offering data from satellites, not ships, moorings, or gliders. There are partner agencies in the U.S. Government who make enormous contributions to the physical oceanography enterprise. In D.C., oceanographers know these agencies as “the four N’s” – NASA, the National Oceanic and Atmospheric Administration (NOAA), the National Science Foundation (NSF), and the Navy. Because each, in its own way, contributes to the success of physical oceanography in the USA and of SPURS in particular, I am going to try to tell you about them through their contributions and through relevant posts from the field. With this post, I am going to focus on NOAA.
The 5-cent summary is that NOAA Pacific Marine Environmental Laboratory (PMEL) is proving two moorings for SPURS and the NOAA Atlantic Oceanographic and Meteorological Laboratory (AOML) is providing enhancement to their ongoing basin-wide observing system.
One way we divided us SPURS so that we could look at all the relevant time and space scales of salinity variation (minutes to years and inches to thousands of miles), was by looking at who was strong in particular areas. NOAA is the key agency when it comes to monitoring the global ocean with measurements in the water. They maintain moorings in the tropical oceans for seasonal climate prediction, Argo floats around the globe for monitoring of upper ocean temperature and salinity profiles, a global array of surface drifters for sea surface temperature and surface velocity maps….and the list goes on.
The ocean involves so many different interacting processes that no single observing tool captures the whole picture (the variety of instrumentation in SPURS is a good example). We find that different kinds of measurements used together give a more well-rounded vision that is fuller than the simple sum of the individual parts. A focused process study like SPURS takes advantage of this, and NOAA scientists were eager to be part of it. While NOAA maintains long-term monitoring arrays that record broad fluctuations, those don’t necessarily illuminate the processes that underlie the fluctuations, so the diverse measurements in SPURS add interpretive value to NOAA’s arrays. SPURS is also a testing ground to learn what particular instruments measure well (and what they don’t), and to hone sampling strategies. When we deploy Argo floats and surface drifters in SPURS, these measurements enhance our knowledge of salinity in our study area, but the instruments will also remain in place for years to come and contribute to the Atlantic Ocean monitoring array maintained by NOAA.
AOML started a new XBT transect between Cape Town and New York City (referred as AX08) on August 18, with XBTs deployed every 15.5 miles (25 kilometers). This is the third of five AX08 realizations that will be done on 2012. There are five realizations planned for 2013. A total of 550 XBTs are deployed on each realization.
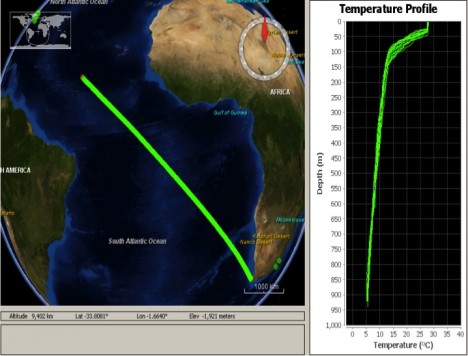
Enhancement XBT line for SPURS.
A planned NOAA expedition to in September with some SPURS-related activity had to be postponed due to mechanical malfunction of the ship, the R/V Ron Brown.
It’s very exciting for us to help PMEL by deploying two of their “Prawler” (Profiling Crawler) moorings in SPURS. The Prawler uses the motion of the waves to provide lift for free: each time a wave lifts the mooring, the instrument holds tight to the wire with a ratchet and goes up. When the wave trough passes, the ratchet releases and the round fin keeps it from going down, so it “crawls” up the wire in steps. When it gets to the top, it free-falls back down the wire, making a profile of temperature and salinity. Since battery power is one of the main limiting factors in designing ocean instruments, the Prawler’s use of wave energy lets it work for much longer than if it had to carry a large battery pack and motor. A full and fascinating description is available here.
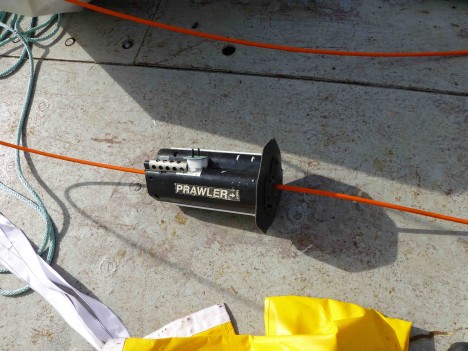
A Prawler on a wire.
To summarize, in order for NASA to advance the science of physical oceanography, we work closely with other federal agencies, such as NOAA, to bring the correct mix of measurements and technology to the field. SPURS is most definitely a team effort!
By Eric Lindstrom
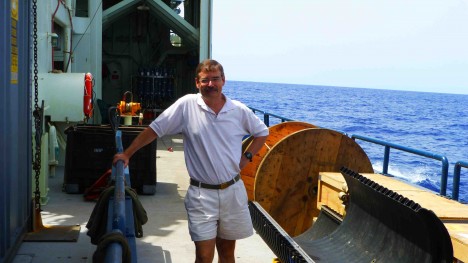
SPURS Chief Scientist Ray Schmitt.
SPURS Chief Scientist Ray Schmitt has been thinking about the salt in the ocean for a long time. He did his PhD thesis on an unusual form of mixing called “salt fingers,” which we will discuss in a later post. This small scale mixing process led him to consider the origins of the ocean salinity contrasts that we see around the world.
It’s fairly obvious that salty waters arise from high evaporation regions and fresher waters originate from high rainfall areas or river flows into the ocean. But it turns out that accurate estimates of evaporation and rainfall over the ocean were hard to come by. For a long time, it was a relatively neglected research topic. Many meteorologists were only concerned about how much it rained on land and few seemed to care if it rained on the ocean. Pulling together the best data he could, Ray found that, in fact, the ocean completely dominated the global water cycle. The terrestrial part, so important to us on a daily basis, is a much smaller piece. The oceans hold 97 percent of the Earths free water, the atmosphere only 0.001 percent. The oceans provide 86 percent of global evaporation and receive 78 percent of all rainfall. The total of all river flows into the ocean sums to less than 10 percent of global ocean evaporation. Clearly, if one wants to find out what the water cycle is doing, one should be looking at the oceans. The traditional fixation on the terrestrial water cycle is understandable, but risks missing the big picture. It seems that the tail is wagging the dog in terms of research on the global water cycle!
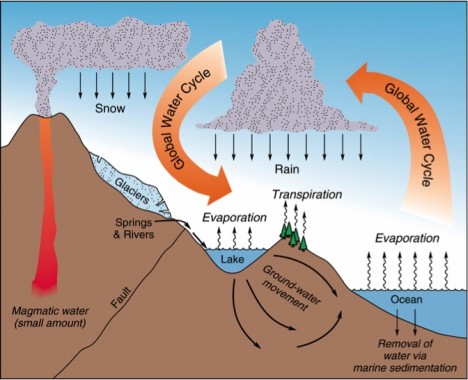
A traditional view of the water cycle.
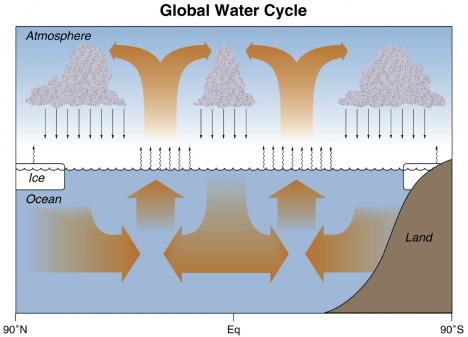
The oceanographers’ view of the water cycle.
Of course, one of the most important questions for climate change is what the water cycle will do with continued warming. Basic physics tells us that a warmer atmosphere will hold more water vapor, so an intensified water cycle is expected. Oceanographers should be able to assess any trend in the water cycle if we do a good job in monitoring ocean salinity. On land, man has altered every watershed with dams, groundwater irrigation, deforestation and human consumption. But the ocean’s mostly unaltered and its salinity field provides insight into the vast majority of the pristine natural water cycle. The ocean has its own rain gauge in the form of salinity, and our task in SPURS is to learn how to read it.
The combination of the global coverage from Aquarius for surface salinity, detailed process studies in the ocean like SPURS, and sophisticated high-resolution computer models working in concert open up the oceanic water cycle to careful scientific examination.
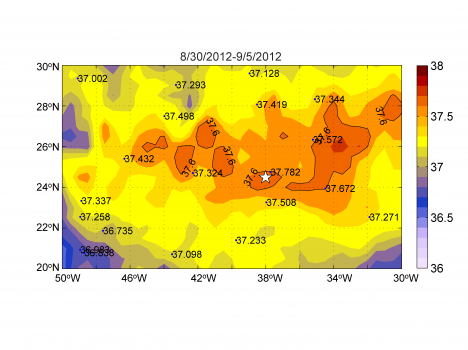
Aquarius salinity data from the first week of September 2012. (Credit: Oleg Melnichenko at University of Hawaii IPRC.)
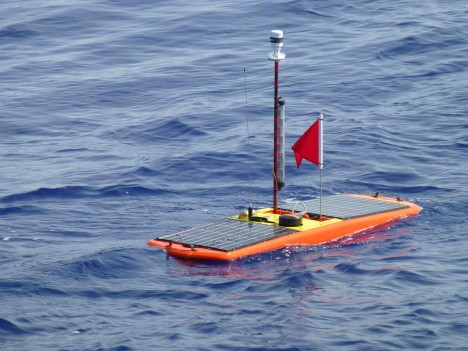
A SPURS Waveglider begins its journey to study upper ocean salinity.
We are beginning to deploy the array of instruments on the ship and they are starting their year-long mission to examine the ocean salinity variations. Our challenge is to understand the detailed picture of salinity that will be painted by the various sensors and to make sense of this in the larger picture of the global water cycle.
