By Alek Petty
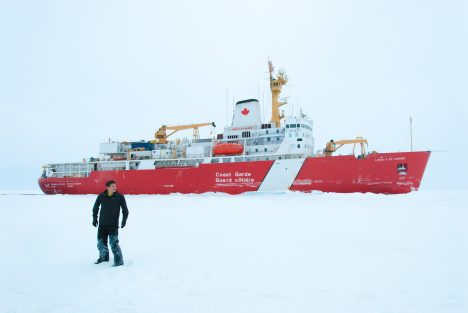
Your blogger, Alek Petty, out on the ice during the 2014 Joint Ocean Ice Study research expedition, with the Louis S. St. Laurent in the background.
Hello and welcome to my new blog. I’m Alek Petty, a sea ice scientist at NASA’s Goddard Space Flight Center, currently making my way to the northern coast of Canada (a small town called Kugluktuk) to embark on the 2016 Joint Ocean Ice Study (JOIS) – a research expedition around the Arctic Ocean’s Beaufort Gyre. The Beaufort Gyre is a slowly-rotating icy body of water north of Alaska (see map), which covers an area roughly ten times the size of Lake Michigan and stores a significant fraction of the Arctic Ocean’s freshwater.
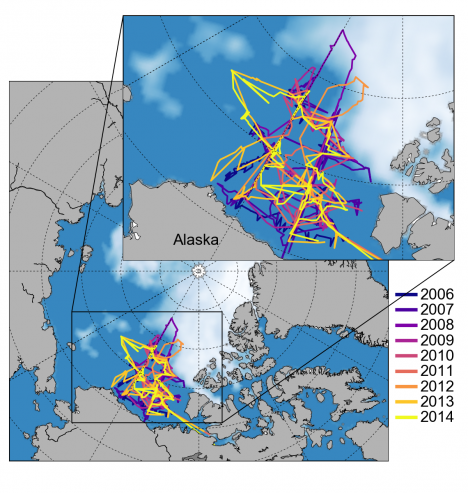
Cruise tracks from previous JOIS expeditions during 2006-2014 and the sea ice concentration around this year’s summertime minimum extent on Sept. 10 (from NSIDC).
The expedition I’m going to be on has occurred every summer since 2003 – coinciding with the Arctic annual sea ice minimum, which typically happens in September – providing us Arctic scientists with a unique opportunity to monitor this harsh, but climatically significant region. The goal of these expeditions is to better understand the Beaufort Gyre’s circulation, freshwater content, water mass properties and biota distributions. I’ve been lucky enough to be invited on my second expedition to support this year’s planned sea ice observations.
We will be taken around the Beaufort Gyre by the Louis S St. Laurent, a Canadian Coast Guard icebreaker specially designed to smash its way through the sea ice covered oceans (sea ice can be several meters thick in places). About a week ago, we observed this year’s sea ice minimum, which tied 2007 for the second lowest on record. The Arctic sea ice declines over the past decades have meant yachts and even a luxury cruise liner (with the aid of an icebreaker, they often leave that bit out in the news stories) are now navigating through the southern Arctic Ocean, including the newly opened Northwest Passage – made famous by Franklin’s failed traverse back in 1845 (when the ice was a lot thicker) and commemorated in this heartfelt tune by Canadian folk singer Stan Rogers.
While the diminished Arctic sea ice cover has made navigation easier than it used to be, especially for icebreakers, one of the primary objectives of our expedition is to deploy buoys into the ice that can collect measurements of the sea ice-atmosphere-ocean system as they drift through the Arctic Ocean (ice-tethered profilers). One of our initial goals will therefore be to search for sea ice thick enough to ensure that the ice isn’t going to melt out any time soon. One of my primary activities over the next few weeks will be to observe the extent and magnitude of sea ice freeze-up as we make our way north, the days begin to shorten, and the temperatures start to drop.
I look forward to giving you a better overview of what the trip is all about in future blog posts (we’re not just scouting for polar bears, promise), including some background to all the various scientific projects being undertaken. Stay tuned!
By Eric Lindstrom
Are we there yet?
A six-week voyage on the open ocean is not for everyone. On this trip we had plenty of veterans and few first timers. Channel fever is commonly considered something that happens at the end of a voyage as you head for port. It is maybe easier for those of you ashore to picture as akin to spring fever at the end of winter. I would like to describe a more comprehensive theory of voyage feelings that is more akin to the five stages of grief. Maybe it should be called the five stages of channel fever?
For grief, the five stages are denial, anger, bargaining, depression and acceptance. For channel fever, the five stages are sickness, interest, boredom, excitement, and port. Like grief, they are not some stops along a linear timeline (except maybe port!), but tools to help us recognize what we are thinking and feeling. In this theory of channel fever it occupies the entire voyage.
Sickness
Getting your sea legs is the first hurdle of the voyage. It starts in the harbor channel and impacts people in different ways. Headaches, queasiness, and overwhelming sleepiness are all symptoms. This phase is definitely a downer and modern medicine has sought to treat it with drugs. Some unfortunates never get past this stage.
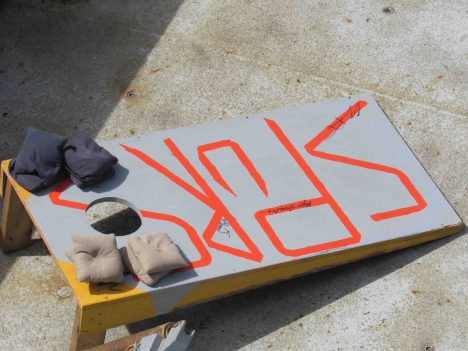
A game devised to forestall channel fever.
Interest
A core feeling early in voyages is interest in all the stuff that other people are doing that of which you have not yet become familiar. The ship is small, so any new things to see or do certainly focus your attention. Good mariners can make the simplest chores and routines the subject of great interest and focus. They know that you should hold this feeling as long as possible. It’s deadly if you move on to boredom too soon. Maybe my blogging style gains strength from this stage of channel fever?
Two teams, eight bean bags and two targets = hours of amusement.
Boredom
Once you have mastered your work and everyone else’s chores, interest fades and boredom takes over. Ideally, you would like this feeling to be minimized. Therefore, sea veterans are adept at invention of new games, procedures, routines, and making anything that is even halfway interesting last as long as possible. You may have wondered why people come back from sea with weird new skills like knot tying or macramé. It’s because of trying to fight boredom!
End of a long day of packing and dreaming of home.
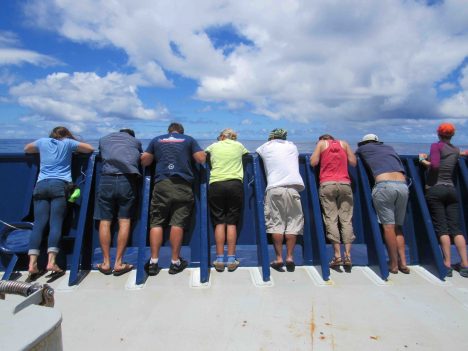
Excitement
This is the classic feeling of channel fever and its penultimate stage. Long after sickness, interest, and boredom, it is usually the time when all your hopes hang on finishing the trip and getting back to life ashore. Usually this stage alone is what people refer to as channel fever because the emotional symptoms are closely associated only with proximity to voyage end and no other known cause.
Port
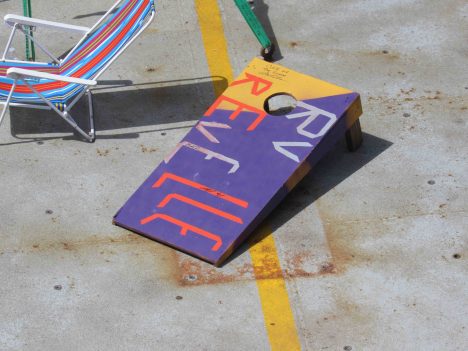
The final stage of channel fever and resolution (in my theory) of the malady come with arrival in port and being homeward bound. Resolution (port) is often a highly celebrated event. The modern cure for channel fever is solid ground and a cold beer. Really, we don’t know if beer has anything to do with this, however there seems to be a close association between beer and miraculous recoveries in port! The science party on R/V Revelle is hosting a post-voyage happy hour ashore later in the day we arrive, just to make sure everyone receives the cure.
Cheers!
It’s day 11 of the NASA ORACLES Student Shadowing Program and I’m still bursting with excitement; what an absolute wonder to watch the team in action. As a PhD student from South Africa it’s great to be exposed to the latest research in the field of atmospheric science and have the opportunity to be submerged in the brilliance of the science on the go.
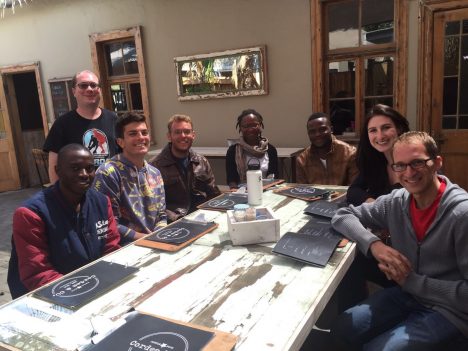
Danitza Klopper (second from right) with a group of NASA scientists and shadowing Namibian and South African students. Photo credit: Cordes Cafe staff
Coordinating a group of over 100 vivacious and enthusiastic scientists, engineers, data specialists, pilots, flight crew and technicians is a mammoth task which seems to be taken in the stride of the principal investigators of the ORACLES mission team. Not to mention hosting seven eager students and keeping us busy. We feel like kids again, in the shadows of our heroes, smitten and in awe; doting our NASA backpacks and stickers on our laptops, eagerly watching them fiddle with their high-tech instruments and programs. One could expect to be completely overwhelmed and obscured with so much brainpower in one room, but we were met by a high-spirited and humble group of human beings who are actively pouring their insight, knowledge and passion into this mission to help explain the complex interactions between aerosols and clouds.
We get to see the hard work that goes into it all, and although sleep is a valuable commodity and “hard down days” are sacred, when there’s work to be done fingers tap away at keyboards, markers squeak on drawing boards and you can all but smell the firing of neurons. What an environment to be submerged in! Networking, exchanging and watching science in action; this is an invaluable experience that will never be forgotten and illustrates the hard work that goes into these missions which make large amounts of invaluable data available to researchers around the world to interpret the mind-boggling nature of the atmosphere.
In true NASA spirit I thought it would be apt to describe the NASA-ORACLES team with the accronym, SUPERCOOL (Scientists who Understand that Passion and pERseverance Coincides with resOlving the Obscure and unexpLained).
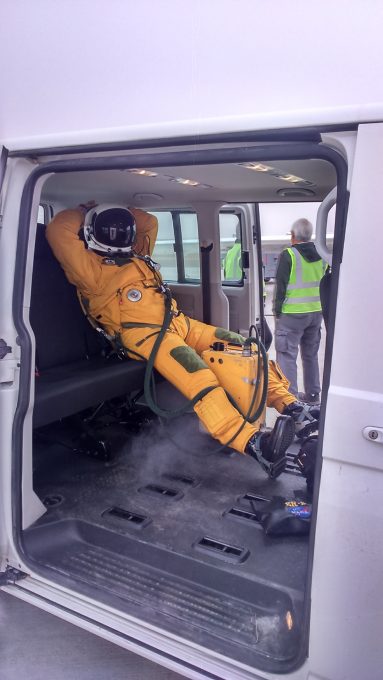
ER-2 pilot in the van before flight. Credit: Danitza Klopper
By Eric Lindstrom
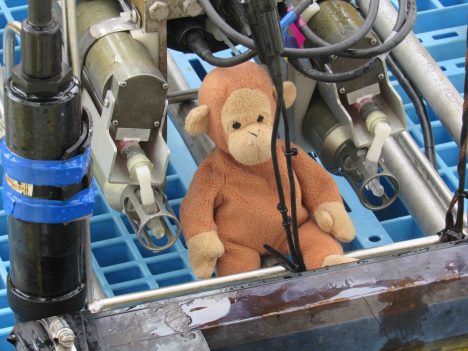
Our mixed-up Monkey looks everywhere for microstructure probes.
One of the challenges of oceanography (and many other sciences) is telling a coherent story of the environment across a vast space of space and time scales. For example, cosmologists tell the story of the universe from subatomic particles to the breath of the visible universe and from first nanoseconds of the big bang to billions of light years.
For SPURS-2, mixing is obviously an important factor in telling the story of how rainwater combines with seawater to bring about the east Pacific fresh pool that we see from space. That mixing primarily happens in the upper ocean at scales of centimeters, where turbulence is caused by phenomena such as wave breaking, current shears, convection in unstable layers, and the rain itself hitting the sea surface. In order to understand the big picture, we need to estimate the magnitude and location of the centimeter scale turbulent mixing.
Over many decades oceanographers have become quite adept at estimating mixing from measurements of centimeter scale temperature, salinity, and velocity variations – otherwise known as microstructure. Now, along with our standard instruments for measuring temperature and salinity, we also deploy microstructure probes – very fast sampling sensors of ocean variables.
It is beyond the scope of this blog to explain how microstructure measurements are transformed into ocean mixing estimates, but it is one of the more helpful developments in modern oceanography.
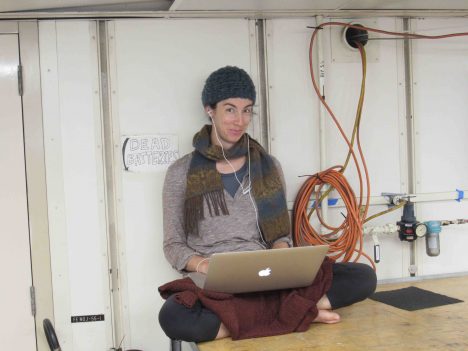
Caitlin Whalen, working on her review article for the Bulletin of the American Meteorological Society.
Caitlin Whalen of the University of Washington Applied Physics Laboratory (APL) is an expert in ocean mixing. While on the SPURS-2 expedition, she has contributed to a review paper on the subject for the Bulletin of the American Meteorological Society. During SPURS-2 she oversaw the addition of the Seagliders to the Lagrangian experiment.
The Seagliders will provide us with a picture of how the turbulence in the SPURS-2 region varies at deeper depths and over a longer time period than we will learn form our ship-based measurements. Over the next six months the Seagliders will repeatedly travel between the ocean surface and a depth of one kilometer, collecting data during each trip. From this data we will be able to determine how the turbulence in the ocean varies with depth and how it is related to other events such as heavy rain and the continuously changing density patterns of the water. Knowing where and when turbulence occurs will help us understand how the fresh rainwater eventually mixes deep into the salty ocean.
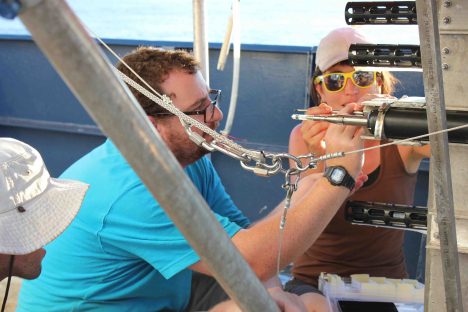
Dan Clark and Kyla Drushka of APL make final adjustments of the SSP microstructure probes.
Kyla Drushka and Suneil Iyer, also from APL, have deployed microstructure probes on the Surface Salinity Profiler (SSP). They will try to determine, from these measurements and the vertical structure of salinity in the upper meter of the ocean, how quickly rain-formed low salinity lenses are mixed into the upper ocean during individual events. Their big challenge during SPURS-2 has been to get a snapshot of salinity lenses at various stages of their lifetime. Being in the right place (low wind conditions) at the right time (just as rain begins to fall) with the right gear (SSP) actually deployed has been challenging. Still, I am sure we have collected more such data this expedition than previously existed. Finally enough data to find great exemplars for discussion in the scientific community! This is a wonderfully “fresh” topic for a graduate student like Suneil to tackle.
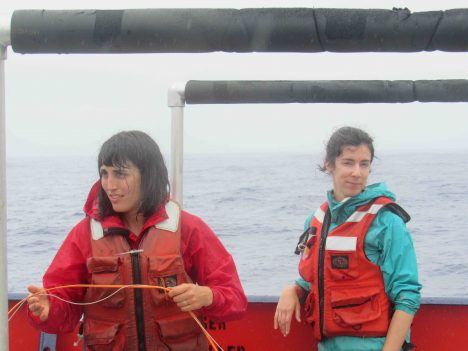
Kyla Drushka and Caitlin Whalen from APL, hard at work in the rain.
Just about everyone doing analysis of SPURS-2 data will use estimates of mixing in some way or another in the telling of their part of the story of salinity in the eastern tropical Pacific. It will be part of any salinity budget calculations and used in the description of salinity fronts. It will be an essential part of the story in explaining the seasonal patterns of salinity we see from space. The story of the smallest scales in the ocean meets up with the story of the planet as seen from space!
By Eric Lindstrom
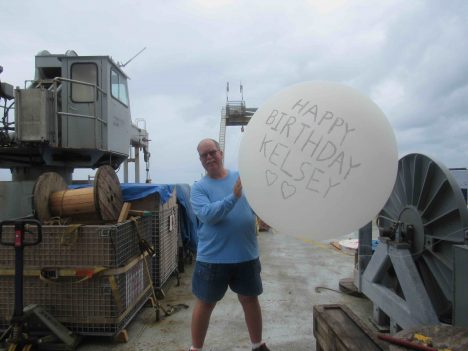
Your blogger, Eric Lindstrom, sending his daughter Kelsey a birthday balloon.
SPURS-2 on R/V Revelle has been a balloon bonanza. We have been profiling the atmosphere every six hours with radiosondes (AKA; sondes) attached to helium filled weather balloons. The sondes measure the temperature and humidity profiles in the atmosphere are transmitted via radio signal back to a receiver on the ship. They are tracked by GPS so also provide height and wind (via their changing position). The sondes are lost after the balloon pops in the upper atmosphere (over 12.4 miles –20 kilometers– up). The profile data of the atmosphere are key to studying convection, clouds, rain, and stability in the tropical atmosphere. Modern meteorology depends on hundreds of balloon launches worldwide every 12 hours. Such observations over the ocean are much less common and still provide for scientific discovery.
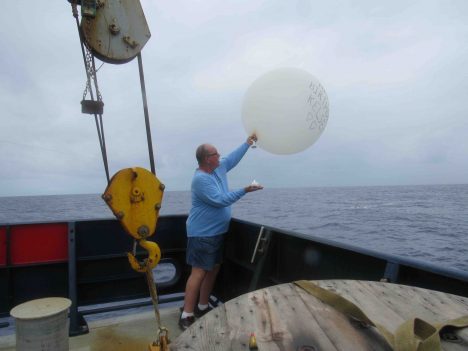
Kelsey’s balloon, floating away.
The regular weather balloon launches have also been a great way to send our birthday wishes home to friends and family. Today’s blog and balloon launch come with a hearty “Happy Birthday” to my daughter, Kelsey, in Everett, Washington! Kelsey, your birthday balloon made it to more than 21,000 meters (far into the stratosphere) and an atmospheric pressure of 44 millibars (1011.7 millibars at sea level here).
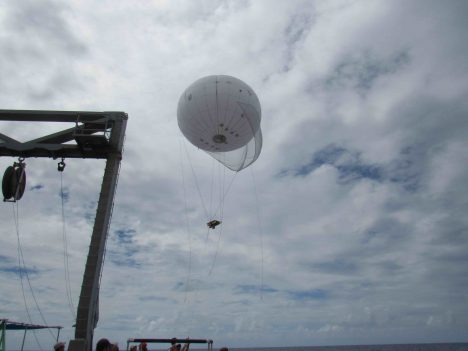
The Lighter Than Air Infrared System, just after launch.
To study sea surface temperature variation on small scales, we have deployed the Lighter-Than-Air InfraRed System (LTAIRS). LTAIRS is a large, re-usable helium-filled balloon tethered to the ship with an instrument package hanging below it. The APL team lead by Andy Jessup has suspended a camera package that images the temperature patterns on the sea surface. The LTAIRS package is deployed when there are relatively steady light winds. It is quite a drama if the LTAIRS changes height or direction rapidly. This can happen, for example, if it is launched in the heat of the day and quickly loses lift in the rapid cooling after sunset (the balloon loses lift as the helium cools). Or, if the wind shifts rapidly during a rain shower the balloon can quickly drift back over the ship bringing its tether into the ship (think tangles!). We want no drama with an expensive ($50,000 worth) camera sitting just below the balloon. However, it is oceanography and any deployed equipment is at risk of loss. Innovative observations with potential for discovery (a bonanza!) are the reward for taking and managing the risk of the balloon acrobatics. So far there are very interesting variations and patterns in surface temperature during rain events. It will take considerable post-expedition analysis to pull the whole story together, but these results look extremely promising.
For ballooning we have quite a supply of helium aboard. For many years the world’s supply of helium has been under pressure, with usage depleting national reserves of this noble gas. Recently new supplies have been discovered in Africa, but helium is another one of those resources like oil, fresh water, or fish that have come under global management for human uses. Its supply closely parallels that of natural gas from which it is separated. Conservation activities and rising cost seems the logical outcome for the long term. Helium, many other resources, will see the times of bonanza and bust as we find and use our way through the reserves and discoveries.
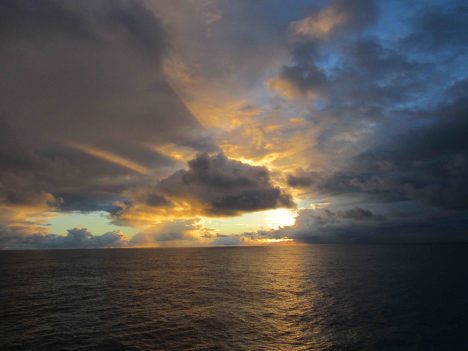
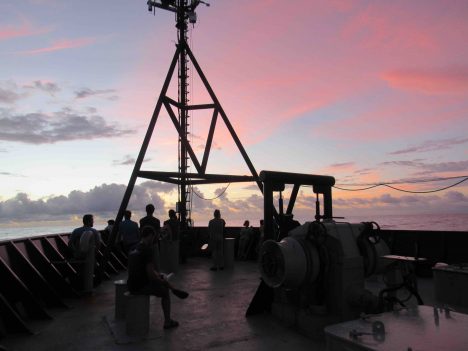
Unrelated to the balloons, but here’s a photo of a beautiful sunset at sea.
Overall, the ballooning on R/V Revelle for SPURS-2 has been very successful and highly informative – a real bonanza of scientific information. Raymond Graham will get his Masters degree puzzling over the atmospheric profiles. Andy Jessup will spend weeks glued to the computer puzzling over the patterns in the LTAIRS IR images. And every one had fun at some point in the expedition filling or launching a balloon. Very uplifting all around!
