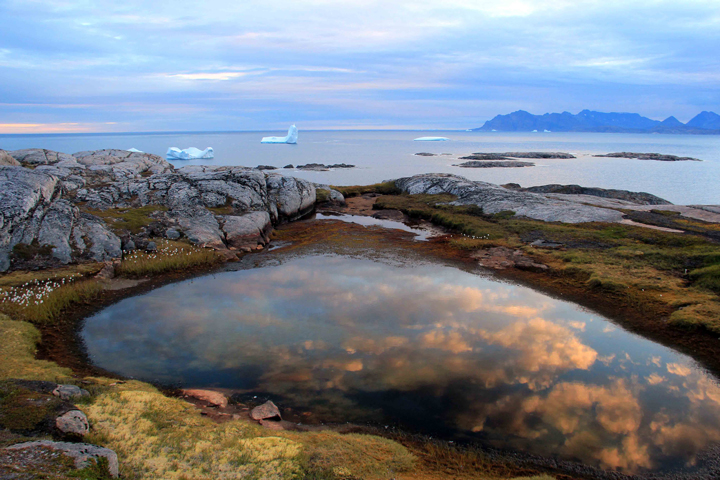
Nice cloud reflection on my last evening hike near the old harbor of Kulusuk.
Hi there,
Last blog post of for this field season, as Olivia mentioned in her science post, we were able to collect an important amount of high-quality data to further our knowledge of firn aquifers and try to answer the following research questions:
- How fast is the water flowing in the firn aquifers? How permeable is the aquifer?
- How old is the aquifer? Is it growing inland from year to year?
- How much water is contained in it?
- How fast the meltwater infiltrates from the surface to replenish the aquifer?
- What is the depth to the water table and how thick is the aquifer?
To learn more on how we try to answer these questions, I invite you to read Olivia’s post where each method is described in more details.
To wrap up, I am using bullet points and I am dividing them into themes: weather, camping, and science.
Weather:
- 20 days spent on the ice (2 more than last year!): 18 sunny days and 2 overcast days
- Less than 5 knots wind on average. Windiest morning being the day when we moved our camp downstream to add a bit of challenge to set up tents.
- No significant snowfalls this year – only a few snow flakes!
- Daily air temperature around 0°C in average with our coldest nights at -7°C (in our last days) -> warmer on average compared to last summer therefore a bit slushier
Camping:
- No polar bear encounter!
- 2 bear-trip-wire false alarms at night, which scared us but only for a few seconds!
- 60 Gallons of fuel consumed between our snowmobile and our generators
- 200-km added on the snowmobile odometer
- About 90 dehydrated meals eaten with best pick for this year being “Beef Stew” and “Lasagna with meat sauce”. The least favorite was, surprisingly, “Biscuits and gravy”
- Hundreds of instant coffee, hot chocolates, ciders…consumed
- Few dozen of hot water bottles being brought to our sleeping bag to keep us warm during the 20 nights camping.
- Bunch of hand warmers being used for hand and toes or to keep instruments and laptops warm
Science:
- Long days typically 9 am to 7-8 pm.
- 12 seismic lines (forward and reverse lines) done with about 4000 hammer swings including 48 30-stack shots to get ourselves fit!
- 12 MRS sites visited with a mixed of revisit from 2015 and new sites
- About 120 m of ice cores analyzed (at 3 different locations)
- A few hundreds of water and ice samples obtained to be analyze their chemistry back at the lab (~ 80 L of water)
- 150 km of ground-penetrating radar data collected with a depth to the water table oscillating between 25 feet and 90 feet spatially.
- 1 year of weather station data collected including air temperature, pressure, long and short wave radiations, surface changes…
- 1 year of water-level and firn temperatures recorded in conjunction to the weather data
- 5 GPS base stations to measure surface velocities
- Two logging stations and one weather station dug out and raised up at the surface.
- One new logging station installed to measure water-table level changes, compaction rate and air temperature.
- 6 batteries recharged for powering our logging stations between Aug 2016 and Aug 2017 –- knock on wood!
- 18,000 liters (~280 showers) of water pumped out the aquifer during a 5-h pump test. At a rate of 1 liter per second! We did several pumping tests for a total of 90,000 liters.
- A total of ~ 100 GB of data collected (all methods combined)
That is about it for our fieldwork summary, below, I have tried to summarize our work with photos in a chronological order. I hope you enjoyed reading the different blog posts and on the behalf of our team, I would like to thank you very much for following our journey in Southeast Greenland.
All the best and see you next time,
Clém

Preparing our first sling load at the airport (left), ready to be picked up by the helicopter a few minutes later (right)
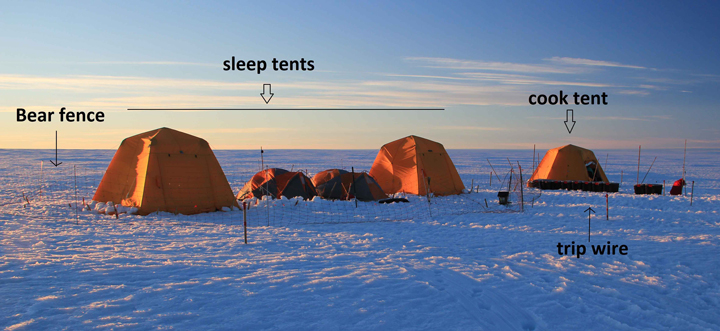
Setup of our bear-proof camp. First, a trip wire which if tripped, triggers a loud alarm (sounds like a car alarm) and warn us about a possible encounter. The second layer of protection is a fence to shock the bear, and everyone had bear horns and bear spray. But we also carried a rifle in case the previous methods failed to scare the bear away.
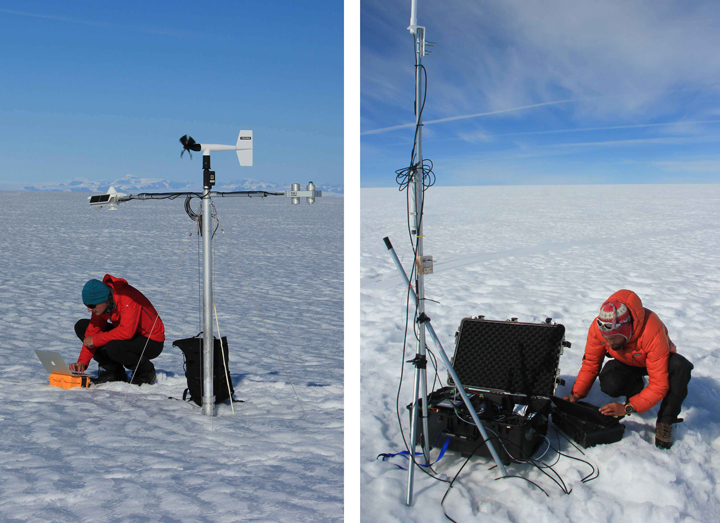
Downloading data from both the Utrecht weather station (left) and our other station logging 50 temperatures in the firn and water-table level changes (right).
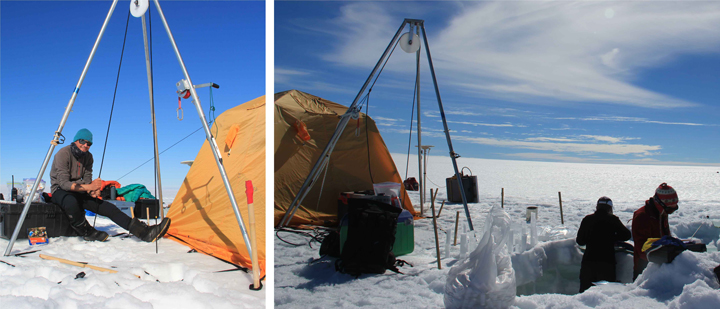
Drilling (left) and processing the firn and ice cores (right).
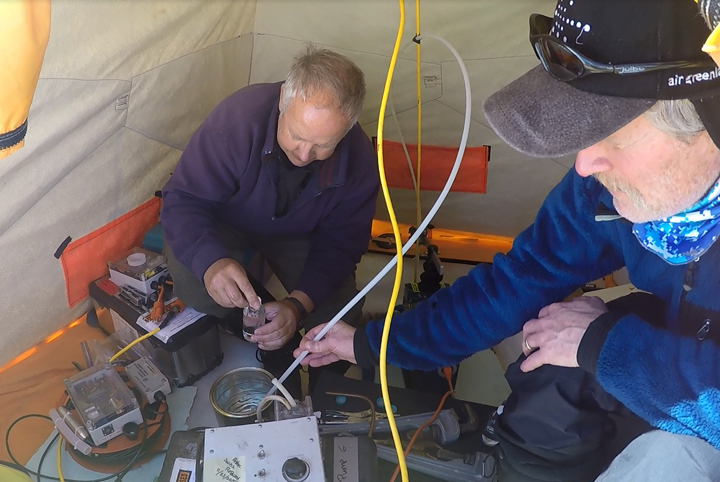
Kip and Rick sampling water from the firn aquifer.
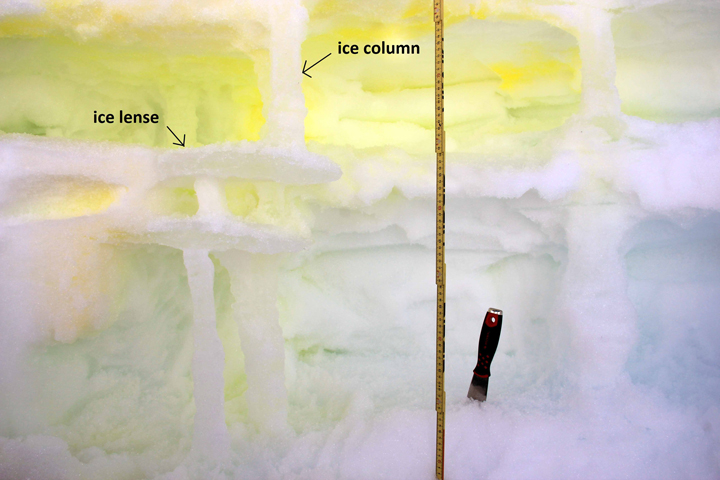
Excavating ice columns and ice lenses after spraying neon-green dye at the surface to look at water infiltration processes.
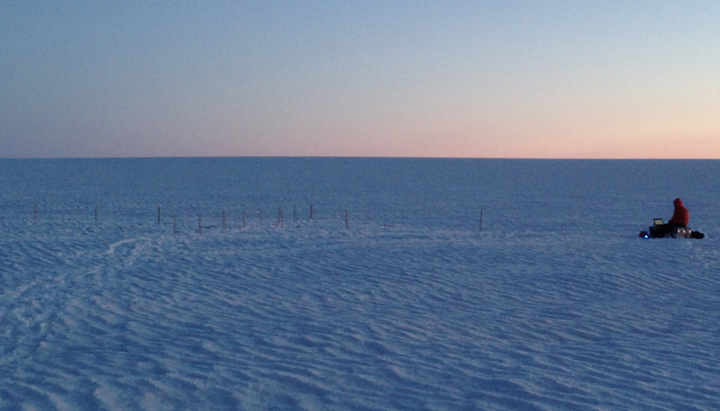
Working after dinner on a small-scale seismic survey in nice the evening light.
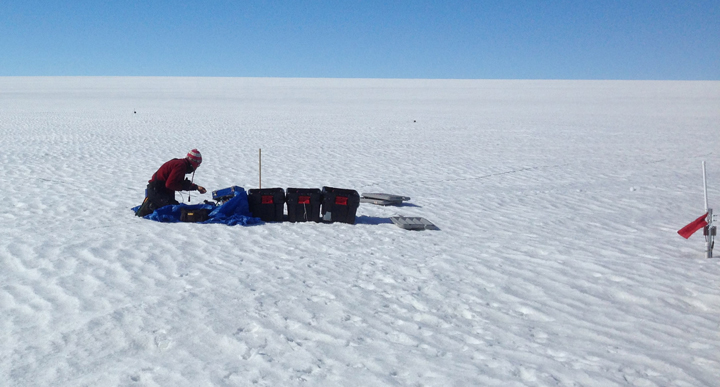
Getting the MRS measurement started after setting up the 80 by 80 m loop. On the right, one of our logging station after one year of data collection, only the top of the mast (ARGOS antenna) is above the snow surface.
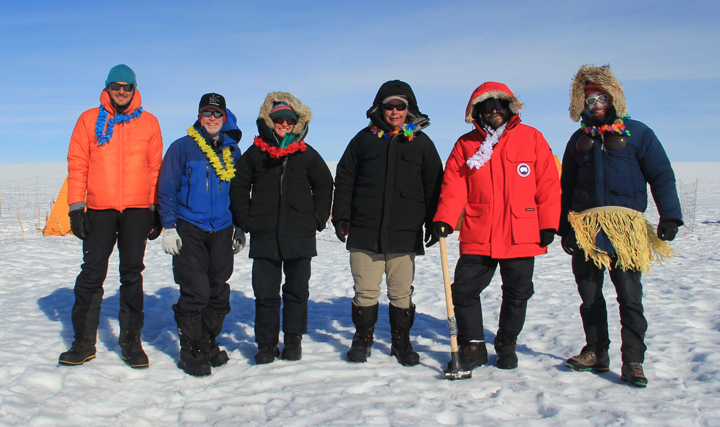
Team photo on our last day with team members being hot in their ECW (extreme cold weather) gear! Actually, the tropical weather out there motivated us to pull out our leis too 😉
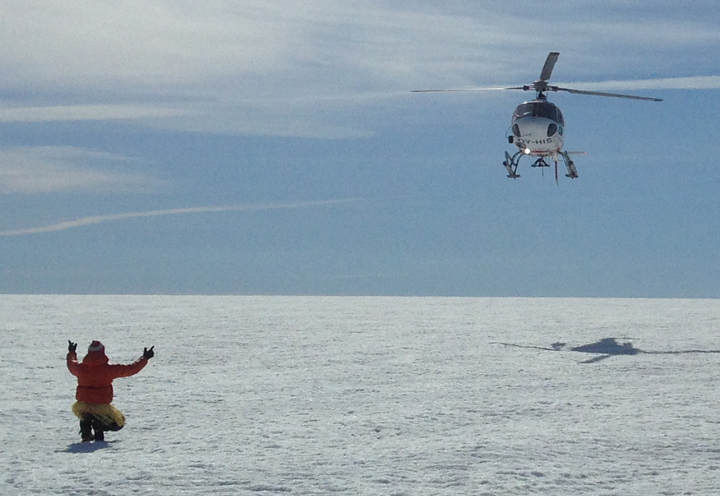
Aloha! After 20 days of work, the helicopter is coming back to get us, we greet with Hawaiian style!
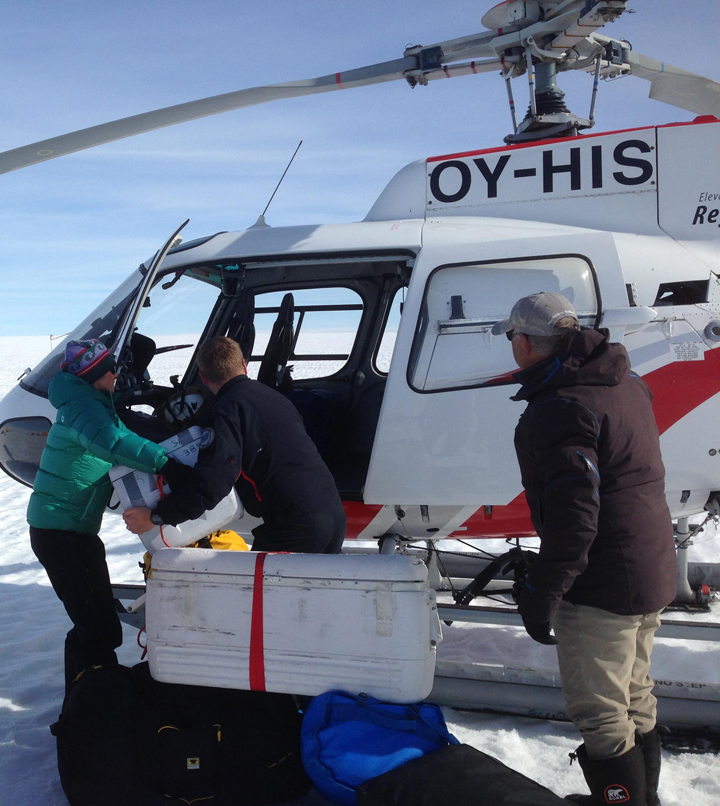
Olivia hands our precious water samples to Johannes for loading them in the helicopter as our first priority.
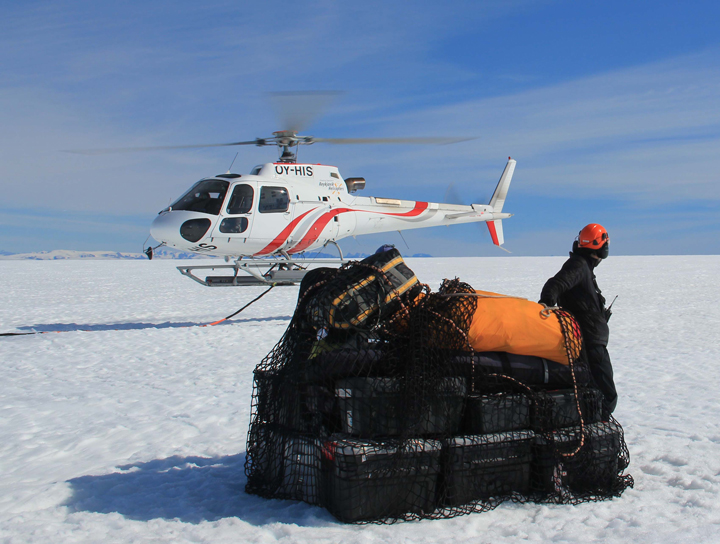
Nick (orange helmet) has the last sling load ready to go and is getting prepared to hook it on to the cable attached to the helicopter.
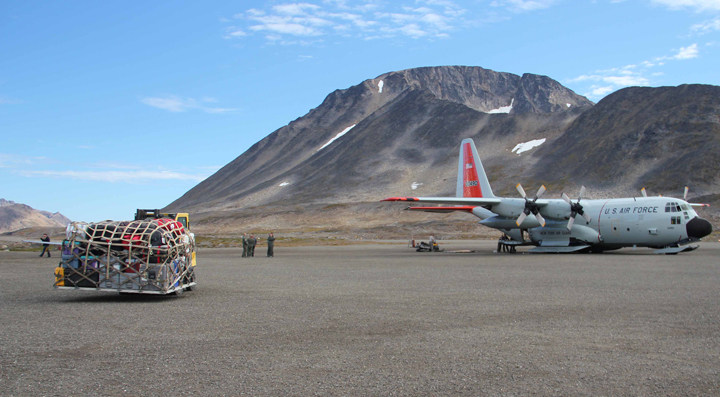
Back in Kulusuk, we spent a few days packing up the equipment. On the last day a LC-130 came from Kangerlussuaq to pick up a few thousand pounds of equipment. You can barely see the small forklift from the airport moving the Air-Force pallet at the back of the plane.
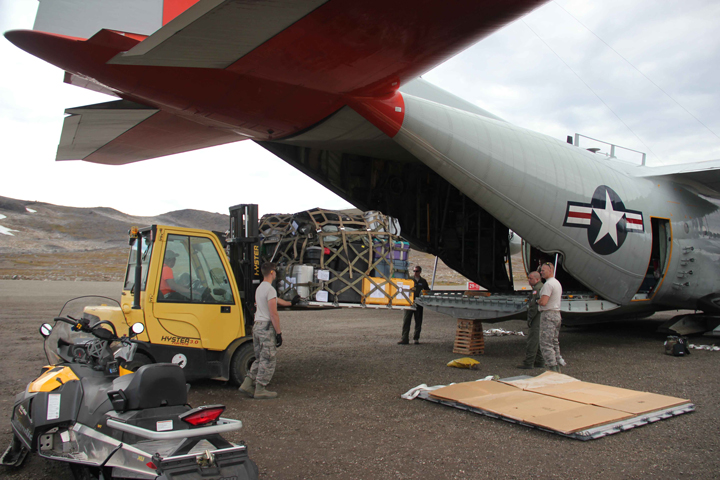
Loading up the science equipment into the plane.
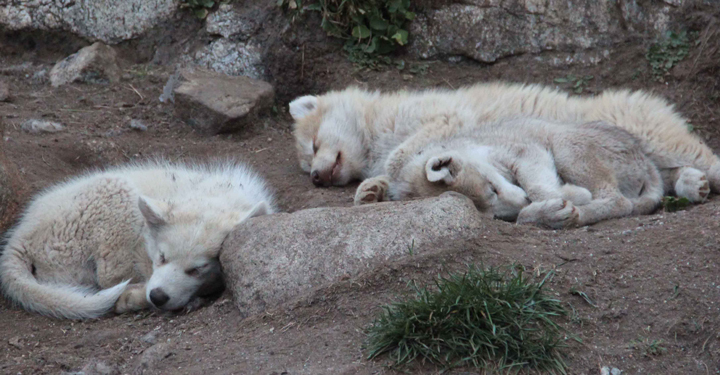
Peaceful and sleepy husky puppies in the evening.
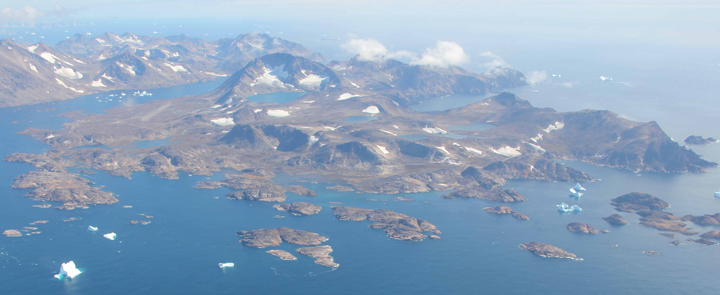
View of the Kulusuk Island from the air. At the left you can see the airport runway and on the right, you might be able to spot the DYE-4 station.


Thank you for this amazing report of the work you are doing. The photographs made it real. Thank you for tracking and sharing!