PMEL Aerosol Group
Aerosols are another name for particulate matter in the atmosphere. Aerosols are important because in clear skies they can scatter sunlight back to space can act to help cool the planet. Aerosols are also important because they can act as a site for water to condense on and form cloud particles. Particles that water can condense on are called Cloud Condensation Nuclei, CCN. In fact the concentration of CCN can greatly affect the optical properties of the cloud that is formed when air is lifted and cooled. If there are a small number of CCN the resulting cloud will have a small number of large droplets. If there are a much larger number of CCN the resulting cloud will have a large number of small droplets. Even though the liquid water concentration in both clouds is the same, the cloud with the large number of small droplets will be much whiter, and reflect more sunlight then the cloud with the small number of large droplets.
It is believed that Aerosols can thus counteract some of the present and future greenhouse warming, and it is vital to understand the processes that create and modify aerosols in the marine atmosphere.
Our group from NOAA-PMEL and the University of Washington JISAO is making measurements of the physical, chemical and optical properties of the aerosols in the marine atmosphere.
The following is a photo tour of some of our instrumentation
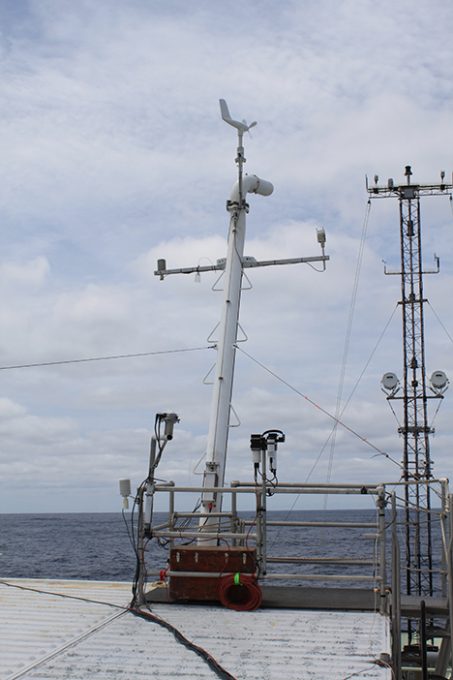
Our aerosol inlet at the top of one of our lab-vans. Our inlet is aerodynamically designed and has a computer controlled motor to keep the inlet pointed into the wind so the large particles do not impact on the side of the inlet. Photo: Jim Johnson
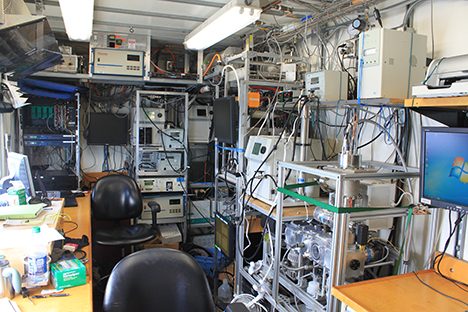
This is the inside of one of our aerosol vans with assorted particle counters, and several devices to measure the particle size spectrum. Photo: Jim Johnson
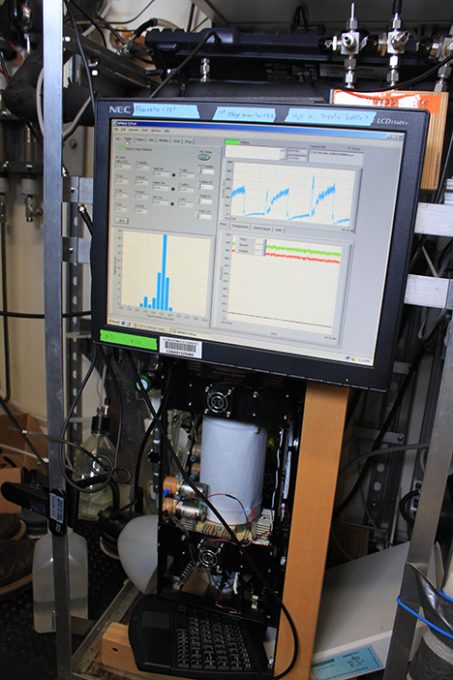
Our Cloud Condensation Nuclei Counter, CCNC, an instrument that takes sample air and raises the humidity to various levels that are just above the condensation point, then it measures concentration of water drops that are formed. Photo: Jim Johnson
Another activity is to help with the launch of the weather balloons. The radiosonde attached to the balloon measures temperature, relative humidity and pressure. The radiosonde also receives GPS to track its motion as it ascends, so that a vertical profile of the horizontal winds can also be derived.
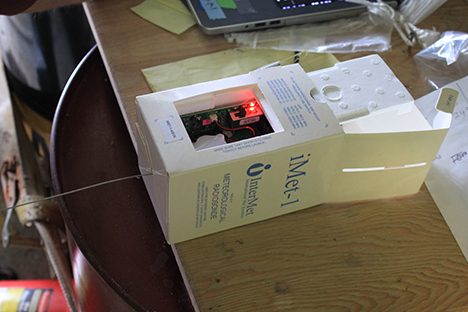
Preparing the radiosonde for launch. Photo: Jim Johnson
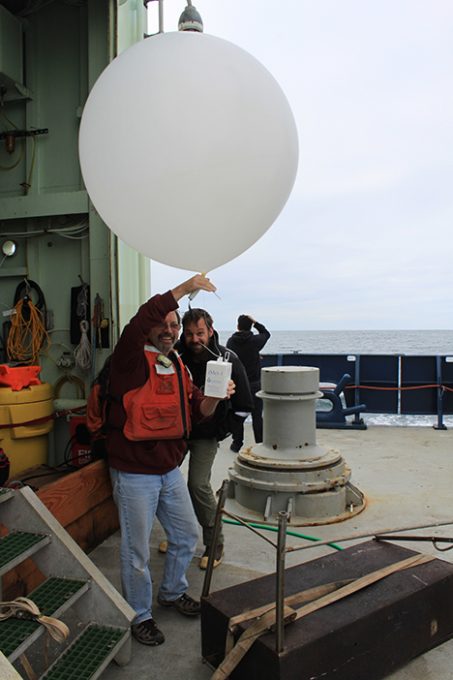
A weather balloon is filled with helium and the radiosonde is attached. Photo: Jim Johnson
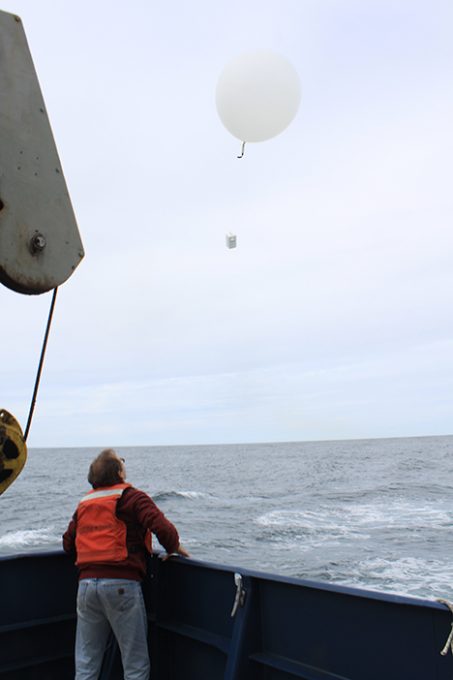
The balloon and radiosonde are walked to the back of the ship’s fantail and released. As the package rises it sends back the data by a radio link to make a vertical profile of temperature, humidity and winds. Photo: Jim Johnson
Written by Jim Johnson
By Walt Meier
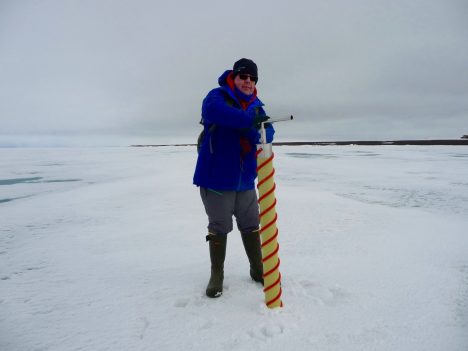
Walt Meier coring sea ice.
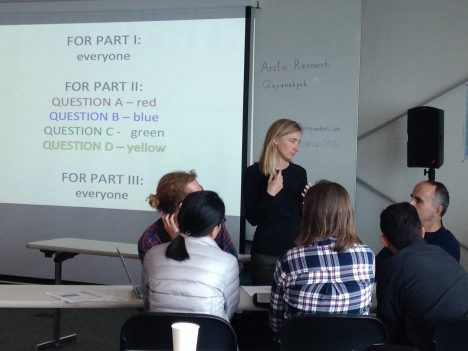
May 31, 2016 — The morning sessions this week have been inside in a classroom setting. It’s been like being back in school, which has been quite fun (believe it or not). For the first four days I’ve been a student, but today I got to be the teacher. I gave the class a lab exercise working with satellite data. The “students” went through several days of imagery and calculated sea ice extent, first for the entire Arctic and then for a region around Barrow, Alaska. One of things this showed is that there are different methods to calculate sea ice extent, each with some advantages and limitations, each giving a slightly different answer. No data is perfect, so this variation in the data gives an indication of the uncertainty of the estimate.
One of the reasons for the differences is that the resolution of the satellite data varies, from 25-kilometer (15.5-mile) grid cells down to 1-kilometer (0.6-mile) cells. This makes a big difference in how well we can resolve ice features. The lower resolution data obviously does not provide the detail of the higher resolution, but in turn it has more complete coverage. So there is a trade-off one has to make. For conditions immediately around Barrow, higher resolution is better, but such data is not always available. For the entire Arctic, having complete data is useful, even if the resolution is lower.
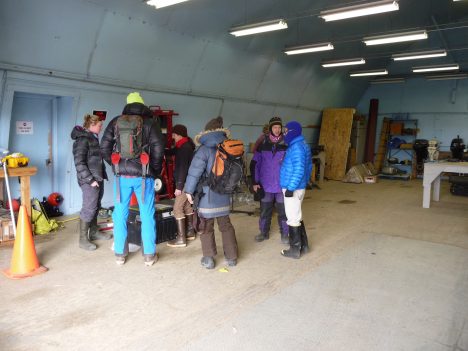
The scientists prep to go on their Grand Challenge.
In the afternoon, we did our last day in the field and it was a “Grand Challenge” activity. Last night, we were challenged by the leaders of the workshop to use what we learned the first four days to come up with a science question and attempt to answer it by collecting data on the ice. We needed to develop a plan and then implement it today. The question we came up with was to try to determine if the ice would break out from the Barrow coast earlier than normal this year. To help answer that question, we realized we needed data from a different site than what we had used the first four days. Field observations are really valuable, but because they are limited to a small area, it’s hard to tell if they are representative of the larger area. During our snow machine morphology activities, the groups noticed that the ice conditions seemed to change as they headed north. The ice seemed more solid and uniform, with fewer ponds.
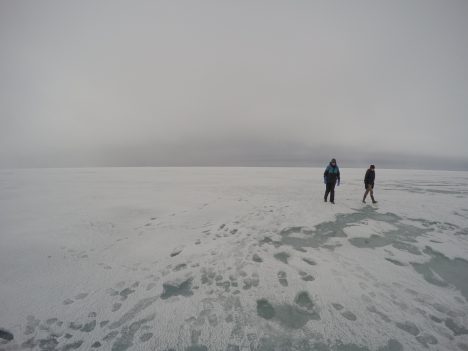
Out on the ice.
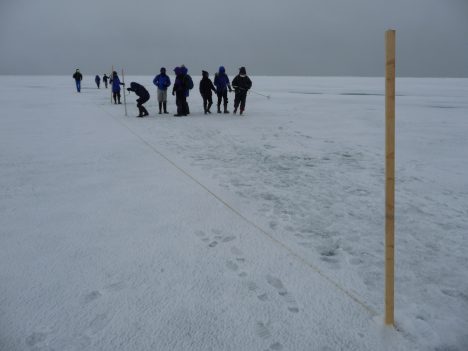
Laying out the sampling line.
So this afternoon we set out a new site a couple miles farther north. The ice was quite different; it was more uniform in appearance, with a white crust of large crystals of crumbly ice on top. We found the ice to be about 10 centimeters (4 inches) thicker than at the southern site and more uniform in thickness. That data and other measurements will be put together tonight and tomorrow. Then we’re going to enter that data into a simple model and run the model with typical weather conditions to see when the ice may become thin enough to break up.
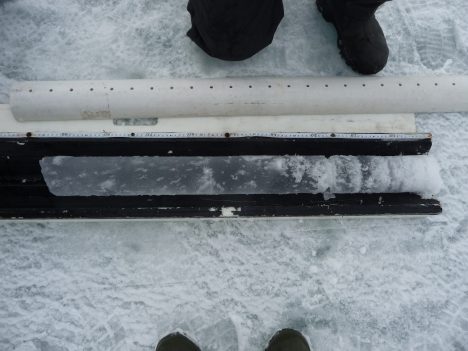
An ice core.
Tonight, the workshop organizers, Don Perovich of CRREL and Marika Holland of NCAR, gave a public talk to the community at the Inupiat Heritage Center in town. Don talked about observations of sea ice and how it has changed over the years, both around Barrow and throughout the Arctic. Then Marika discussed climate models and their projections for the future. The room was full of local residents and the community was quite engaged – there were many questions afterward. The residents here know first hand that the climate is changing because their community is already being affected by the warming: the earlier opening of sea ice is necessitating adaption of their hunting practices, lack of ice is allowing more storm surges and coastal erosion, and warming temperatures are starting to thaw the tundra.
By Walt Meier
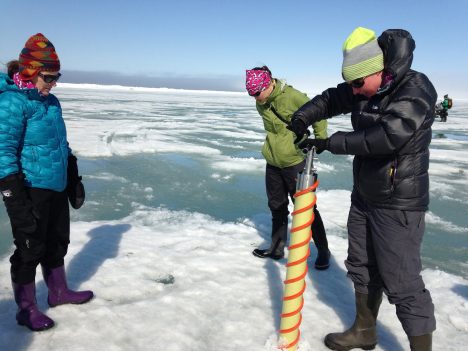
The Red Team drilling an ice core of sea ice.
May 30, 2016 — This morning we did another modeling exercise, led by Jen Kay of the University of Colorado. A question a sea ice scientist inevitably gets asked is “so, when is the Arctic Ocean going to become ice free?” I can understand the interest, but answering it is quite difficult. One reason of course is that the sea ice models are not perfect – we don’t know exactly how the sea ice will respond to warming temperatures in the future. But the main reason is that the climate naturally varies from year to year and over many years, just due to randomness in the climate system. Jen and others have found that the natural variation in sea ice is quite large. The implication is that even under warming temperatures, variations in the climate system may result in many years where the extent doesn’t decrease and may even increase for several years.
The Red Team in the classroom.
This means that we can’t extrapolate from current trends to estimate the year ice-free conditions occur because the current trends may well be interrupted by natural variations. It also means that even if we have several years where the extent doesn’t drop, it doesn’t mean the warming isn’t having an effect – it just means the warming effect is overwhelmed, temporarily, by a natural cooling effect. It’s like driving a car down a mountain – eventually you’ll get to the bottom, but on the way there may be many flat spots or even sections of the road that go uphill.
In the afternoon, our group did the sea ice properties activity. This involved drilling a core through the ice and analyzing it. Sea ice is not simply frozen water – it is frozen salt water. Although most of the salt escapes during the freezing process, some salt gets trapped in the ice in briny pockets of very high salinity water. Over time, these pockets begin to drain (especially during the summer melt), leaving little channels within the ice. In the core, we noticed the brine already starting to drain after we lifted it out of the hole. These brine pockets are important in determining how the ice melts and interacts with the ocean.
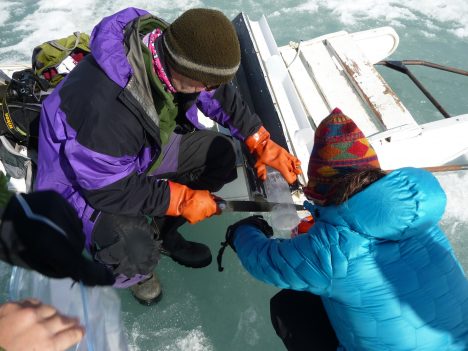
Slicing a sea ice core.
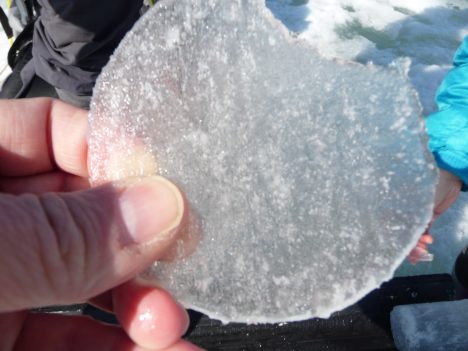
A section of a sea ice core.
We also measured the salinity and temperature in the water near the base of the core. The water was near freezing throughout, as expected. But the salinity was quite low just beneath the bottom of the ice. Normally, the ocean salinity should be around 30 ppt (parts per thousand), but below the ice, the salinity was only about 2 ppt. This is because the fresh surface melt water was draining through the ice. Several centimeters lower, we saw the salinity increase rapidly to near 30 ppt.
Today was Memorial Day, so it’s worth noting that Barrow has a long history of being involved in defense activities. We are staying and working at the Naval Arctic Research Laboratory, which as the name implies was a military research station. We can also see nearby the DEW (Distant Early Warning) Line station, which was an early warning defense system to detect ballistic missiles that could’ve been launched by the Soviets. The soldiers that served in the DEW Line stations were literally on the front lines of the Cold War. So it seems appropriate to be here in Barrow on the day honoring those that have served and made the ultimate sacrifice for their country.
