The Light Side of Optics
Have you ever stopped to think about the color of the ocean? I mean, really stopped to think about why the ocean looks the way it does? If you’ve been to a variety of beaches, you’ve probably noticed that some waters are crystal blue, while others are emerald green, and still others can be yellowish-brown to even red! What causes these colors, and what can they tell us about the ocean?
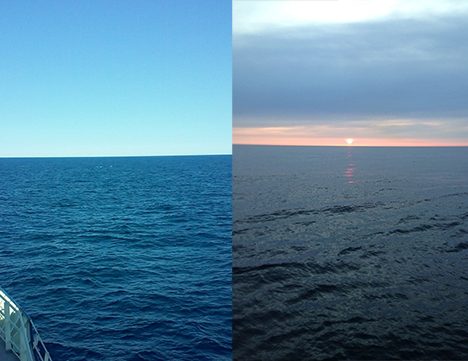
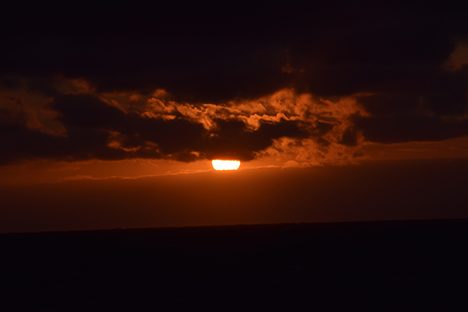
A few of the varying colors of the sea. Photo: Kelsey McBeain and Stuart Halewood
And so begins our dive into the realm of Optical Oceanography. The role of the UCSB Optics team in this cruise involves deploying multiple instruments overboard, filtering many, many liters of water, and attempting to match all the different pieces of the puzzle to get a picture of why light behaves the way it does in the ocean.
As you might expect, many different things contribute to ocean color, but we can group them into five basic categories:
• Water – obviously the most abundant contributor, it actually slightly changes color based on temperature and salinity!
• Phytoplankton – the plants of the sea! As diverse as they are abundant, they influence ocean color based on their size and the amount and type of pigments such as chlorophyll.
• Non-Algal Particles – all other particles in the ocean. This includes dirt, sand, and the clumps of organic material that sink to depth and make marine snow.
• Colored Dissolved Organic Material – the fraction of dissolved organics that interact with light. I like to think of this as brewed tea, but so watered down that it has a light yellow color. It can also be called gelbstof, German for “yellow stuff”.
• Bubbles – formed from breaking waves, photosynthesis, and respiration, they are highly reflective and change the light field both above and below them. For this reason, they are very annoying when they get into our instruments when we’re trying to measure everything else!
Lots of research has been done to characterize all the different ways these 5 constituents absorb and reflect all the different colors of light, and then some! With this information, we can look at how light availability changes with depth and piece together the puzzle to find the amount of each thing at different depths.
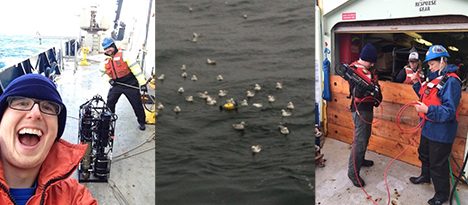
The IOP Package, the HyperPro + angry birds, and the C-OPS. Photo: James Allen and Nicole Estephan
Over the course of a station (depending on weather), we deploy three different packages. The first, the IOP Package, is a big box of multiple instruments each firing their own combo of bright lights and lasers. The HyperPro is a floating instrument that takes reading of light levels just above and below the surface of the ocean (when it isn’t being pecked at by birds). The third, and my favorite, is the Compact Optical Profiling Spectrometer, or C-OPS. Stuart Halewood and I deploy it midday at high noon so that we can match time/data with some ocean color satellites passing overhead (hopefully it isn’t cloudy!). C-OPS has two clusters of sensors on it. One looks down at the spectrum of the light bouncing back up at it from below, and the other looks up and measures light coming down. It measures many different wavelengths as it sinks and sends this data back to us in real time. Since we just want to measure light straight up and down, we don’t want any tilt as it sinks, which is sometimes pretty difficult with all these subsurface currents pushing it around. After we pull C-OPS up, we’ll go look at the profile and measure how fast each color of light seems to “disappear” with depth. By modeling these changes, we’ll be able to get a high-res map of many different constituents at once.
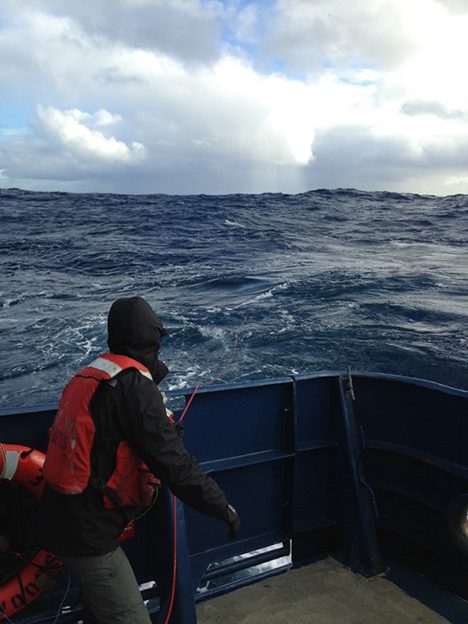
Yes, we hand-deploy a few of our instruments, even in rough weather. Photo: Nicole Estephan
Our ultimate goal is to reconcile all the changes in light behavior due to everything in the water column. With this data, satellites measuring ocean color from orbit will be better equipped to tell us how the ocean is changing on many different scales of time and space! Talk about seeing the ocean in a new light!
Written by James Allen
A Peek into the Inner Space of the North Atlantic
Thinking of a “NASA mission” generally conjures images of a telescope pointed towards outer space visualizing a myriad of stars, planets and other celestial bodies. However, NASA’s NAAMES mission turns it focus, quite literally, from outer space to the Earth’s inner space, the North Atlantic Ocean. Using microscopes rather than a telescope, scientists on board the Research Vessel Atlantis have been producing images of marine microbes that at first glance look quite similar to the night sky, provoking similar feelings of wonder and intrigue.
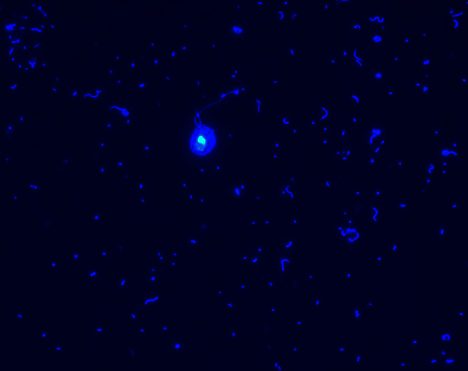
Image of marine bacteria and flagellates. Photo: C. Carlson.
Nick Huynh (graduate researcher) and I (as well as many others on board) are keenly interested in these microbes, specifically the bacterioplankton, because they are the drivers of large-scale biogeochemical cycles on our planet. The way the ocean absorbs and retains carbon largely depends on the growth of microbes and their distribution along the vertical water column, between the ocean surface and abyss. Our individual project (sponsored by the National Science Foundation) has partnered with this NASA mission to investigate marine microbes and their interaction with dissolved organic compounds within the oceanic water column.
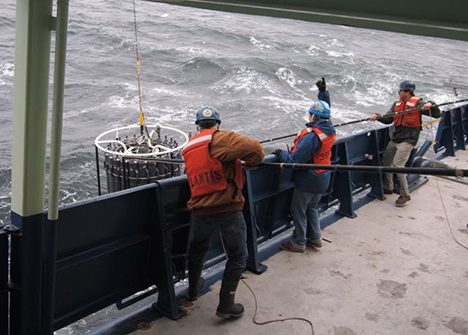
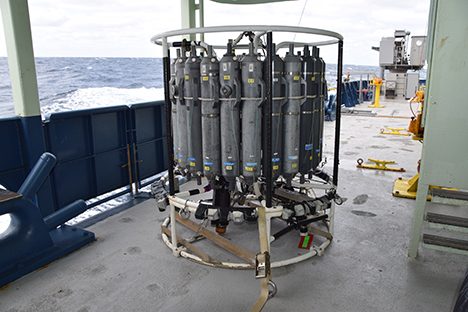
Researchers recovering the Conductivity-Temperature-Depth Bottle rosette that contains water samples from as deep as 1500 meters. Photo: Stuart Halewood.
The North Atlantic is the site of one of the largest phytoplankton blooms on the planet and we are fortunate to be at the right place at the right time. Over the past couple of weeks, we have witnessed the spring phytoplankton bloom “spinning up”. The entire research group is using the floating laboratory of the Research Vessel Atlantis, benefiting from its oceanographic capabilities to reach down into the ocean’s inner space (as deep as 1500 meters) and grab biological and chemical samples that will allow us to decipher how the microbial life regulates ocean.
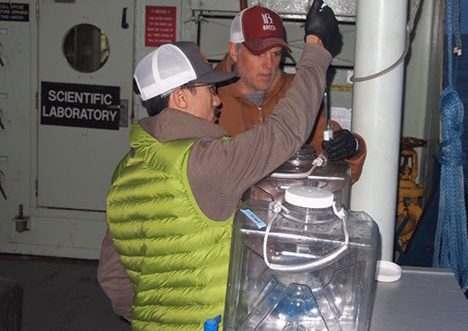
C. Carlson and N. Huynh setting up microbial growth experiment. Photo: Stuart Halewood.
Written by Craig Carlson and Nick Huynh
The Ocean. A chemical soup that covers 70% of the Earth’s surface with a total volume that provides approximately 300 times more space for life than that combined by freshwater and land. Tiny microbes…phytoplankton, zooplankton, bacteria, viruses, but also fish and marine mammals live in that mighty ocean, which is tightly coupled to the atmosphere, the land, the seafloor and every single one of us.
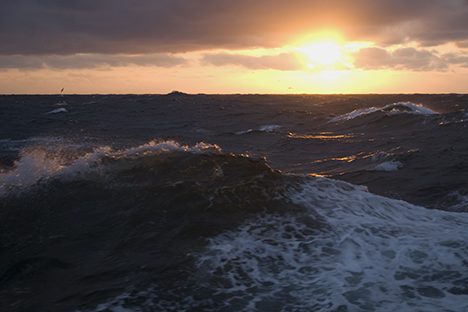
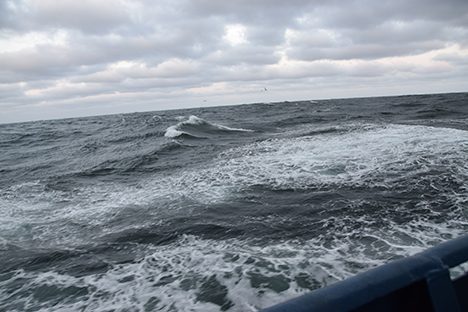
The ocean. This is what we see and sample every day.
No matter where you come from, the ocean has an influence on you. It is not surprising that in all countries directly connected to the ocean or not, people are interested in understanding this dynamic fluid. And here we are on the 12th day of our cruise, a bunch of international scientists from different countries with the same mission: to understand key processes controlling oceanic system function.
Impressed by the diversity of scientists blended together from different countries, today’s ‘experiment’ was to find out how many languages are spoken on board, including the crew which works hard to assure the success of our sampling objectives. I walked around the R/V Atlantis with a single question in mind: in which language can you say the word ‘ocean’? I found out that there are at least 12 languages spoken on the ship: (in alphabetical order) English, Farsi, French, German, Greek, Hebrew, Hindi, Mandarin, Polish, Portuguese, Spanish, and Telugu. However, we share a common passion for understanding the ocean and science is our common language.
Written by Andreas Oikonomou
Ups and Downs
Life on the ship.
Up at midnight,
Half awake in the dark,
My feet feel for the
Steps of the ladder down my bunk,
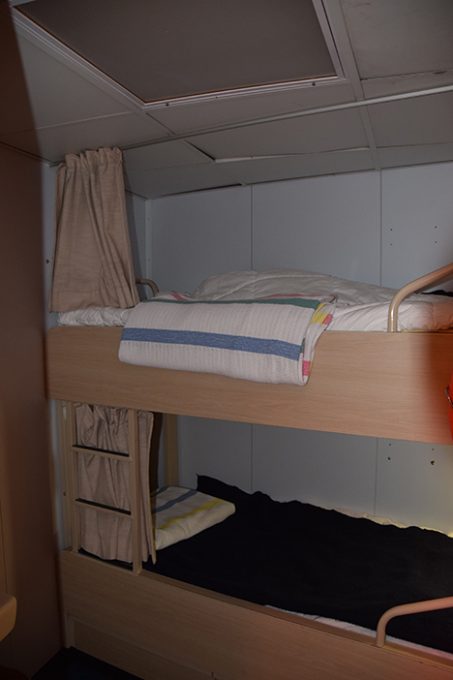
And my hands for the clothes piled up from last night.
Up one deck to main lab,
And another to the galley,
For a well needed cup of coffee.
Down to main lab, while
Down into the ocean goes the CTD
And up back onto the deck.
Up goes the new experiment,
And down goes yesterday’s,
As the sun appears over the horizon.
Down and down and down goes the water through the filters.
Ah, will breakfast ever come?
Down and down and down goes the water through the filters.
Did the plankton go up?
Or did predators take it down?
That’s what we’re up all night trying to understand.
Bottles, samples, numbers, numbers, write it all down…
Up to the library for the science meet,
To hear what’s up for the next few days.
Wind has picked up.
Up and down the waves we’ll go.
It’s in the forecast, but it will calm down.
Down time for food,
Energy’s down…
I may climb back up into my bunk
And just lie down.
Instead, up I crank the FlowCAM
And watch the images of plankton
Down from the sea, up onto my screen.
I perk up from their beauty.
In a makeshift dark cabin,
Up and down the numbers on the fluorometer go,
Measuring chlorophyll, one tube at a time.
Numbers, numbers, write it all down!
Up to the galley for a last cup of tea, and
Back up in my bunk, at last.
Up and down the waves we go.
Life on the ship.
Written by Françoise Morison
We are on our way to the 3rd station of the expedition, the sea is relatively calm and cloud are freeing the sky to let the sun shine. Sleep schedules are adjusted: many of us sleep between 4pm and 22pm, whereas others have their night between 3am and 9am, naps are more than welcome when science allows it. Deploying instruments is now a child’s game, teams are trained and it’s going smoother and smoother.
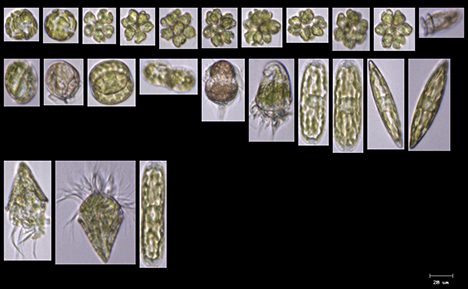
Along the cruise, our group (University of Maine) study the optical properties of the ocean: how light is attenuated, absorbed or backscattered by the particles in water. These properties tell us about the phytoplankton abundance, as well as its physiological status or the species composition. Instruments measure water flowing under the R/V Atlantis continuously. The water pumped at the prow of the vessel goes through a complex network of tubing and is distributed to a spectrophotometer, (better known as the ACs) an ECO-BB3 measuring backscattering, a fluorometer sensing the concentration of colored dissolved organic matter, a chlorophyll fluorometer and temperature and salinity loggers. All the data is recorded along the NAAMES expedition and allows us to characterize the water masses crossed and the organisms living in them. The IFCB (Imaging Flow CytoBot) helps us in this task by taking pictures of any element fluorescing in the water between 5 um and 150 um. Since the beginning of the cruise, 10 days from now, we’ve collected more than 800,000 images of phytoplankton that will help to characterize the drifting community living in North Atlantic.
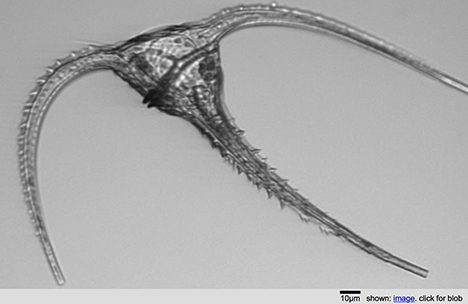
Picture of a ceratium taken by the IFCB
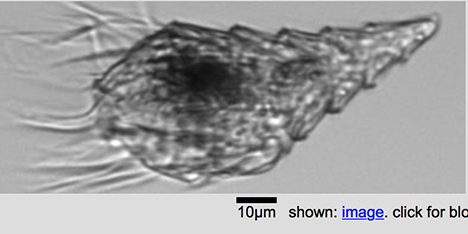
Picture of a ciliate taken by the IFCB
In order to keep track of the planktonic community we study during this expedition, we deploy floats, which are autonomous platforms that profile the ocean between the surface and 1000 m depth (3000 ft). These are deployed every 3 days and take a series of measurements. They collect very precious information that will be sent back to laboratories during the two to three years of their lifetime. Looking forward to sample at station 3 tonight, and deploy more floats along our track.
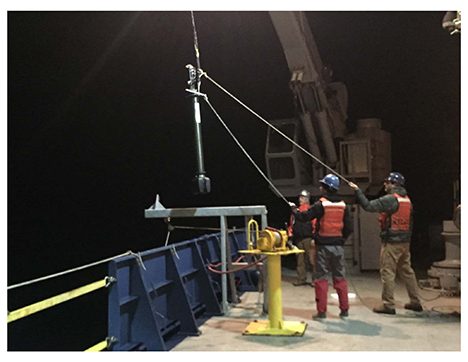
Deployment of a Bbiogeochemical float from the back deck of the R/V Atlantis. Photo: Lee Karp-Boss
Written by Nils Haëntjens
