Our forecasters at Iowa State, and I believe via the National Weather Service, are calling this a “once in a career storm.” The heavy snow in central Iowa—really, almost on top of us right now, is the reason. We ran NPOL all night long with the D3R radar in cold rain that started around 2 a.m. I awoke to some ice pellets this morning around 5 a.m. in my hotel room and then wind-driven rain. The wind has been blowing a steady 25 to 30 mph.
We had some funny things happen with the antenna last night. Wind stopped it a few times in big gusts; it is a big 28-foot “sail” after all, and then we had some miscommunication between the antenna controller and the software that controls scanning. The radar scientist on duty, Dr. Timothy Lang, came up with a good work-around. His solution was to run constant “PPI volumes,” which basically do a full 360 degree sweep at several elevation angles. This enabled us to keep collecting good data and to do it at our sub-3 minute cycle time. We set that time as the outside limit on how frequently we wanted to fully sample the rainfall field around us.
We got the antenna situation repaired this morning, and I was able to go back into alternate rain scan vs. range-height scanning mode with the D3R, so that we sample both the rain field and the structure of the precipitation with height at very high resolution along our ray of disdrometers and rain gauges that stretch in a line toward Iowa City.
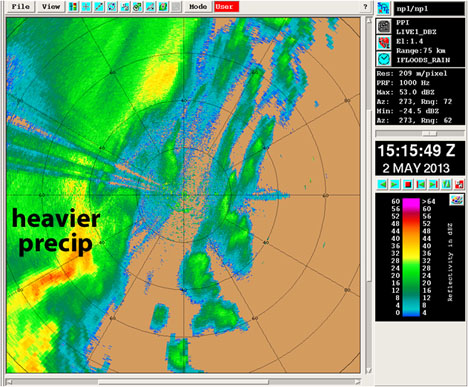
May 2, 2013. A radar image similar to what you’d see in a weather report. Precipitation appears in colors ranging from light rain (blue to green) to heavier precipitation (yellow to red). Credit: NPOL radar / NASA
One thing that is really impressive is the change in precipitation type, and the rapid drop in the height of the freezing level we are seeing as one moves west of the radar. This is illustrated nicely in the dual-polarimetric data that the radar collects. The first image (above) shows an example of the radar reflectivity field that we saw around 15:15 UTC (or 10:15 local time). This variable is typically what your TV Meteorologist shows you on the evening newscast. Notice the band of higher reflectivity just to the west of the radar that indicates heavier rain.
Now the second image (below) shows a variable called the “correlation coefficient” or, RHOHV. This variable takes the signal at both the horizontal and vertical polarizations and computes their correlation at each range sample along all the rays. It is a sensitive measure of the degree to which you have a mixture of liquid and frozen precipitation particles in a given sample volume.
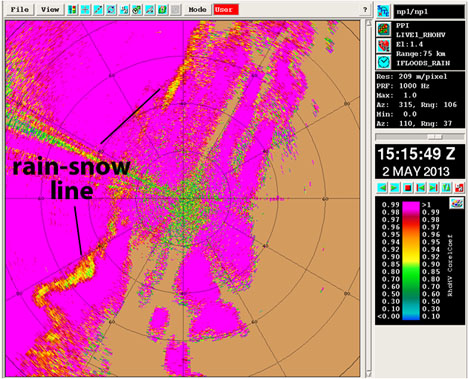
May 2, 2013. This radar image combines two measurements to show what the mixture of liquid and ice is in the precipitation. Bright pink is liquid rain. Yellow to red shows that snow and ice are mixed with the rain. The line of this rain-snow mix stretches from the southwest (bottom left) to the northeast (top right) of the NPOL radar. Credit: NPOL radar / NASA
Raindrops are usually very highly correlated and values will typically exceed 0.98 or so. However, when you get a mixture of snow and rain, the correlation drops rapidly. You can see this rapid drop in correlation to the west of the radar along the narrow line yellowish to orange colors (embedded in the solid pinkish colors of high RHOHV) that extend in a line from southwest of the radar up to the northeast of the radar. That is where the infamous rain-snow line is located in Central Iowa. We await the arrival of that line over NPOL—though it is only progressing eastward very slowly.
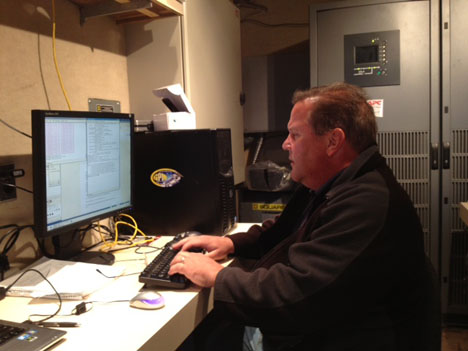
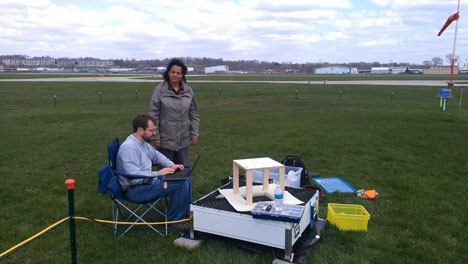
Dave Wolff is a radar scientist at NASA Wallops. He is monitoring the radar data inside the science trailer on site at Traer, Iowa. Credit: Walt Petersen / NASA
Dave Wolff (above), my companion Radar Scientist this week, and also from NASA Wallops, has done a great job of getting some of our NPOL imagery online in real time, so that is a big help to the field operations. It seems that most of the equipment and networking is working- a testament to the hard work several of these folks are putting in.
I must say though, right now I am most anxiously awaiting a hot cup of coffee which one of our Radar Engineers has graciously offered to grab for me on his lunch run.
From May 1 to June 15, NASA and Iowa Flood Center scientists from the University of Iowa will measure rainfall in eastern Iowa with ground instruments and satellites as part of a field campaign called Iowa Flood Studies (IFloodS). They will evaluate the accuracy of flood forecasting models and precipitation measurements from space with data they collect. Walt Petersen, a scientist based at NASA’s Wallops Flight Facility, is the Ground Validation Scientist for the Global Precipitation Measurement (GPM) mission.
We have been waiting for rain at the NPOL site. Yesterday evening it got very close- within 50 km or so. In the interim, we were waiting for convective cells to develop along what is called a radar “fine-line”. Fine-lines are little boundaries in the lowest part of the atmosphere associated with small changes in wind, temperature and/or humidity that often work to focus bugs. They are very visible to the radar and are often (though not always) associated with a line of cumuliform clouds which will sit over the top of the boundary. The clouds form in response to convergence and mixture of the moisture along the fine line and tend to “ride” it as it propagates along. Often, deeper more vigorous rain cells will develop along these lines as they intersect other cloud rolls or boundaries.
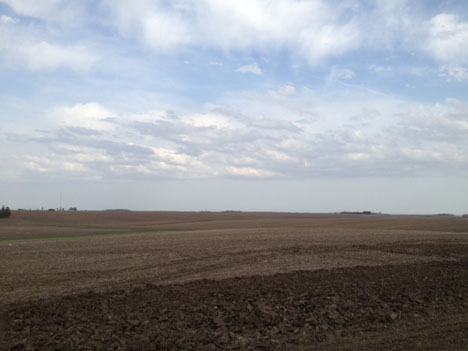
May 1, 2013. Clouds along the “fine-line”, a boundary that means a change in wind, temperature and/or humidity is occurring. Credit: Walt Petersen / NASA
At any rate, we watched one of these boundaries for quite some time yesterday with the radar. It passed NPOL in the afternoon (below) and I went out to take a quick picture of the clouds along it (above; which were unimpressive…..alas). However, southwest of Des Moines there were a few severe storms that developed along the same line; just didn’t happen in our area.
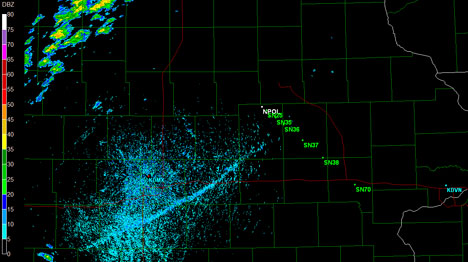
NPOL radar view of the “fine-line.” Clouds and rain are shown in blue. The NPOL position is labeled in white and the line of green sites show where the ground instruments are located. Credit: NASA
Today (currently) we are awaiting a major storm system that is sitting just to our west and northwest and producing rain mixed with snow in the northwest corner of Iowa — the same system that was producing snow in Colorado early this morning. It looks to be wet and cold here for the next few days after the storm arrives. If and when we get the rain/snow mix, we will focus very hard on coordinated scanning with the D3R as this will be a very unique opportunity for us to collect data in a mixed-phase event with three different radar frequencies at dual-polarization. Since this situation happens more often in the mid-latitudes, and GPM will extend our rain and snowfall measurement capability into the mid-latitudes, this could be a great case for looking at the famous “rain-snow line” transition and how our GPM radar and radiometer algorithms will work in this situation.
From May 1 to June 15, NASA and Iowa Flood Center scientists from the University of Iowa will measure rainfall in eastern Iowa with ground instruments and satellites as part of a field campaign called Iowa Flood Studies (IFloodS). They will evaluate the accuracy of flood forecasting models and precipitation measurements from space with data they collect. Walt Petersen, a scientist based at NASA’s Wallops Flight Facility, is the Ground Validation Scientist for the Global Precipitation Measurement (GPM) mission.
A rain gauge will collect how much rain falls, but how exactly do scientists measure the size, shape, and fall speed of raindrops near the ground? Patrick Gatlin of NASA’s Marshall Space Flight Center, sent us a couple photos from Iowa of the instrument that does exactly that: a two-dimensional video disdrometer.
Patrick Gatlin (NASA/MSFC) and Merhala Thurai (Colorado State Univ.) perform calibration tests on a NASA two-dimensional video disdrometer (2DVD) being used to measure the size, shape and fall speed of raindrops for the IFloodS campaign. Credit: NASA
Shaped like a giant pizza box, the disdrometer has a medium sized square opening in the center. Along two adjacent sides at 90 degrees from each other are two video camera systems that record the raindrops as they fall. With a front view and side view of the droplets, scientists can determine their size and shape, and get an idea of how many of differing sizes are falling.
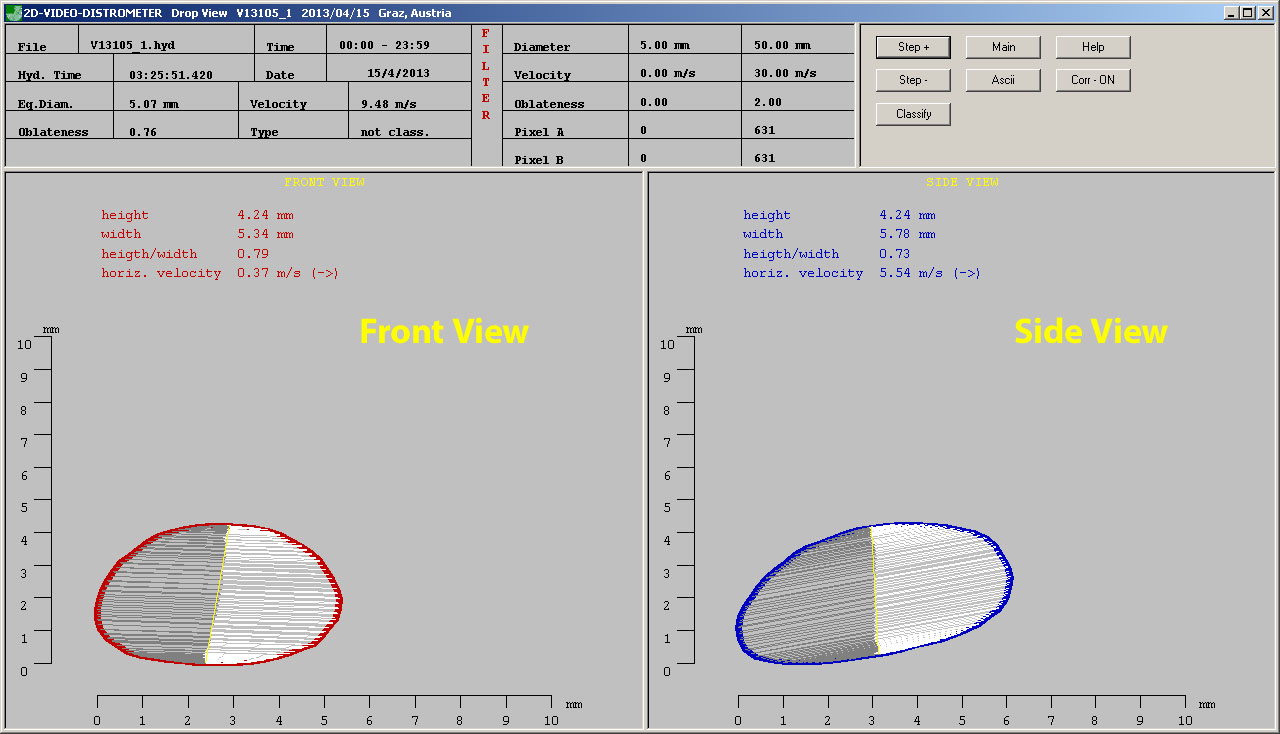
Hamburger shaped raindrop viewed by the disdrometer software from the front (left) and side (right). Credit: Patrick Gatlin / NASA
“A common misconception is that raindrops are shaped like a tear-drop, but actually they are shaped more like a hamburger bun similar to the 5 mm sized raindrop shown here,” Gatlin says. During IFloodS, millions of raindrops will be measured by these type of rainfall sensors. Scientists will examine all these raindrops in order to provide better estimates of rainfall from weather radars probing the atmosphere from the ground up and those looking down on Earth from space, like the eventual GPM Core satellite.
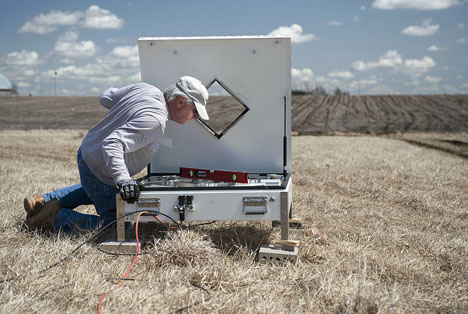
Apr. 8, 2013. NASA and Iowa Flood Center staff set up about 20 disdrometers throughout the field area in April. Credit: Aneta Goska / Iowa Flood Center
From May 1 to June 15, NASA and Iowa Flood Center scientists from the University of Iowa will measure rainfall in eastern Iowa with ground instruments and satellites as part of a field campaign called Iowa Flood Studies (IFloodS). They will evaluate the accuracy of flood forecasting models and precipitation measurements from space with data they collect.
