Clouds are an important part of the climate system. They affect how much sunlight reaches the ground and how much heat returns to space, which in turn affects Earth’s temperature and rainfall patterns. Scientists are working to better understand the role that clouds play in the global climate system, but that requires significant amounts of data.
“No single cloud observation method or system … is able to provide a complete and accurate depiction of cloud properties across the Earth under the many conditions that naturally occur,” said Bill Smith, an atmospheric scientist at NASA’s Langley Research Center (LaRC). Cloud observations are gathered by active and passive satellites, ground-based sensors, and, by humans.
The citizen scientists of the GLOBE Program have been playing a vital role in data collection by observing clouds around the globe, especially at times that “match” a satellite flyover. When that happens, the observations from the citizen scientists on the ground are matched with satellite observations that were made near the same time and place. By combining the ground-up view of GLOBE citizen scientists with the top-down view of satellites, scientists get a more complete view of the atmosphere.
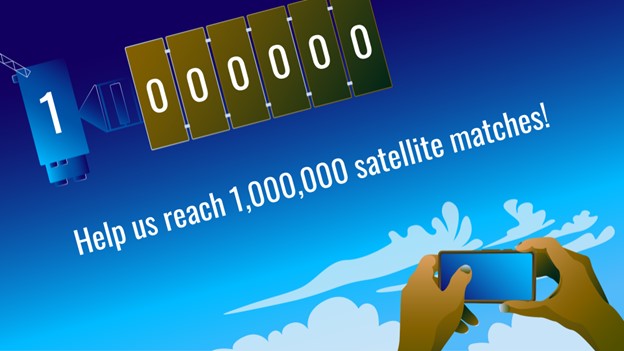
Now, the NASA GLOBE Clouds team is hoping to hit a significant milestone: one million matches by the time of the GLOBE annual meeting in late July 2022.
When a GLOBE cloud observation is taken within 15 minutes of a satellite observation, both points of view are coupled, creating a match. Some satellites are geostationary satellites, such as GOES, Himawari, and Meteosat. Others are polar-orbiting satellites, such as Aqua, Terra, and CALIPSO. The satellite-matched data provides an augmented dataset for research. When a match is made, the NASA GLOBE Clouds team sends a personalized email to participants with the matching satellite data. Approximately 4,000 emails are sent to participants each month.

Participants who want to help GLOBE meet their million-match goal this July can photograph clouds, then upload the photographs and classify the clouds using the GLOBE Observer app. Visit the GLOBE Observer website to learn more about the Match to a Million campaign and how you can help NASA learn more about Earth’s atmosphere.
Read more about the value of combining ground and space measurements in the GLOBE blog Counting to a Million Matches and learn more about matching to satellites on the GLOBE Clouds Science page. You can also follow GLOBE on social media and share what you’re doing to help GLOBE match to a million by using the hashtag #GLOBE1M .
The NASA-funded Global Learning and Observations to Benefit the Environment (GLOBE) program was launched on Earth Day in 1995. Over the past 27 years, millions of students in more than 120 countries have collected and entered more than 200 million environmental measurements into the GLOBE database. Those observations include surface temperatures, rainfall amounts, tree heights, land cover, mosquito habitats, and a variety of other environmental observations, including cloud type and coverage.
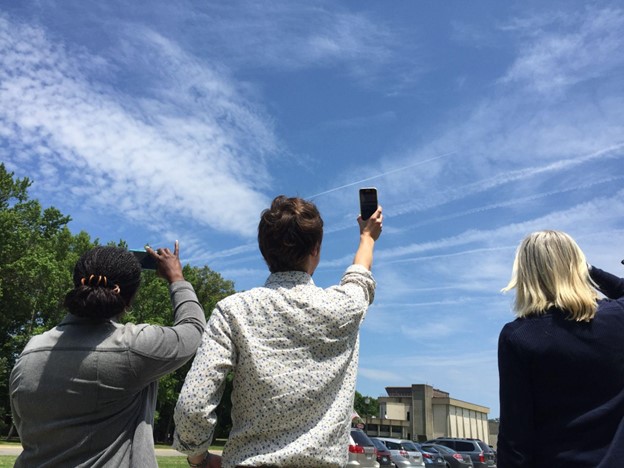
Who knew that being a scientist could be as easy as pointing your phone at the sky? This month, NASA and the GLOBE Program are asking citizen scientists to take out their phones and report what kinds of clouds they see above them.
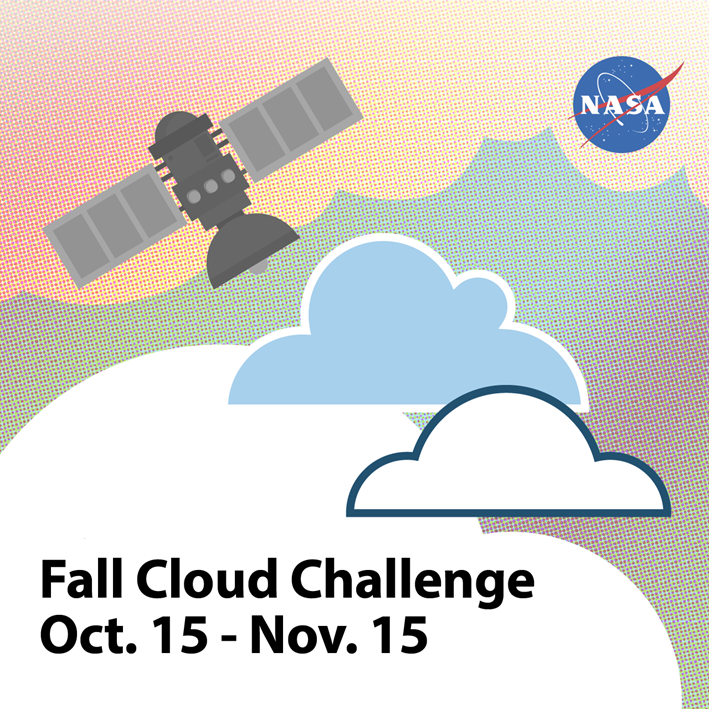
From October 15 to November 15 citizen scientists young, old, and in-between can submit up to ten cloud observations per day using the GLOBE Observer app or one of GLOBE’s other data entry options (for trained members). Participants with the most observations will receive a personalized thank you from a NASA scientist.
“What excites researchers about GLOBE observations is the ability to see what’s up in the sky from volunteers’ perspectives all over the world,” said Marilé Colón Robles, lead for the GLOBE Clouds Team at NASA’s Langley Research Center. “What our eyes can see is difficult to fully duplicate with instruments. Merging these views is what makes a complete and impactful story.”
“We want to do a data challenge in the fall and see if there are any differences from what was observed during the spring data challenge of 2018,” said Colón Robles. “From thin, high clouds that are hard for satellites to detect to dust storms that impact our daily lives, these observations play an important role in better understanding our atmosphere.”
At NASA, scientists work with a suite of satellite instruments known as the Clouds and the Earth’s Radiant Energy System (CERES). Though they have these highly sensitive instruments, it can sometimes be difficult for scientists to distinguish features such as cirrus clouds from snow cover in their imagery because both are cold and bright from a satellite perspective. By comparing satellite images from a particular area with data submitted by citizen scientists, researchers can differentiate between the two.
Lucky GLOBE observers might make an observation while the Cloud-Aerosol Lidar and Infrared Pathfinder Satellite Observation (CALIPSO) is overhead. CALIPSO is a joint mission between NASA and the French space agency (CNES) that uses laser pulses to measure clouds and atmospheric aerosols. Citizen scientists who make observations at the same time and place as CALIPSO will receive an emailed satellite comparison of CALIPSO’s measurements showing features such as high clouds, dust, and smoke. Scientists are especially interested in these observations in order to improve their understanding of dust storms. During the challenge, make sure you turn on daily satellite notifications in the app or use this satellite overpass website to see the schedule for your location.
“Last year’s challenge gave researchers special glimpses into cloud types around the world,” said Colón Robles. “Photographs provided by observers gave insight into events such as dust storms and wildfires. Our hope is to once again learn from the community and together study our atmosphere.”
The 2018 data challenge, which took place in the spring, received more than 56,000 cloud observations from more than 15,000 locations in 99 countries and Antarctica.
NASA is a sponsor of GLOBE, an international science and education program that provides students and the public with the opportunity to participate in data collection and the scientific process. NASA GLOBE Observer is a free smartphone app that lets anyone make citizen science observations from the palm of their hand.
Cloud Identification Resources and Tips
Data collection and data entry help
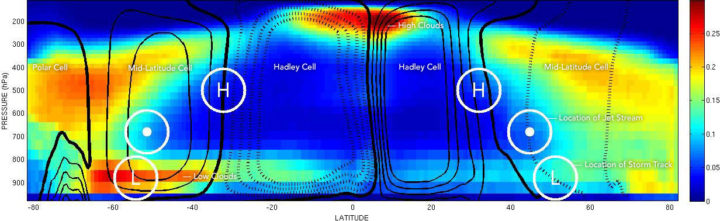
The location of mid-latitude storm tracks are marked with an L. The location of the jet stream is marked with a dot. And the place where air sinks between Hadley Cells and Mid-latitude Cells is marked with an H. The left side of the chart depicts the Southern Hemisphere; the right side depicts the Northern Hemisphere. Chart by George Tselioudis/NASA. The cloud data was collected by CloudSat.
The concentrations of greenhouse gases in Earth’s atmosphere have risen rapidly during the past century, mainly because of fossil fuel burning. Some of the effects of this are pretty straightforward: more carbon dioxide in the atmosphere means air temperatures will rise; ice in the high latitudes will begin to melt; and sea level will rise.
That seems pretty straightforward, right? But there are some areas where the changes will be more complicated. For instance, what will all of that extra carbon dioxide means for how air circulates, for the position of the jet stream, and for how clouds are distributed in the atmosphere?
George Tselioudis, a climate scientist at NASA’s Goddard Institute for Space Studies, did a nice job of explaining this as part of a post he wrote recently. In case you are not familiar with some of the scientific terms, I have added links to web sites that explain them in more detail. I also added some additional explanations to make his description a little clearer.
Take it away, George:
Atmospheric circulation, when examined using a simplified, two-dimensional view (such as the figure above), is dominated by two major features. The first is a large feature called the Hadley cell, which lifts air in the Inter-Tropical Convergence Zone (ITCZ), moves it at high altitudes towards the poles, and sinks it again to the surface in the subtropical regions. The second feature is a very strong river of air, known as the jet stream, that flows from west to east in the middle latitudes of each hemisphere. The meanders of the jet stream produce the storm tracks that are the major weather makers in the mid-latitude regions.
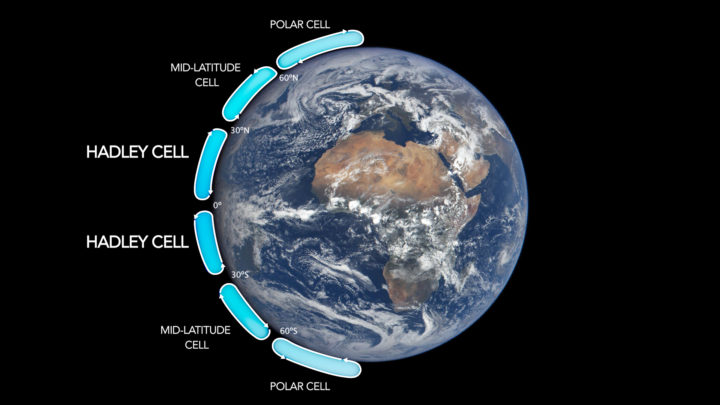
Image Credit: NASA.
George did not include it in his post, but here is a useful chart that lays out the locations of Hadley cells and the other higher-latitude cells. Now look back at the figure at the top of this page, and let’s go back to George.
The subsiding zones at latitudes between 20° and 30° North and South are noted by the letter ‘H’; the jet stream is in each hemisphere is marked with a dot; and the storm tracks are noted with an ‘L’. The circulation is superimposed on the distribution of the world’s clouds, derived from NASA CloudSat satellite observations. Areas with the most clouds are red and yellow.
Note: The CloudSat data are key. There are plenty of diagrams that show how global circulation patterns work (in fact, I have included one more below). But there are few that show you where clouds actually form and, crucially, at what altitude those clouds form.
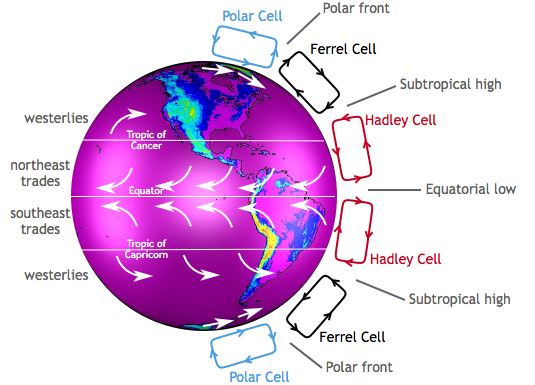
Image by the Center for Multiscale modeling of Atmospheric Processes.
George continues:
It is apparent how the clouds relate to the circulation features. The narrow zone of uplift in the tropics produces high, thick clouds in the ITCZ (which is near the equator). The areas of subsidence in the subtropics produce extensive fields of low clouds, more extensive and deep in the southern than in the northern hemisphere, while the storms embedded in the jet stream produce deep, high clouds that extend throughout the Earth’s troposphere.
It is worth looking carefully at the figure at the top of the page and tracing out the features that Tselioudis describes. Whether clouds are low or high leads to different effects on climate. Low clouds primarily reflect solar radiation and cool the surface of the Earth. In contrast, high clouds tend to have a warming effect on the surface and atmosphere.
Now let us look at the key claim that Tselioudis and other climate scientists make about how global warming will affect circulation patterns. In short, scientists expect Hadley cells to expand so that the edges (where air descends) move toward the poles. In other words, the tropics will expand.
And that is exactly what has happened over the past few decades:
Observations of the past 35 years indicate that, as the Earth has warmed, these circulation features are moving towards the poles. The Hadley cell shows a clear signal of poleward expansion, while poleward movement is present but less clear in the jet stream and mid-latitude storm tracks. We found that the two quantities that correlate significantly and consistently in all ocean basins and seasons are the Hadley cell extent and the high cloud field: when the Hadley cell edge moves poleward, the high cloud field also shifts towards the poles, and vice versa.
Still following? Good, because this is where things get more complicated. Though Hadley cells are expanding in both the Northern and Southern Hemispheres, the effects on clouds and climate are different in each hemisphere. Here is how Tselioudis puts it:
However, this coordinated movement does not have the same effect in the two hemispheres. In the northern hemisphere, the poleward movement of the high clouds opens up a “cloud curtain” that lets more sunlight into the ocean surface, thus producing warming at the surface. But in the southern hemisphere, the poleward contraction of the high clouds is balanced by an expansion of the already extensive low cloud decks, which ends up blocking more sunlight and producing a small surface cooling.
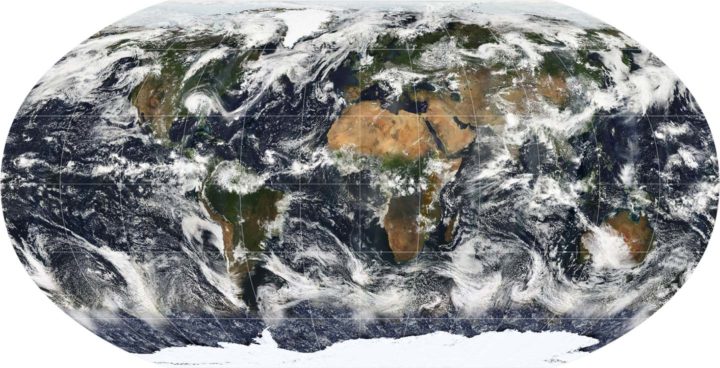
A map of Earth showing the global cloud cover on July 11, 2005, based largely on observations by the MODIS sensor on the NASA Terra satellite. Most clouds form in bands near the equator and along lines of latitude roughly 60 degrees North and South of the equator.
Why does this matter? According to Tselioudis, representing this detail correctly in climate models is critical to determining how much warming will result from a given increase of greenhouse gases. Climatologists call this climate sensitivity. Many climate models do not represent Hadley Cell expansion correctly yet; specifically, the models do not account for the fact that the Hadley cells have grown wider. Tselioudis’s research shows that the models that do match real-world observations of clouds have a lower sensitivity to greenhouse gases (a climate sensitivity near 3° Celsius compared to between 4°C and 5°C).
If Tselioudis is right, that is a piece of mildly good news for the planet from the complicated world of cloud climate science.
For more details, read the post Tselioudis wrote for GISS. Also, take a look at this June 2017 article and this May 2016 study and news release.
You want to know what is better than a “Celebration of Clouds” (our recent photo essay)? A slideshow of clouds set to music. A slideshow you can use to hook your friends and family on Earth science.
So sit back, push play, and take a tour of Earth’s elegant atmosphere. Then share the beauty.
Our focus at Earth Observatory has long been still imagery and data-intensive maps. But lately we have been supplementing some stories with video and animations. For instance, check out this narrated video about the Chesapeake Bay Watershed. It’s a relatively new direction for us, so please let us know what you think.
