The UK’s Antarctic Place-names Committee has agreed that seven ice features in western Antarctica should be named for Earth-observation satellites. One of them is Landsat Ice Steam.
The new designations were announced on June 7, 2019. The ice features are all located in Western Palmer Land on the southern Antarctic Peninsula.
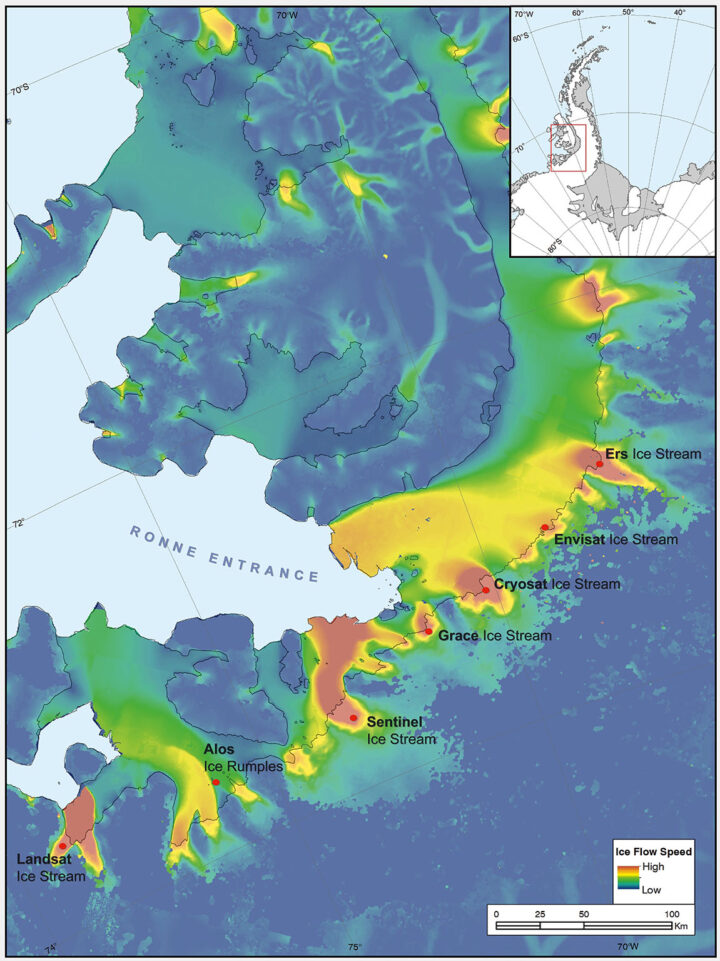
The seven features ring George VI Sound like pearls on a necklace. The new names, as officially entered into the British Antarctic Territory Gazetteer, are (from west to east): Landsat Ice Steam, ALOS Ice Rumples, Sentinel Ice Stream, GRACE Ice Stream, Envisat Ice Stream, Cryosat Ice Stream, and ERS Ice Stream.
The UK has submitted the new names for the fast-moving ice features to Scientific Committee on Antarctic Research (SCAR), which maintains a gazetteer or registry, of names officially adopted by individual nations. Under the Antarctic Treaty, signatory nations confer on geographic feature names, but each nation’s naming authority formally adopts new names. The U.S. Board on Geographic Names will meet in July and may discuss at that meeting whether the names adopted by the UK also will be adopted by the US. The question of using the term “glacier” for the ice features instead of “ice stream” is also part of each nation’s naming decision.
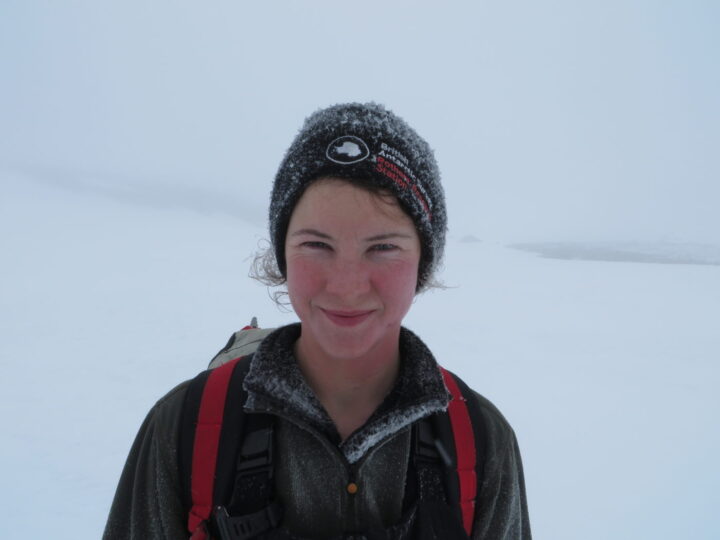
The new names were proposed by Anna Hogg, a glaciologist with the Center for Polar Observation and Modelling at the University of Leeds. In research published in 2017, Hogg found that glaciers draining from the Antarctic Peninsula were accelerating, thinning, and retreating, with implications for global sea level rise. The fast-moving glaciers that Hogg and colleagues tracked with radar and optical satellite imagery were unnamed. In her paper, the glaciers had to be designated by latitude and longitude.
Satellites had enabled Hogg and her team to clock the speed of these nameless ice features—some with rates faster than 1.5 meters/day. In tribute to the spaceborne instruments, Hogg came up with a way to describe the fast-moving ice features more succinctly—name them after the satellites that had helped her understand their behavior.
Hogg proposed to the U.K.’s Antarctic Place-names Committee that the features should be named for Landsat, Sentinel, ALOS PALSAR, ERS, GRACE, CryoSat, and Envisat. She was notified in early June that the committee had agreed to adopt the names, which provide a way to recognize international collaboration, as fifteen space agencies currently collaborate on Antarctic data collection.
“Satellites are the heroes in my science of glaciology,” Hogg told the BBC. “They’ve totally revolutionized our understanding, and I thought it would be brilliant to commemorate them in this way.”
Naming the glaciers after satellites is also a celebration of data fusion. “Our understanding of ice velocities and ice sheet mass balance has come from putting many different remote sensing data sets together—optical, radar, gravity, and laser altimetry,” said Jeff Masek, the NASA Landsat 9 Project Scientist. “Landsat has been a key piece in assembling that larger puzzle. Naming an ice stream after Landsat is a fitting way to recognize the value of long-term Earth Observation data for measuring changes in Earth’ polar regions.”
Read more from NASA’s Landsat science and outreach team, including the history of Antarctic observation with Landsat. Read more about all of the glaciers and their namesake satellites, as told by the European Space Agency. And read about the island discovered by and named for Landsat, and the woman who discovered it.
Correction, June 27, 2019: SCAR’s role in the Antarctic naming process was incorrectly described in the earlier version of this article. Updates were provided by Dr. Scott Borg, Deputy Assistant Director of the National Science Foundation’s Directorate for Geosciences, and Peter West, the Outreach Program managers for NSF’s Office of Polar Programs, to correctly describe the naming process.
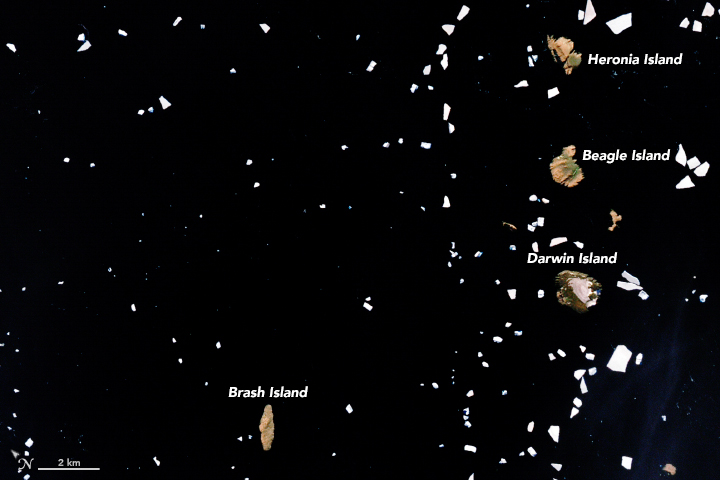
NASA Earth Observatory map by Joshua Stevens, using Landsat data from the U.S. Geological Survey and calculations from Lynch, H. J., & Schwaller, M. R.
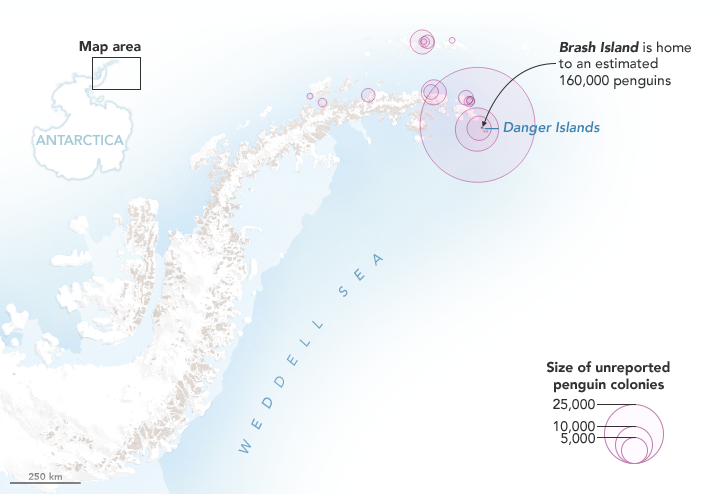
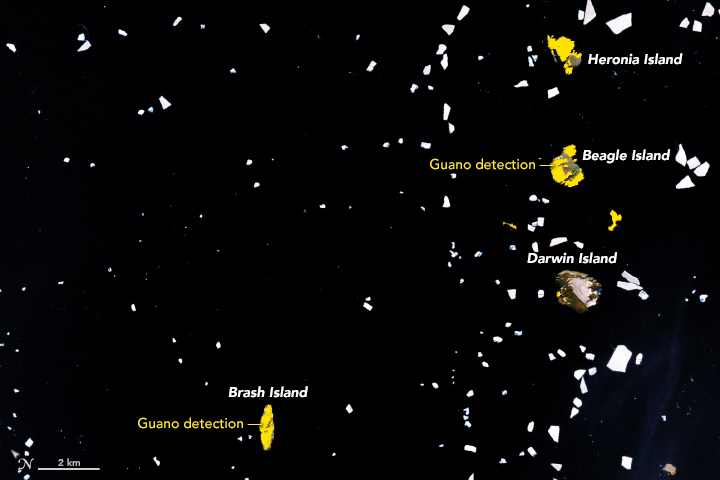
Last year, we published a story explaining how scientists had used satellite images of rocks stained pink with guano to discover several unexpectedly large colonies of Adélie penguins on the Danger Islands. Now the researchers are back with a new announcement: Using Landsat data, they have analyzed how the size of that penguin population has changed since 1982. They also used Landsat’s deep archive of satellite imagery to analyze what the penguins eat and whether their diets have changed over the past three decades.
“While the Adélie population [on the Danger Islands] is massive, it was even larger in the past,” said Heather Lynch of Stony Brook University. “We believe the population peaked in the late 1990s and has been on a slow steady decline ever since.” The scientists are still working out what may have caused the 10 to 15 percent decline in the population, but they think it is probably related to changing environmental conditions.
NASA Earth Observatory images by Joshua Stevens, using Landsat data from the U.S. Geological Survey and calculations from Lynch, H. J., & Schwaller, M. R. (2014).
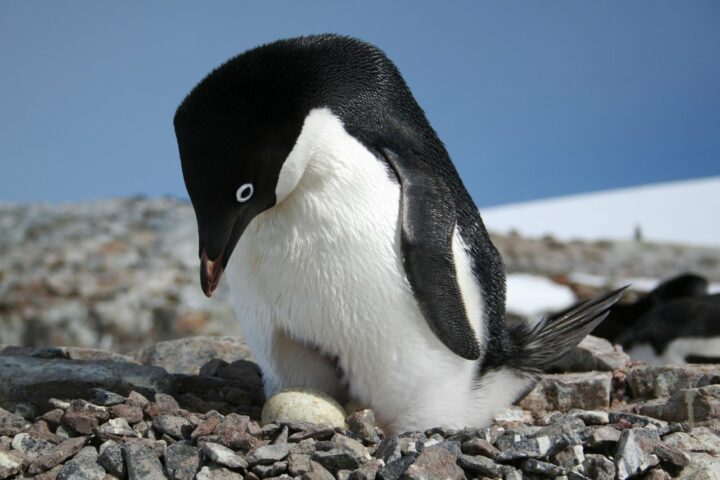
Adélie penguins are particularly sensitive to changes in climate because they require ice-free land areas to breed and access to open water. They also need enough sea ice to support populations of key food sources. The researchers thought that changing diets would accompany the decline in population, but by analyzing the spectral signatures of all the guano stains found in cloud-free Landsat image of the islands since 1982, they were surprised to discover the penguins’ diets have stayed the same.
Penguin guano ranges from white to pink to dark red. White guano is from eating mostly fish; pink and red is from mostly eating krill. The University of Connecticut’s Casey Youngflesh, however, noticed some intriguing regional patterns in what Adélie penguins eat. Colonies in West Antarctica tend to eat more krill, while colonies in East Antarctic consume more fish. The reasons for the difference are not clear, though Youngflesh is looking into the possibility that differences in the Antarctic silverfish population may be a factor.
Discovering the big colonies on the Danger Islands has also opened up a new pathway for figuring out when penguins first arrived. By digging through layers of guano-stained pebbles during a recent field expedition and dirt and dating them with radiocarbon techniques, Michael Polito of Louisiana State University worked out that penguins must have arrived on the Danger Islands about 2,900 years ago, thousands of years earlier than previous evidence suggested.
Credits: Heather Lynch, Stony Brook University.
Expect to hear even more guano-stained discoveries in the future. “We are only just scratching the surface of what we can do in terms of tracking seabirds from space,” said Lynch. “We should be able to extend the technique to snow petrel, boobies, and cormorants.”
Lynch put the total number of penguins on the Danger Islands at roughly 1.5 million (individual birds) — more than live on all the rest of the Antarctic Peninsula combined.
Read more about the Danger Island Adélie penguins from NASA and MAPPPD.
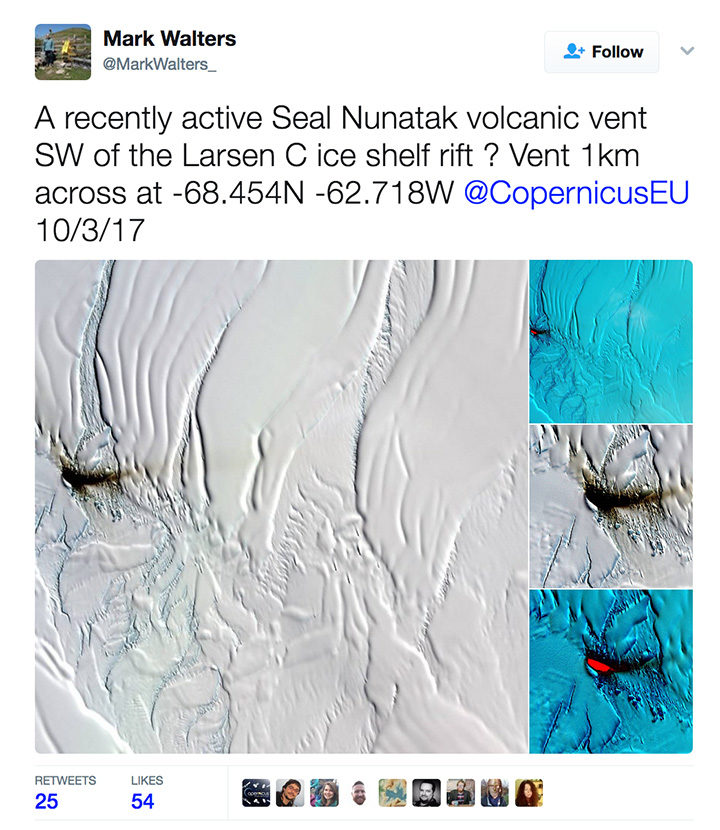
On April 4, 2017, archaeologist Mark Walters tweeted an intriguing set of satellite images of a dark smear on the Larsen C Ice Shelf. Was it volcanic ash from a recently active volcanic vent, he wondered?
The tweet — and especially a bright, red spot in an infrared image (lower right in the screenshot) — generated interest among folks who follow Earth science, Antarctica, and volcanoes. New volcanic activity in this area would be surprising and newsworthy. While there is some evidence of volcanic activity near this part of the Larsen Ice Shelf, the most recent reports date back to 1980.
Some remote sensing experts who saw the images were skeptical. “I looked through about four months of satellite images before/after and never saw anything that resembled a plume. Think it’s dust on ice,” tweeted Erik Klemetti, an associate professor at Denison University and author of Wired’s Eruptions blog.
Later, CNRS scientist Simon Gascoin weighed in, noting that the underlying geology in that area was sedimentary rock—a sign that volcanic activity wasn’t likely. Then he shared even stronger evidence against the idea of volcanic activity.
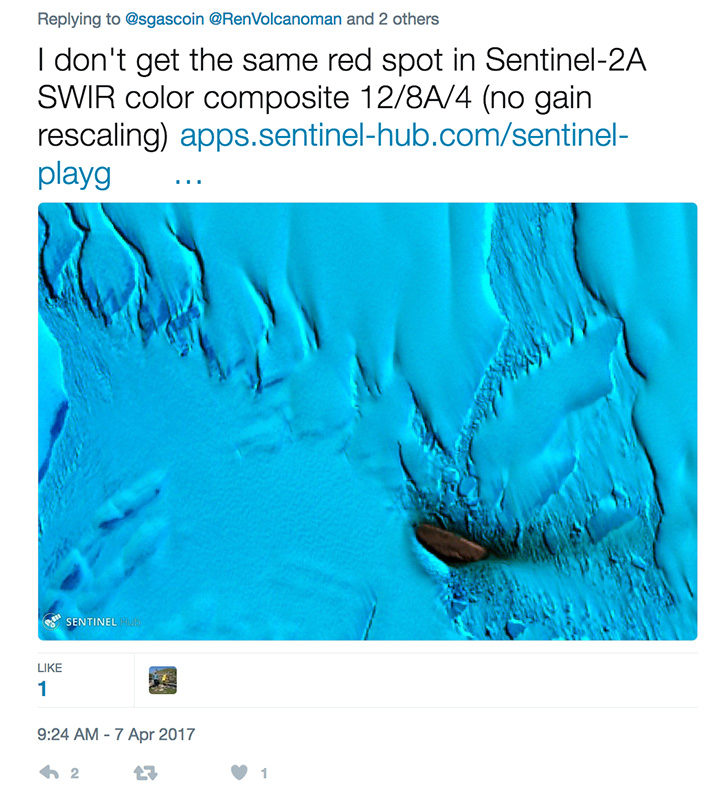
In an email, I asked Gascoin to clarify what he meant by “no gain rescaling” and why his image from the Sentinel Playground looked so different in comparison to the image from Land Viewer.
His reply: “Mark Walters used the Land Viewer, I just checked and found out that the ‘contrast stretching‘ is computed on each RGB band separately. Hence you can get strange results, especially in cases where a single rock island is surrounded by snow and ice which have a very distinct reflectance signature.”
In other words, Gascoin is saying that the image-processing algorithm that drives the Land Viewer browser amplified the reflectance signal from the dust in a way that made it appear stronger in the infrared than it actually was. Sentinel Playground uses a different image processing approach (adjusting the contrast of the image “bands” all at once rather than individually) to avoid the problem.
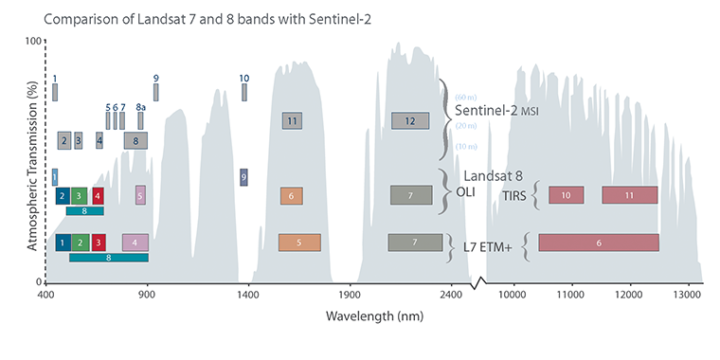
Satellite instruments carry many sensors that are each tuned to a narrow range, or “band,” of wavelengths (just red or green light, for instance). This chart shows how the bands of sensors on the Sentinel-2, Landsat 7, and Landsat 8 satellites compare. To make a satellite image, three different bands are represented in tones of red, green, or blue. A false-color image uses at least one non-visible wavelength, though that band is still represented in red, green, or blue. Read this story to learn more about how observations made in the infrared are displayed in false-color images.
Meanwhile, experts from the Smithsonian’s Global Volcanism Program had arrived at a similar conclusion. “It seems unlikely that this is an eruption for a few reasons,” emailed Benjamin Andrews. “First, Table Nunatak is formed of Cretaceous rocks, with no evidence of recent activity. Second, it is located pretty far from any other volcanoes, and there doesn’t appear to be a good tectonic explanation for current magmatism at Table Nunatak.”
So, the mystery appears to be solved. As interesting as it would have been, there is no new volcanic activity happening in this part of Larsen C.
