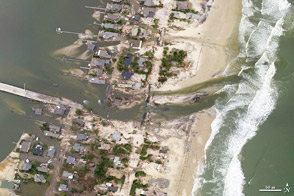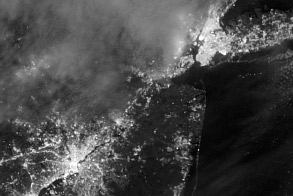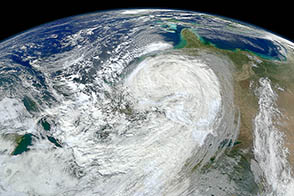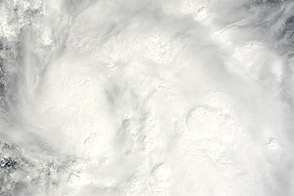


The scenes of devastation and wreckage that Hurricanes Sandy (2012) and Katrina (2005) left behind were tragically similar. Both storms flooded major cities, cut electric power to millions, and tore apart densely populated coastlines. But from a meteorological perspective, the storms were very different.
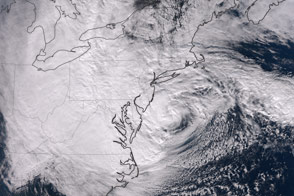
Katrina was a textbook tropical cyclone, with a compact, symmetrical wind field that whipped around a circular low-pressure center. Like most tropical cyclones, Katrina was a warm-core storm that drew its energy from the warm waters of the tropical Atlantic Ocean. Sandy had similar characteristics while it was blowing through the tropics. But as the storm moved northward, it merged with a weather system arriving from the west and started transitioning into an extratropical cyclone.
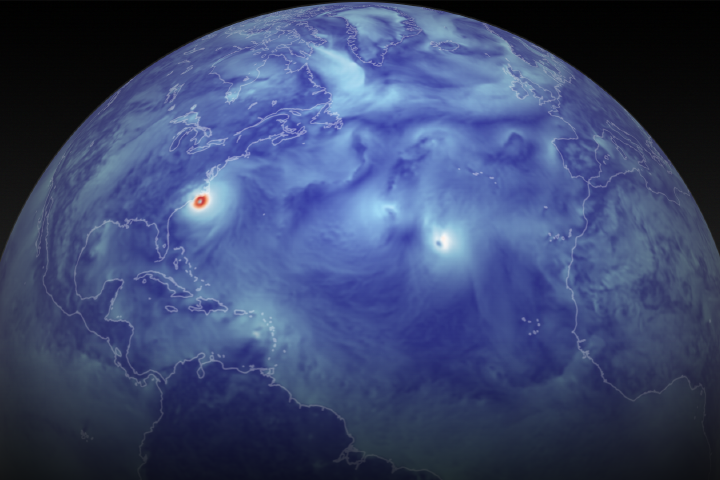
The names sound similar, but there are fundamental differences between the two types of storms. While tropical cyclones draw their energy from warm ocean waters, extratropical cyclones are fueled by sharp temperature contrasts between masses of warm and cool air. Extratropical cyclones also tend to be asymmetric, with broad wind and cloud fields shaped more like commas than circles. So when tropical cyclones become extratropical, their wind and cloud fields expand dramatically. Their strongest winds generally weaken during this process, but occasionally a transitioning storm retains hurricane force winds, as was the case with Sandy.
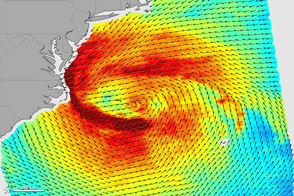
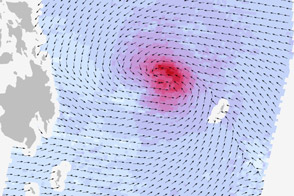
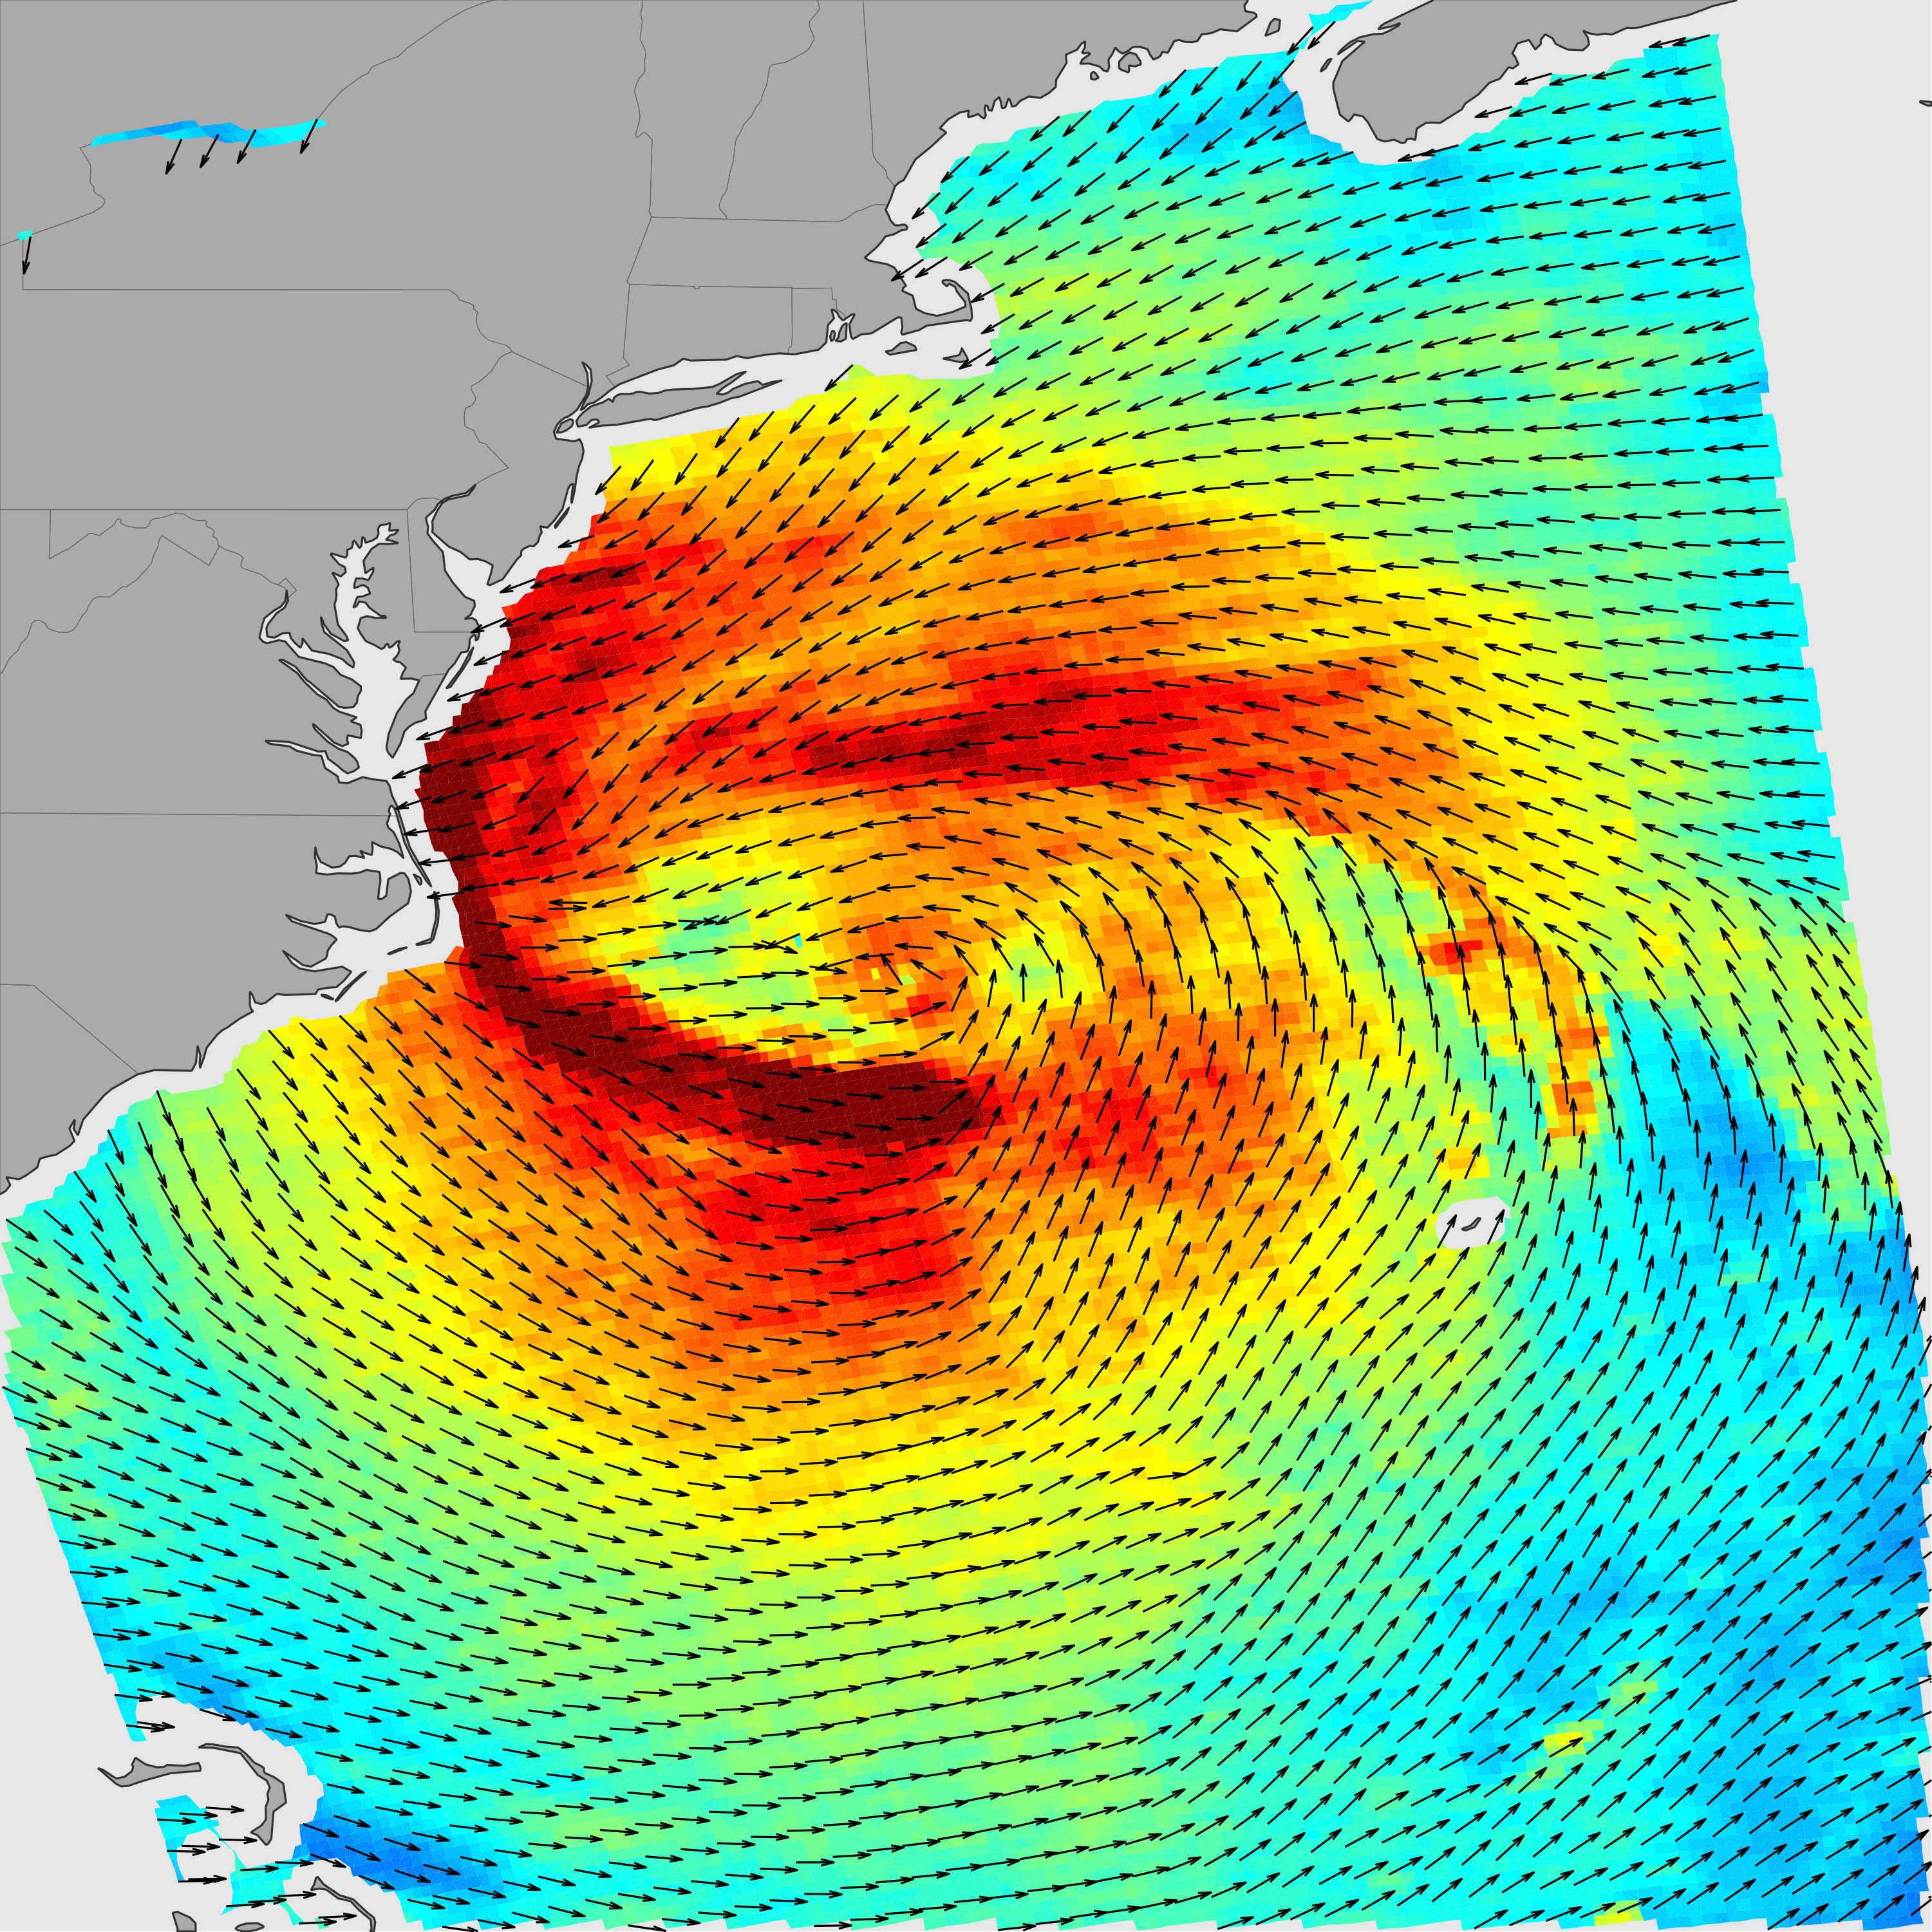
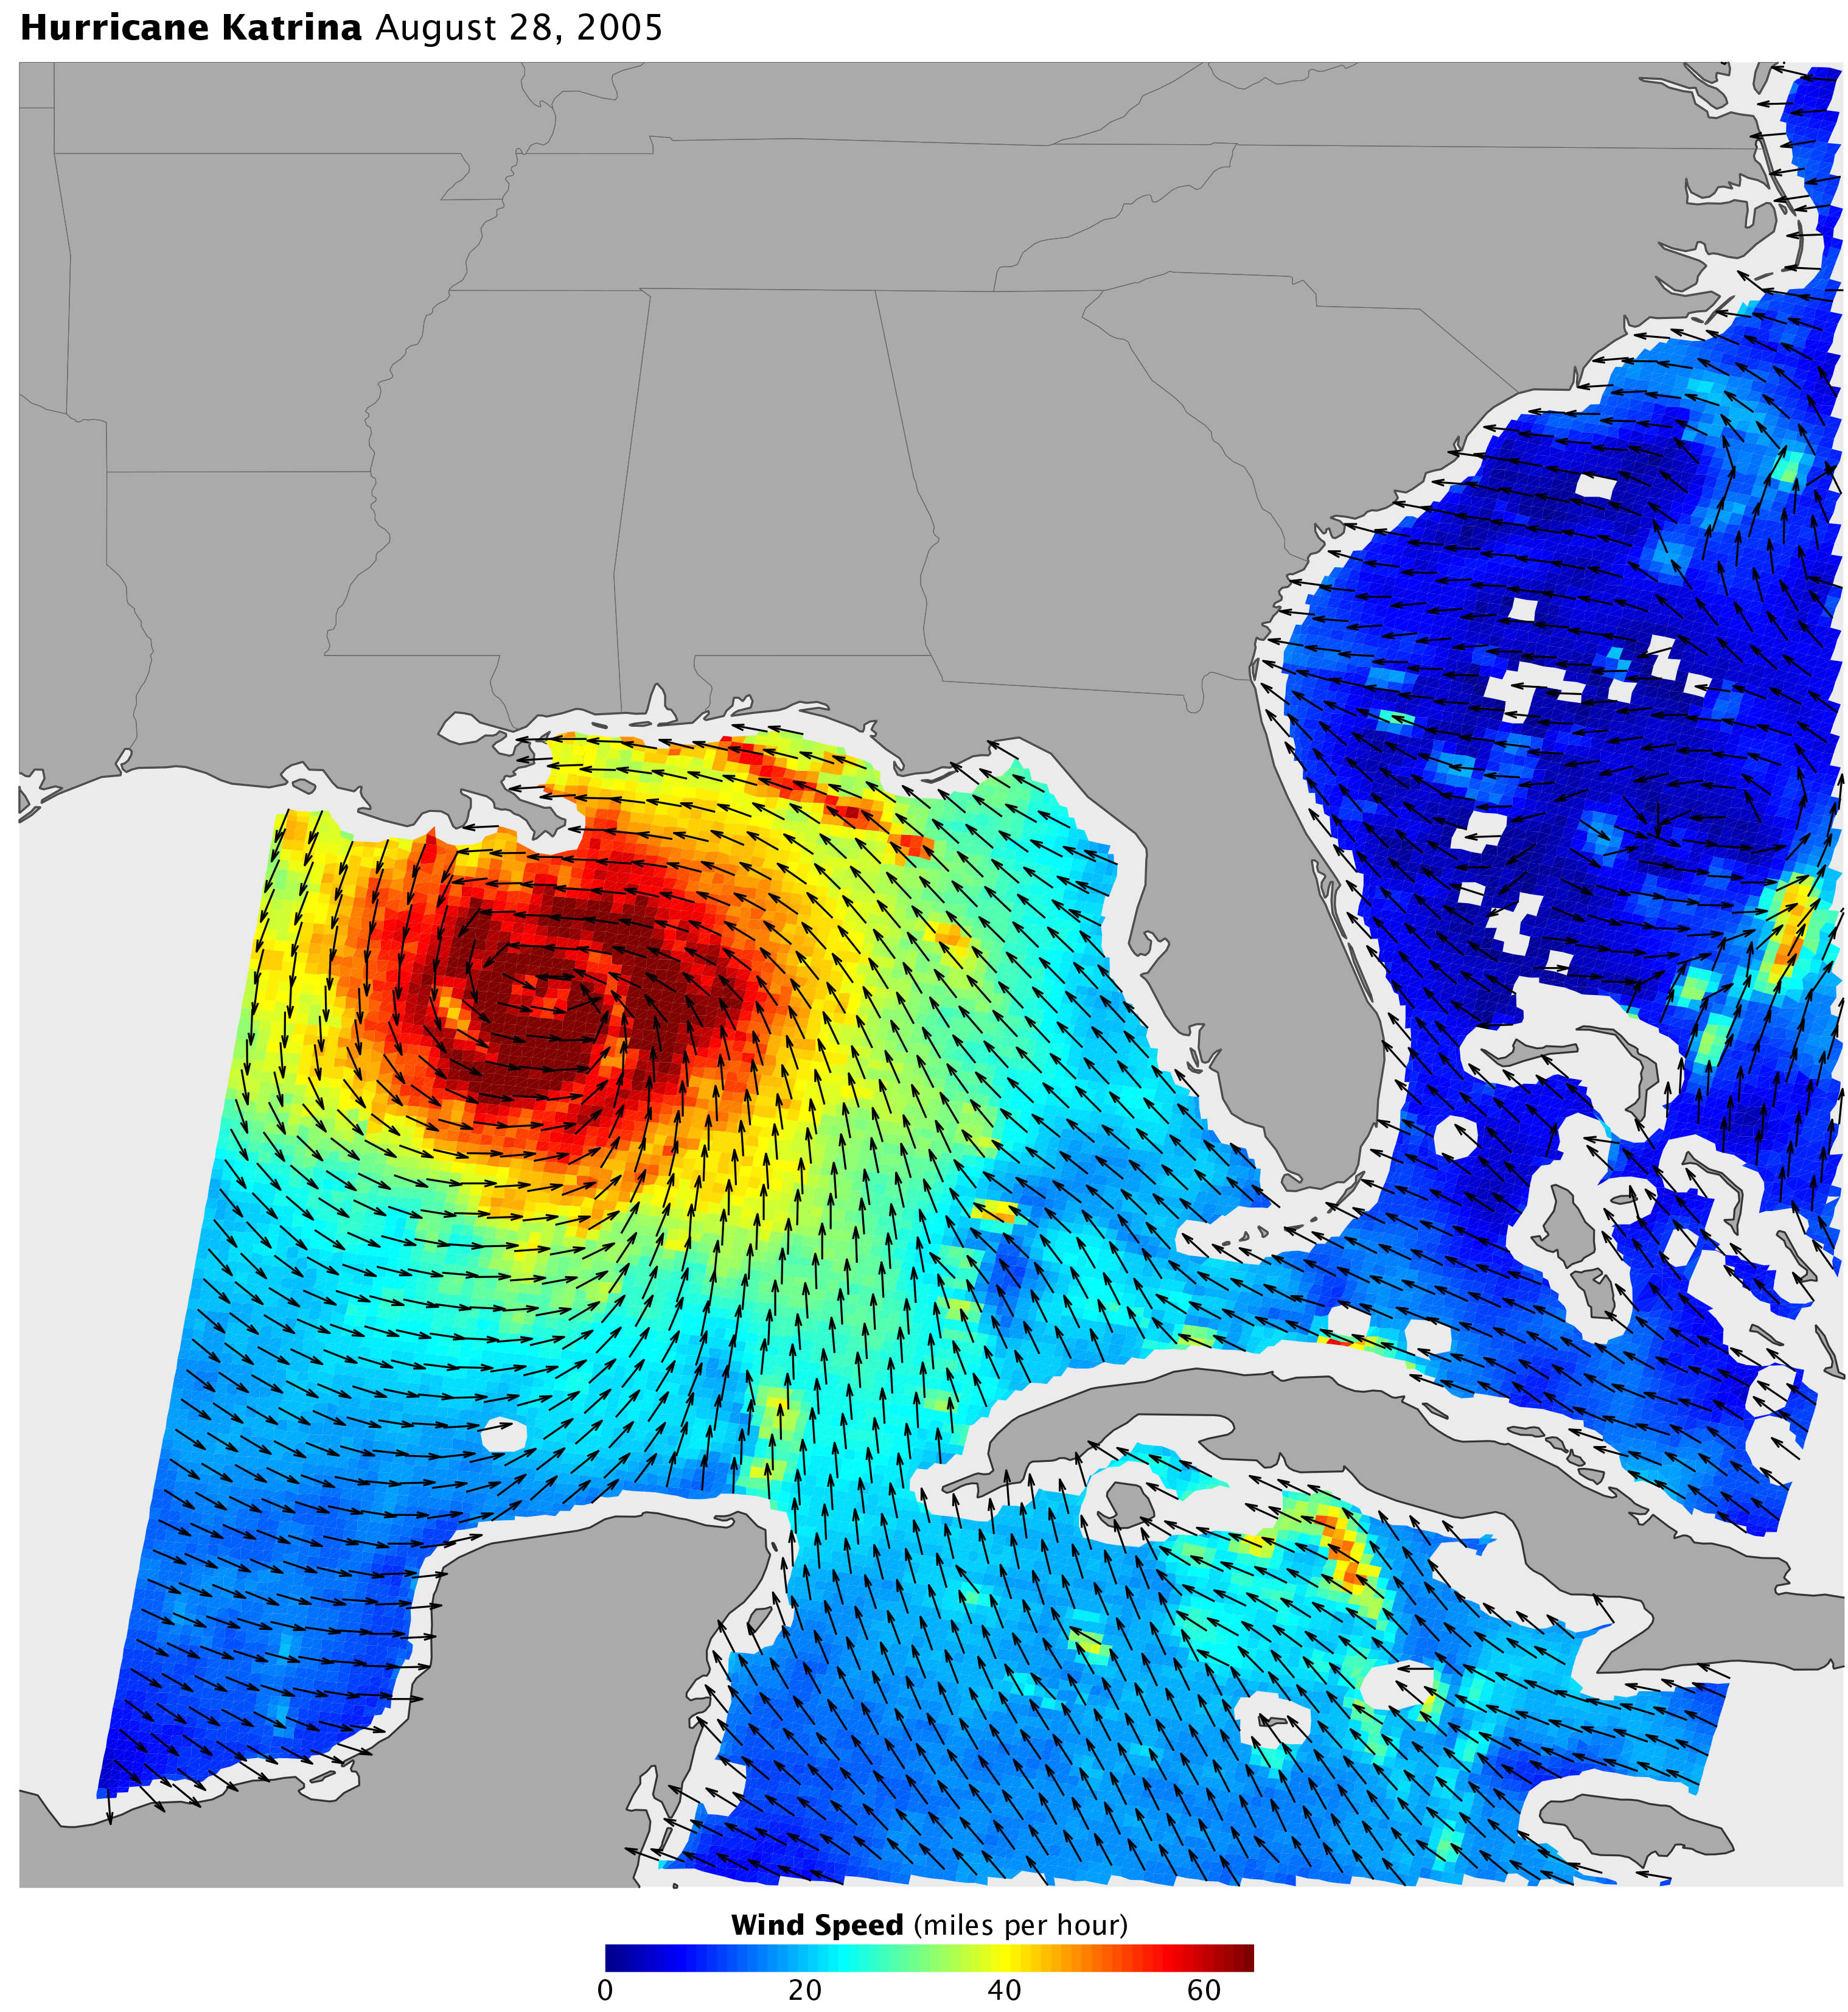
The pair of wind maps above illustrate some of the differences. The map of Sandy’s winds (top), produced with data from a radar scatterometer on the Indian Space Research Organization’s (ISRO) Oceansat-2, shows the strength and direction of Sandy’s ocean surface winds on October 28, 2012. The map of Hurricane Katrina’s winds (bottom) was made from similar data acquired on August 28, 2005, by a radar scatterometer on NASA’s retired QuickSCAT satellite. In both maps, wind speeds above 65 kilometers (40 miles) per hour are yellow; above 80 kmph (50 mph) are orange; and above 95 kmph (60 mph) are dark red.
The most noticeable difference is the extent of the strong wind fields. For Katrina, winds over 65 kilometers per hour stretched about 500 kilometers (300 miles) from edge to edge. For Sandy, winds of that intensity stretched 1,500 kilometers (900 miles).
“Katrina’s winds were more intense, but they covered less area,” said Brian McNoldy, a University of Miami meteorologist who authored a Washington Post article explaining why Sandy’s storm surge caused so much damage. “When that boils down to storm surge, Katrina was capable of generating a locally higher surge, but Sandy was capable of generating a destructive surge over a larger length of coastline.”
Another difference is the location of the strongest winds. For tropical cyclones in the northern hemisphere, the strongest winds are usually just east of the eye amidst a ring of violent thunderstorms called the eyewall. “The windfield of Katrina fits this pattern, but for Sandy the weakest winds are to the east—a hint that Sandy has already begun interacting with a system to its northeast and a blocking high to its northeast,” noted Penn State meteorologist Jenni Evans.
Data courtesy of the Jet Propulsion Laboratory's QuikSCAT and the Indian Space Research Organization OceanSat-2 missions. Caption by Adam Voiland, with information from Jenni Evans, Bryan Stiles, Brian McNoldy, and Alexander Fore.