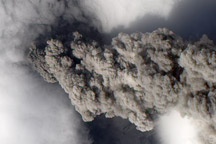

Flying through a cloud of volcanic ash poses a significant hazard to airlines. The fine, glassy particles that make up volcanic ash scour airplane windows and can clog and stall jet engines. So when clouds of volcanic ash drifted south over Europe from Iceland at various times in April and May 2010, many countries grounded all flights.
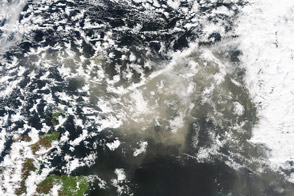
One reason for widespread closures was the challenge in knowing where the ash was. Many satellites can provide a bird’s-eye view (such as the top, nighttime image) that can identify thick plumes of ash, but few satellites can tell how high the ash is in the atmosphere. The Cloud-Aerosol Lidar and Infrared Pathfinder Satellite Observations (CALIPSO) satellite, however, records a vertical profile of the atmosphere, which reveals the altitude of ash clouds, shown in the lower image. These observations help modelers in volcanic ash advisory centers improve forecasting models and issue more accurate warnings to pilots and others with aviation interests.
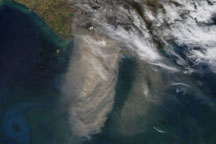
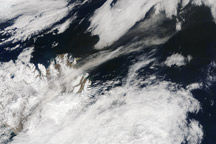
The top false-color image was made with nighttime data collected by the Moderate Resolution Imaging Spectroradiometer (MODIS) on NASA’s Aqua satellite on May 16, 2010. The image shows subtle differences in thermal energy radiated by volcanic emissions, the open ocean, and water and ice clouds. The volcanic plume is yellow, while clouds are various shades of white to light gray. Darkest areas are cloud-free views of the ocean.
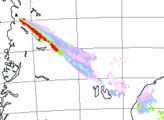
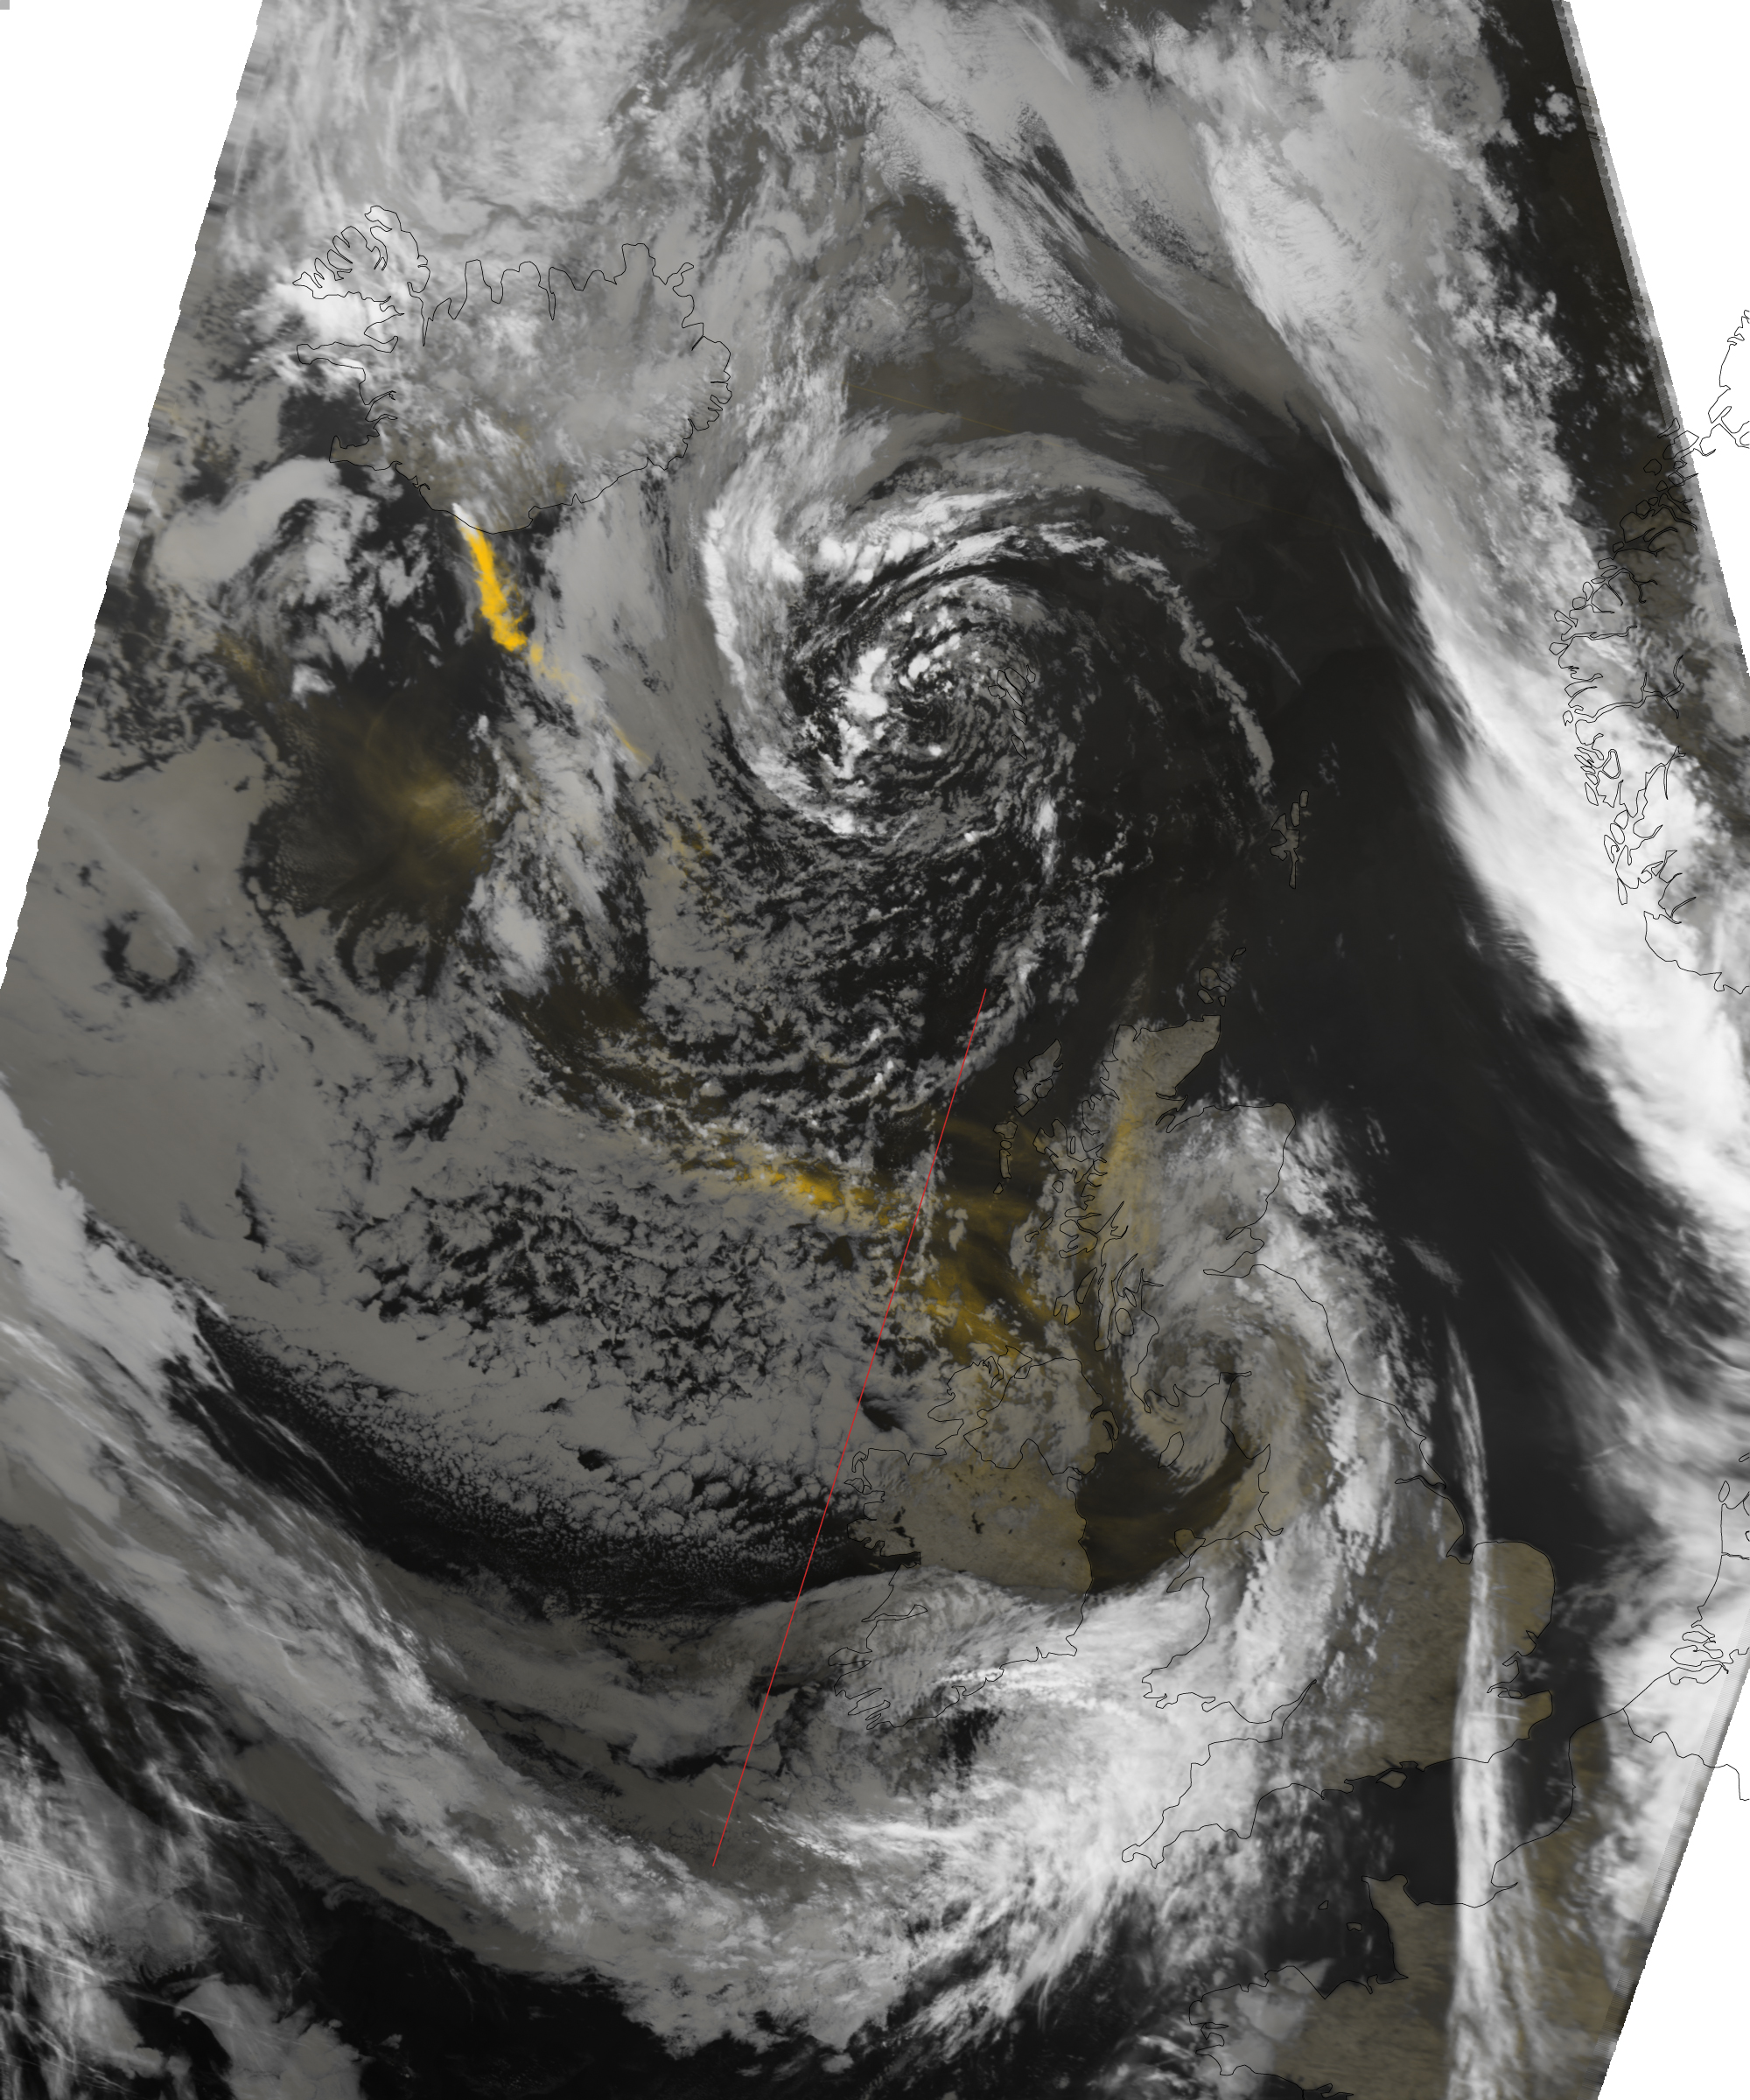
The volcanic plume flows over Ireland and the United Kingdom from the northwest. The large image, which includes a much broader area, shows the plume extending from the Eyjafjallajökull Volcano in Iceland to the UK. A red line shows the track of the CALIPSO satellite, which flew over the region a short time after Aqua.
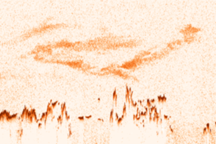
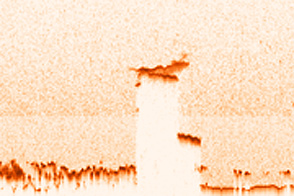
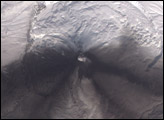
The lower image shows a vertical profile of the atmosphere, revealing that the ash was between four and six kilometers high on May 16. A joint mission between NASA and the French Centre National d'Etudes Spatiales (CNES), CALIPSO carries a pulsating laser (lidar) that sends short pulses of light through the atmosphere. Some of the light bounces off clouds and particles in the atmosphere and returns to the satellite. The strength of the returning signal provides information about the characteristics of the clouds or particles.
The length of time the lidar’s light pulse takes to return to the satellite provides information about where the clouds or particles are in the atmosphere. On May 16, a bank of clouds covered much of the ocean at an altitude of about two kilometers. Breaks in the clouds are represented by a drop in altitude in the atmospheric profile—showing how the laser light being scattered back to the satellite was coming from farther away. In the north (right), the cloud cover is less uniform, with scattered clouds creating jagged peaks in the profile. The volcanic ash is above the clouds at about six kilometers high, the altitude at which models predicted it would be.
The London Volcanic Ask Advisory Center at the UK Met Office uses satellite measurements like these to validate model results. The models integrate weather forecasting models with models of the way ash moves through the atmosphere to predict where volcanic ash will be. The satellite measurements give modelers a way to check their predictions and improve future forecasts. NASA Langley Research Center produces expedited CALIPSO data. Data and images compatible with Google Earth are available from the Goddard Earth Sciences Data and Information Services Center.
NASA Earth Observatory image created by Jesse Allen and Robert Simmon, using data provided by Charles Trepte of CALIPSO Project Science Office. Caption by Holli Riebeek. Thanks go to James Acker, NASA GSFC/Wyle IS LLC, for identifying the event.