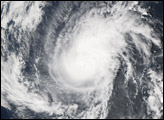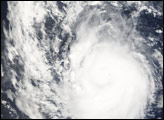
As October drew to a close, Hurricane Paul was approaching the southern tip of Mexico’s Baja Peninsula. The sixteenth named Pacific storm of the 2006 season, Paul was whipping up sustained winds of 165 kilometers per hour (105 miles per hour) at the time of the National Hurricane Center’s 11:00 a.m. Pacific Daylight Time briefing on October 23. The storm track and intensity forecasts for Paul were still uncertain at that time, but landfall along the southern tip of Baja Peninsula as a strong storm was still a possibility.
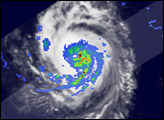
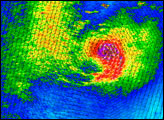
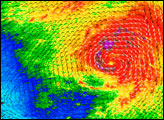
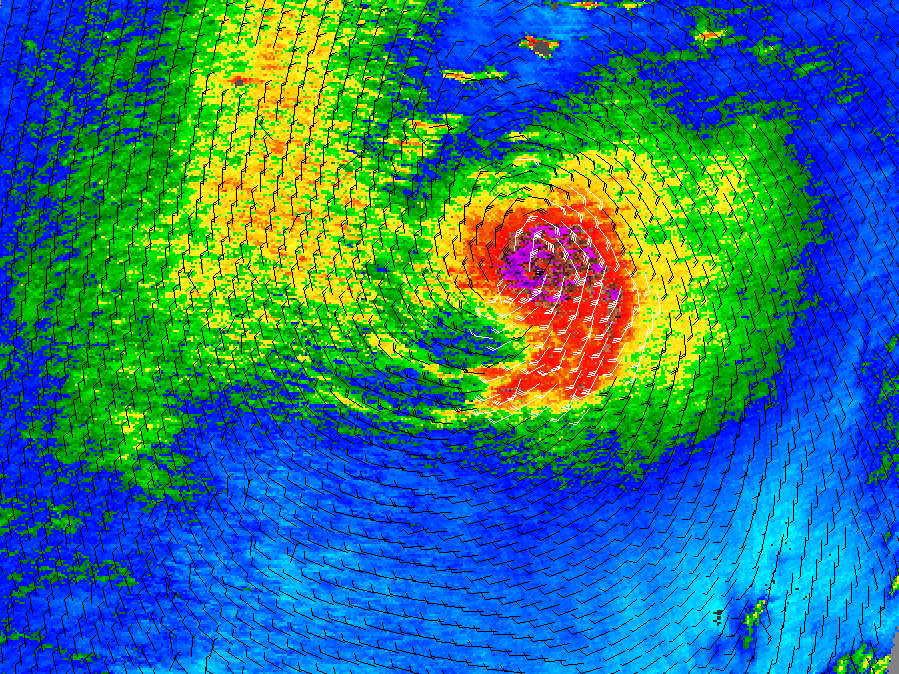
This data visualization of Hurricane Paul shows wind speed in color and wind direction with small barbs. White barbs point to areas of heavy rain. The highest wind speeds, shown in purple, surround the center of the storm. The data were obtained by NASA’s QuikSCAT satellite on October 23, 2006, at 01:46 UTC (8:46 a.m. local time). Paul appears to be symmetrically shaped in this image, with wind direction barbs showing that the center of the storm has a well-defined spiral pattern around the eye. The strongest winds form a bullseye pattern around the central, calmer region of the eye of the storm.
Aircraft and buoy-based measurements of the wind strength of Hurricane Paul would likely show sustained winds higher than those estimated from QuikSCAT observations. This difference is because the power of the storm makes accurate measurements from satellite difficult. The scatterometer sends pulses of microwave energy through the atmosphere to the ocean surface, and measures the energy that bounces back from the wind-roughened surface. The energy of the microwave pulses changes depending on wind speed and direction.
Tropical cyclones (the generic term for hurricanes and typhoons), however, are difficult to measure. To relate the radar signal the satellite measures to actual wind speed, scientists compare measurements taken from buoys and other ground stations to data the satellite acquired at the same time and place. Because the high wind speeds generated by cyclones are rare, scientists do not have corresponding ground information to know how to translate data from the satellite for wind speeds above 50 knots (about 93 km/hr or 58 mph). Also, the unusually heavy rain found in a cyclone distorts the microwave pulses in a number of ways, making a conversion to accurate wind speed difficult.
Instead, the scatterometer provides a picture of the relative wind speeds within the storm, as well as wind direction. These pieces of information can let meteorologists know where and when a storm’s center of circulation has developed.
NASA image courtesy of David Long, Brigham Young University, on the QuikSCAT Science Team, and the Jet Propulsion Laboratory.