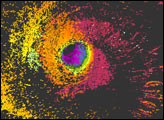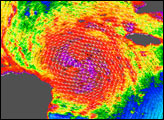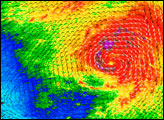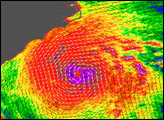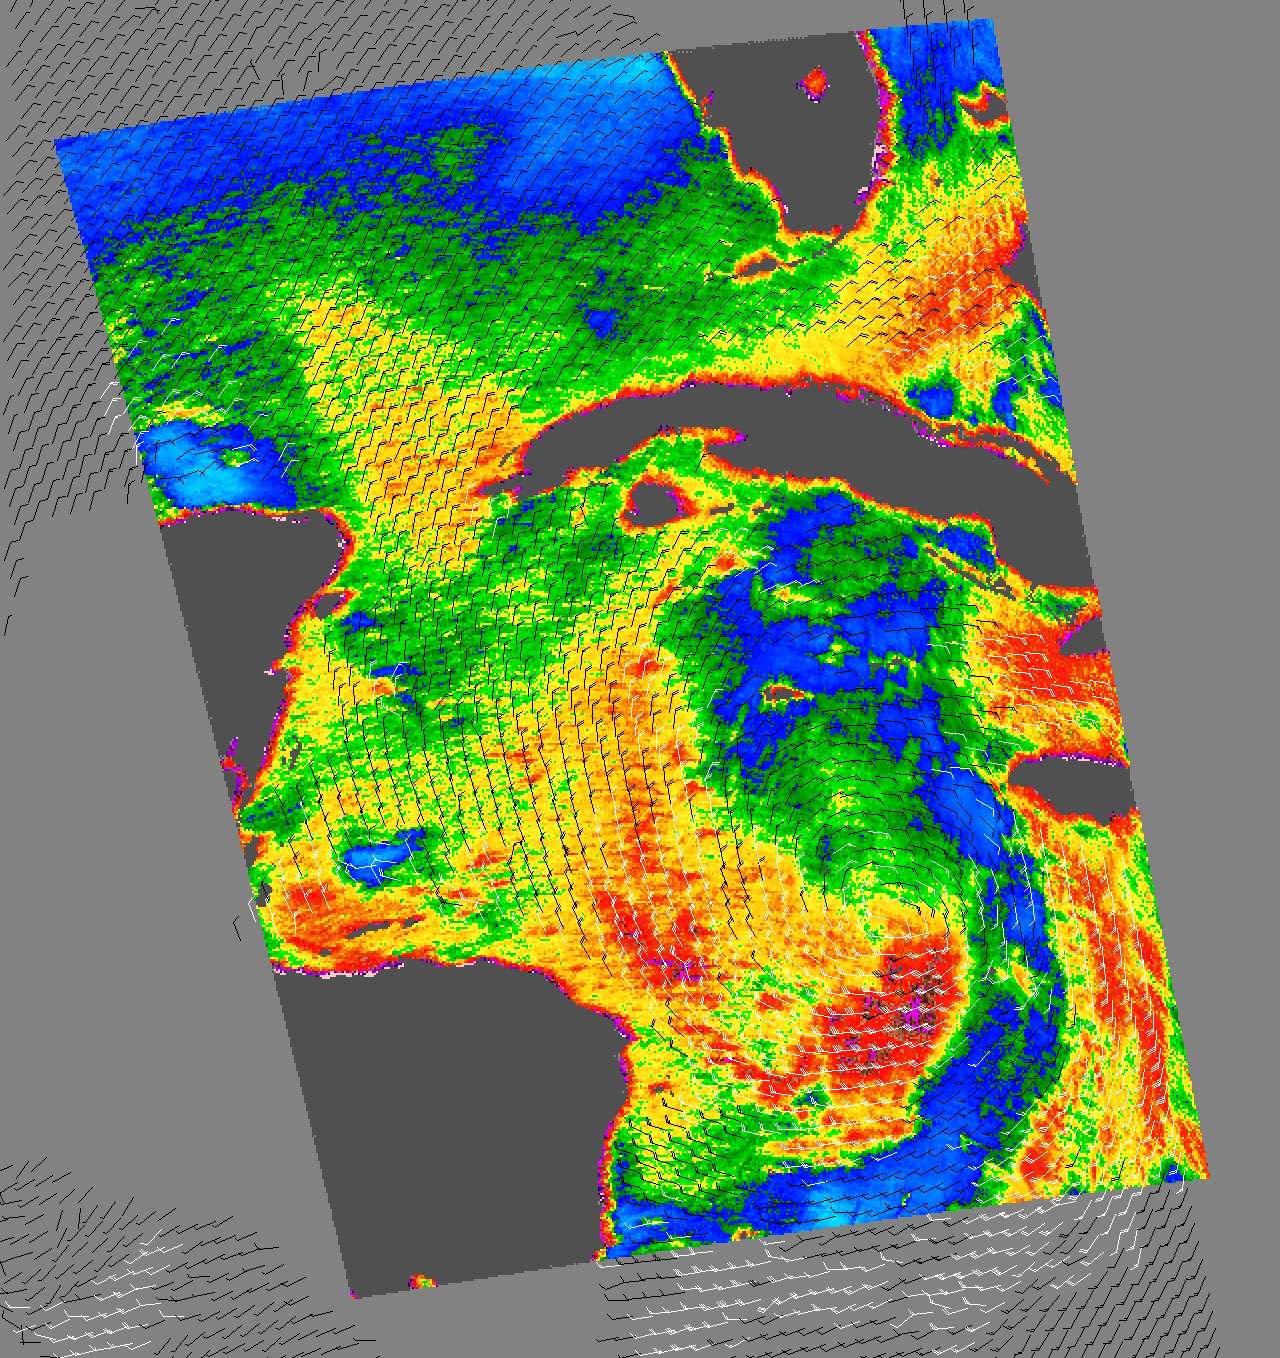
Tropical Storm Wilma is shown here as observed by NASA’s QuikSCAT satellite on October 17, 2005, at 9:28 UTC (5:28 a.m. Eastern Daylight Time). At this time, the storm had 65-kilometer-per-hour (40-mile-per-hour; 35-knot) sustained winds. At the time of this observation, Wilma had only just become strong enough to be classified as a tropical storm and to acquire a name. Doing so, Wilma became the 21st named storm of the 2005 hurricane season. At the time of this image acquisition, Wilma was continuing to gradually build power and was projected to reach hurricane strength in the ensuing 24 hours, as winds steered the storm into the deep, warm water pool of the Gulf of Mexico.
The image depicts wind speed in color and wind direction with small barbs. White barbs show to areas of heavy rain. The highest wind speeds surround the center of the storm where the developing spiral structure can be discerned.
Measurements of the wind strength of Wilma from QuikSCAT may be slightly different from those measured by other means on the ground. The scatterometer sends pulses of microwave energy through the atmosphere to the ocean surface, and measures the energy that bounces back from the wind-roughened surface. The energy of the microwave pulses changes depending on wind speed and direction, giving scientists a way to monitor wind around the world. To relate the radar energy return to actual wind speed, scientists compare measurements taken from buoys and other ground stations to data the satellite acquired at the same time and place. However, the unusually heavy rain found in a cyclone distorts the microwave pulses in a number of ways, making a conversion to accurate wind speed difficult.
NASA image courtesy of David Long, Brigham Young University, on the QuikSCAT Science Team, and the Jet Propulsion Laboratory.