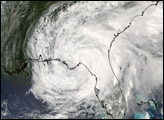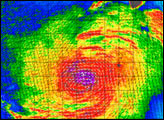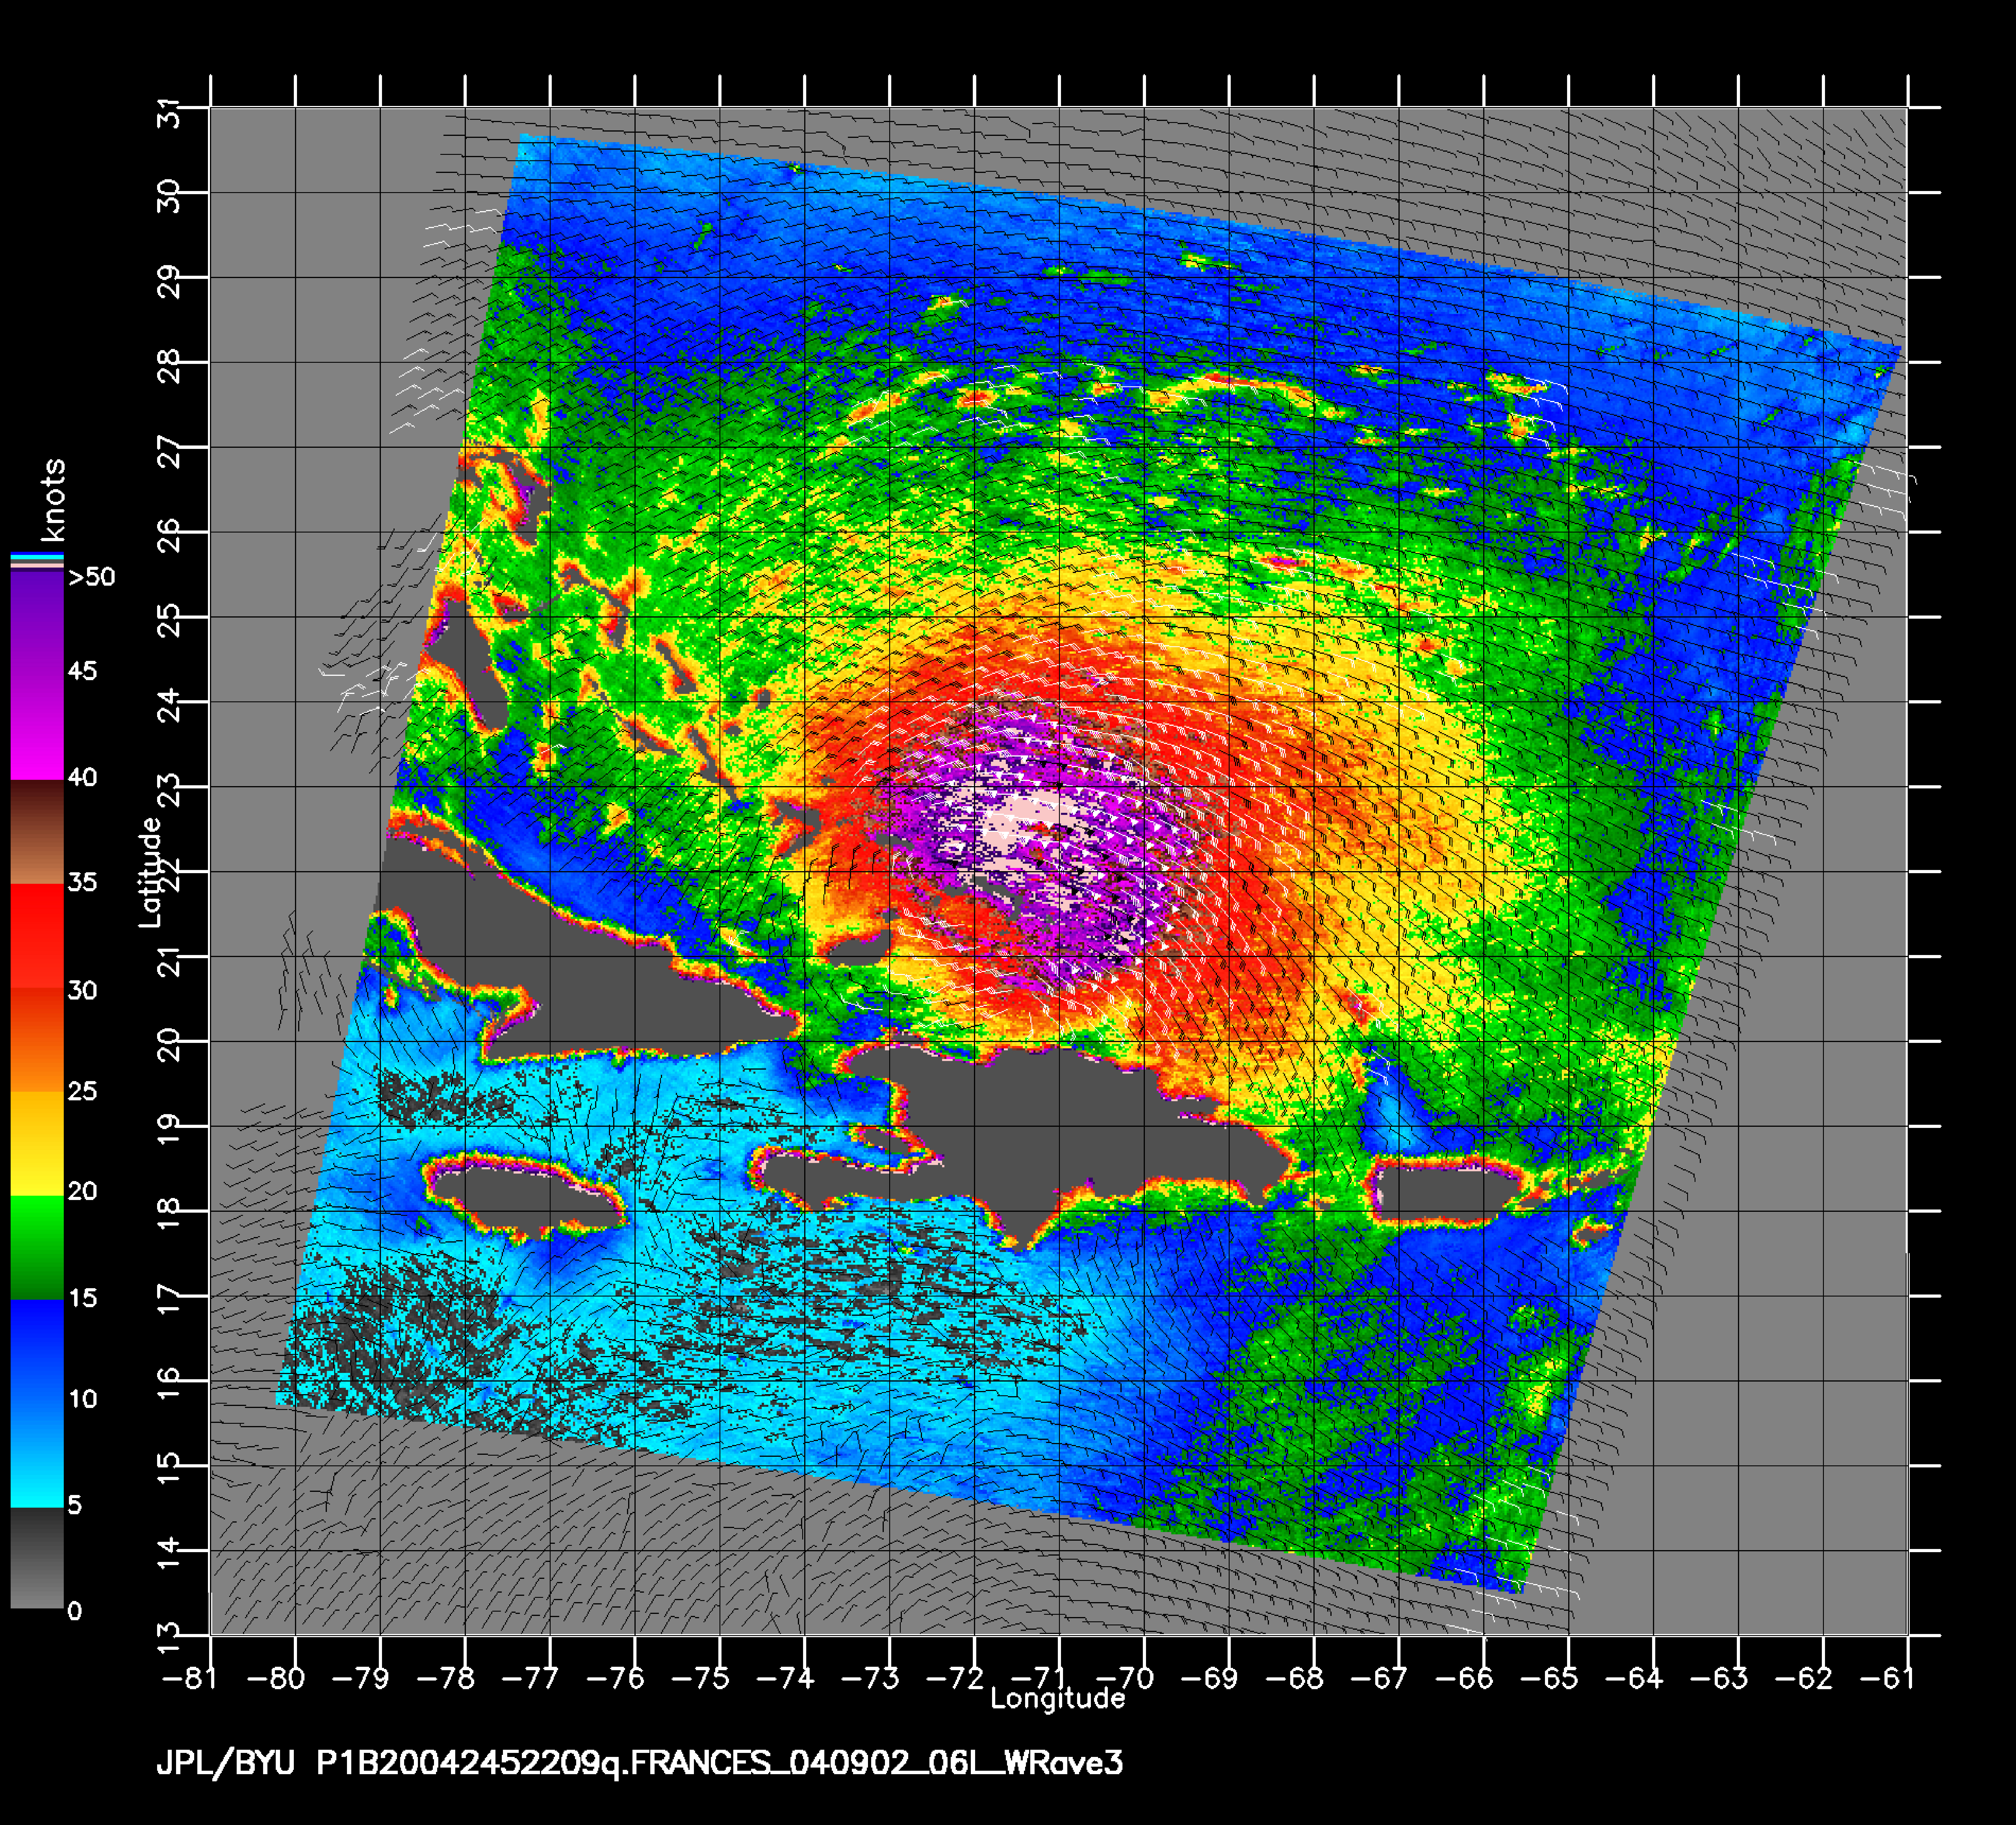
The SeaWinds scatterometer aboard NASA’s QuikSCAT satellite collected the data used to create this colorful image of hurricane Frances as it approached Cuba on September 1, 2004, at 6:09 p.m. EDT. The colored background shows the near-surface wind speeds at 2.5 km resolution. The strongest winds, shown in purple, are at the center of the storm, with gradually weakening winds forming rings around the center. The black barbs indicate wind speed and direction at QuikSCAT’s nominal 25 km resolution; white barbs indicate areas of heavy rain. The black grid over the image show degrees of latitude and longitude. The vertical lines of longitude start at 77 West on the left and run to 65 on the right. The horizontal lines of latitude start at 18 North on the bottom and run to 27 North on top.
NASA’s Quick Scatterometer (QuikSCAT) spacecraft was launched from Vandenberg Air Force Base, California on June 19, 1999. QuikScat carries the SeaWinds scatterometer, a specialized microwave radar that measures near-surface wind speed and direction under all weather and cloud conditions over the Earth’s oceans.
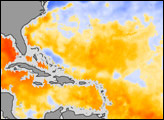
In recent years, the ability to detect and track severe storms has been dramatically enhanced by the advent of weather satellites. Data from the SeaWinds scatterometer is augmenting traditional satellite images of clouds by providing direct measurements of surface winds to compare with the observed cloud patterns in an effort to better determine a hurricane’s location, direction, structure, and strength. Specifically, these wind data are helping meteorologists to more accurately identify the extent of gale-force winds associated with a storm, while supplying inputs to numerical models that provide advanced warning of high waves and flooding.
NASA image courtesy the QuikSCAT team at NASA’s Jet Propulsion Laboratory.