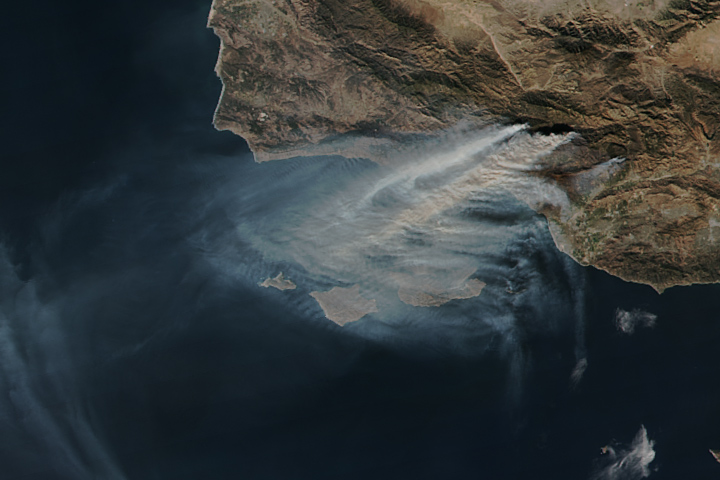
After more than a week of burning, the wildfires in Southern California continue to loft a nasty mixture of aerosols and gases into the atmosphere.
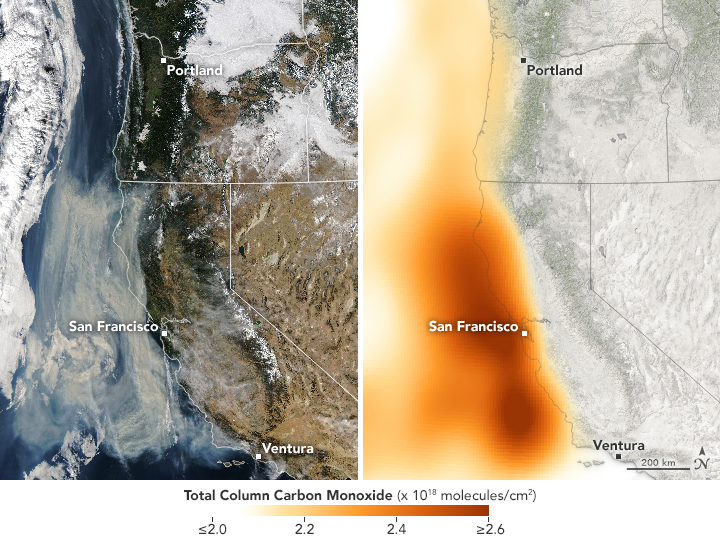
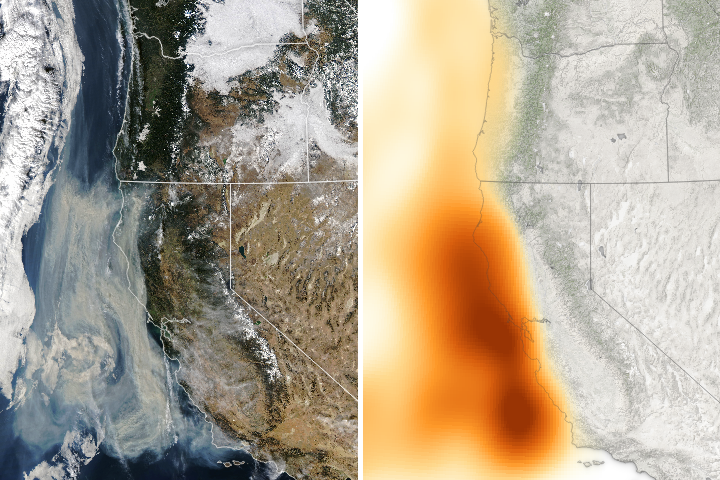
On December 11, 2017, the Moderate Resolution Imaging Spectroradiometer (MODIS) on NASA’s Aqua satellite acquired a natural color image (left) of smoke billowing from the Thomas Fire in Ventura County, California. By that day, the fire had already burned 230,500 acres (93,000 hectares or 360 square miles).
The corresponding map (right) shows the concentration of carbon monoxide in the area, based on data collected by the Atmospheric Infrared Sounder (AIRS) on Aqua. The concentrations reflect total “column” amounts of the gas, measured vertically through the atmosphere by AIRS. Orange areas indicate the highest concentrations of carbon monoxide.
When fires burn through a fuel source—such as vegetation, gasoline, or coal—emissions can include everything from hydrocarbons, nitrogen oxides, and carbon monoxide. Close to the source of the fire, the air quality on that day was rated unhealthy. As the image pair shows, smoke and carbon monoxide appear offshore as well.
Dejian Fu, an atmospheric scientist at NASA’s Jet Propulsion Laboratory, thinks that the carbon monoxide plume likely stemmed from the burning onshore and then blew out over the Pacific Ocean. This map shows the gas concentration up to an altitude of about 5 kilometers above the surface.
Carbon monoxide contributes to reactions that produce ground-level ozone, a harmful pollutant. It can also make breathing difficult to dangerous when trapped near the ground.
NASA Earth Observatory images by Joshua Stevens, using MODIS data from LANCE/EOSDIS Rapid Response and AIRS data from the Goddard Earth Sciences Data and Information Services Center (GES DISC). Story by Kathryn Hansen.


