Key reservoirs in South Africa’s Western Cape province have dropped to critical levels. At the start of November 2017, Theewaterskloof reservoir, the largest in the province’s water supply system, had dropped to 27 percent of capacity. Voëlvlei, the second largest, was at 28 percent of capacity.
Following two successive dry years, the Western Cape government declared the province a disaster area in May 2017. With the rainy season (April through September) now past, hopes that nature would ease the drought this year have faded.
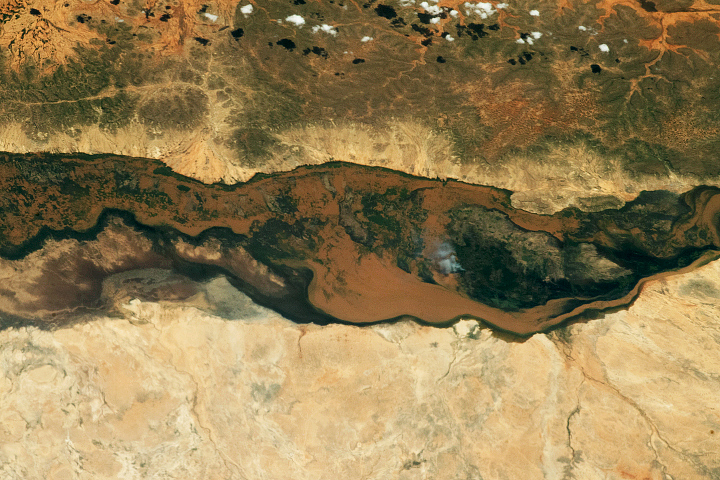
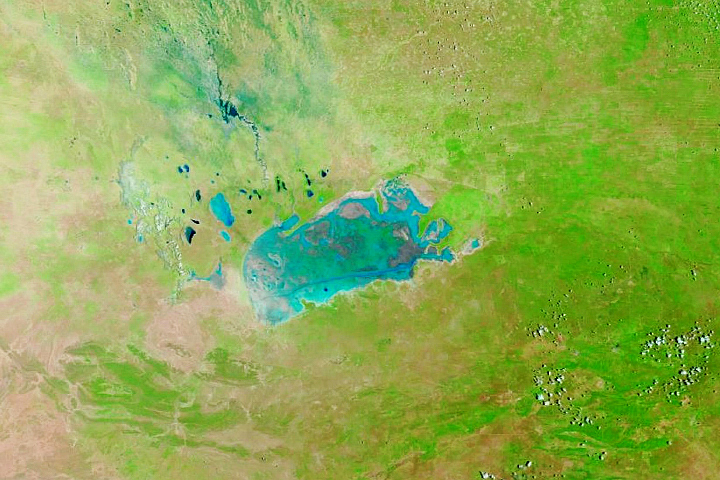
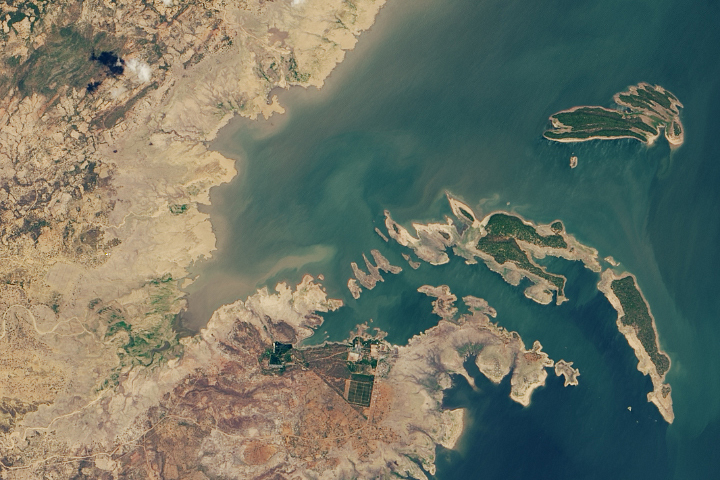
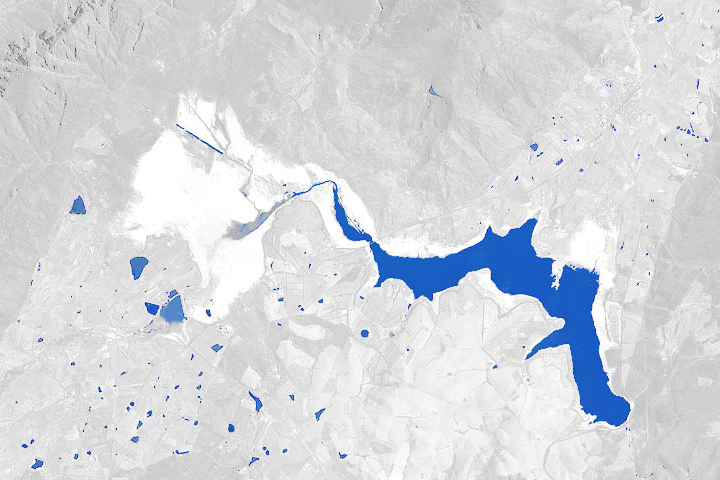
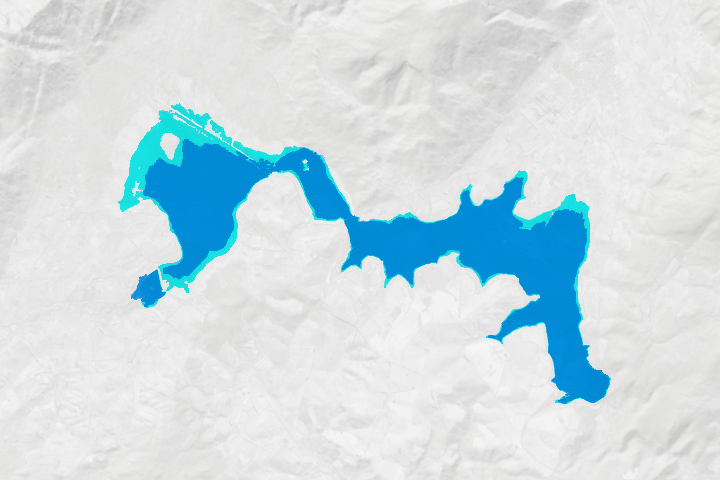
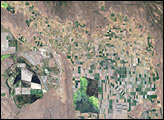
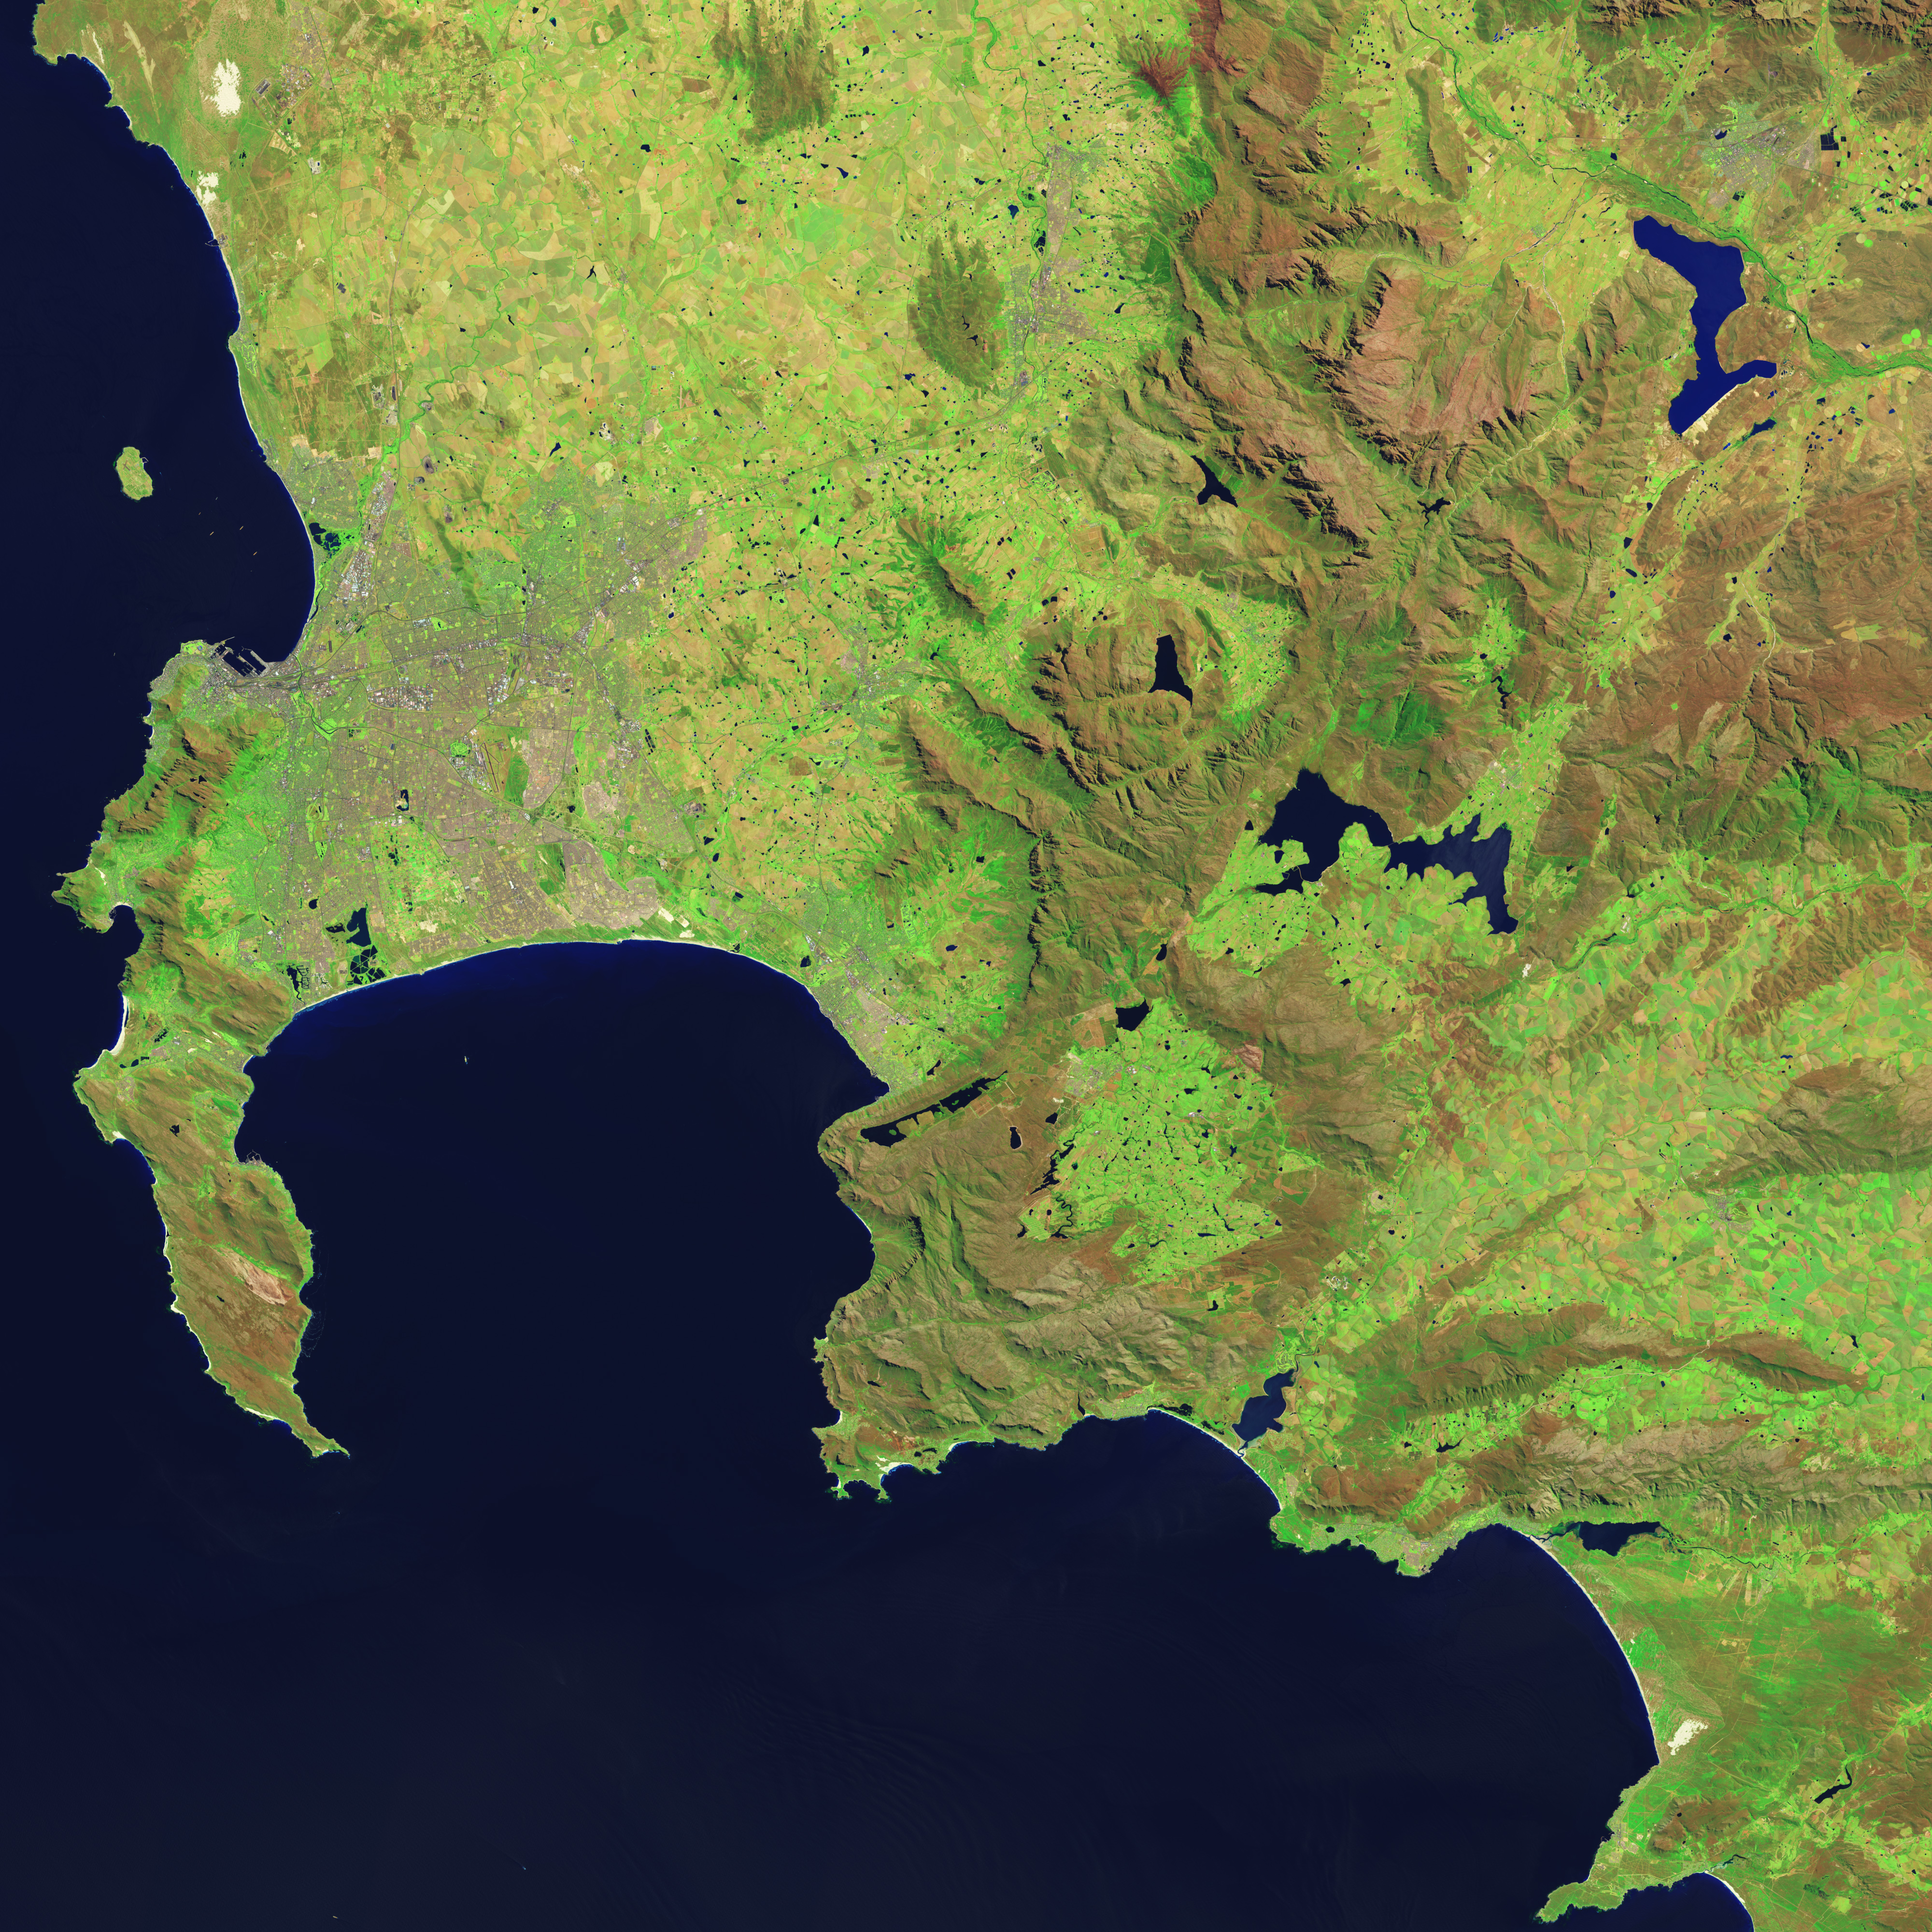
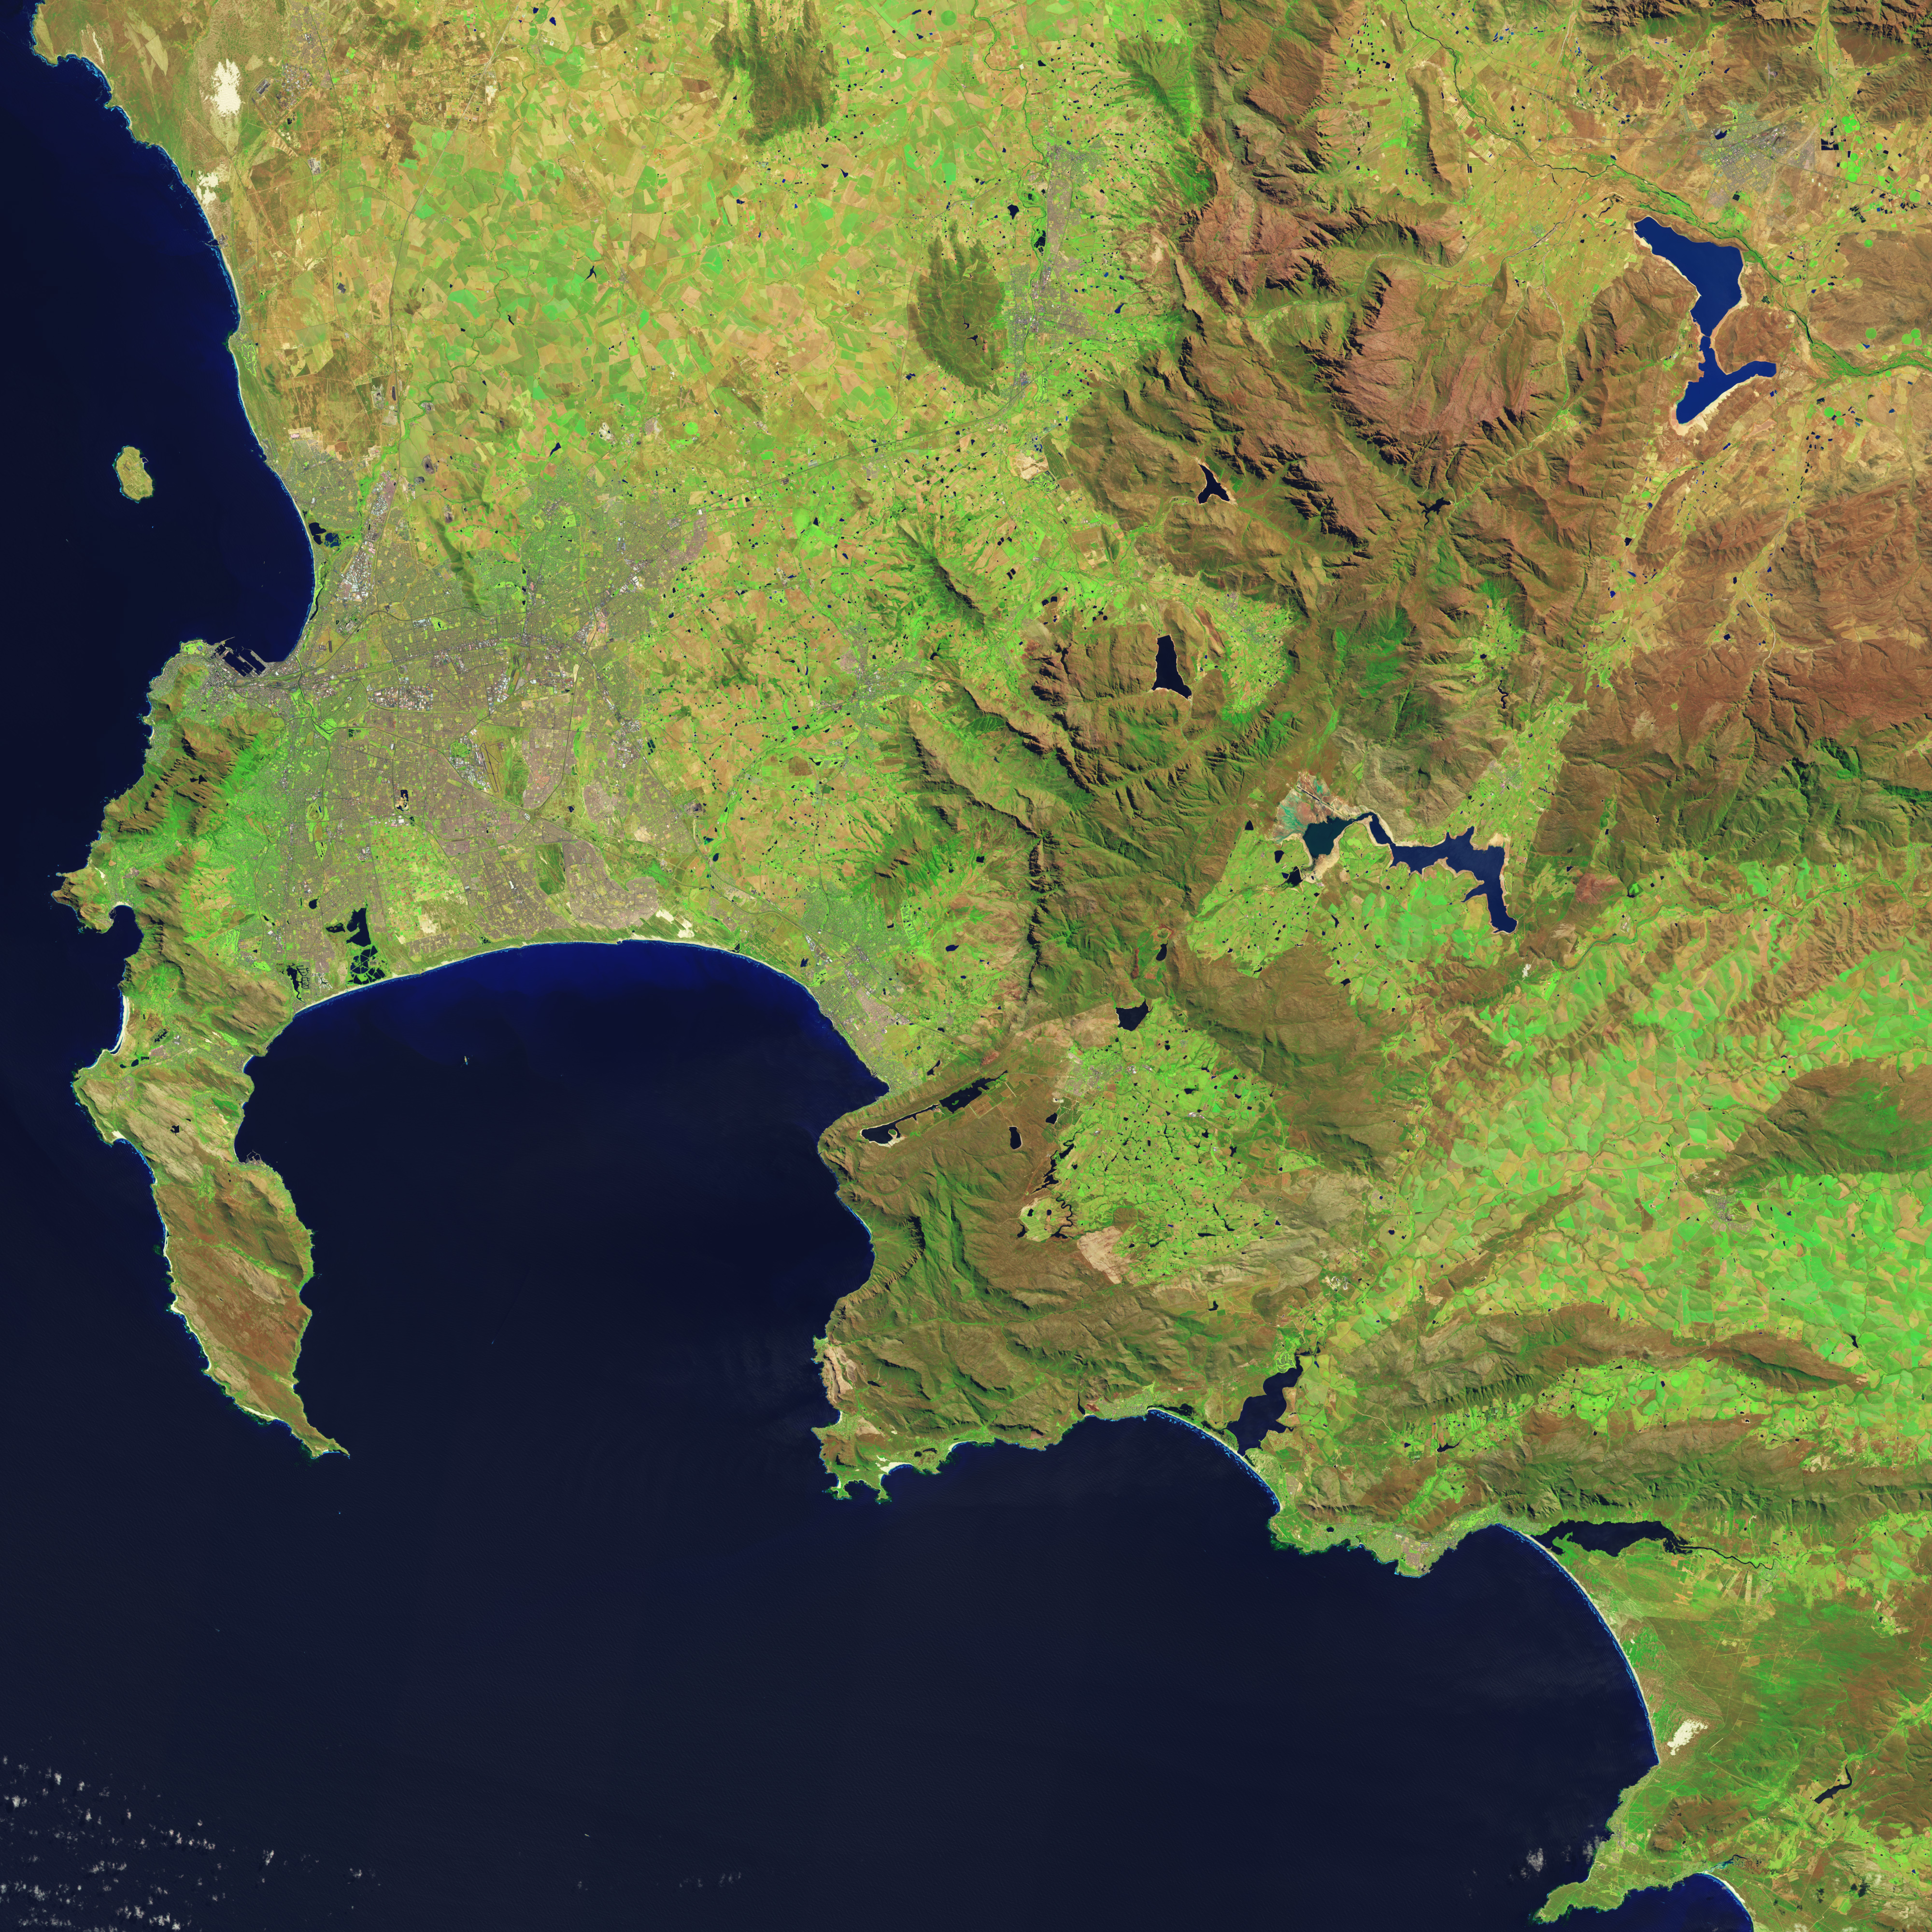
The two satellite images above show Theewaterskloof before and during the drought. The top image was acquired on October 18, 2014, when the reservoir was at full capacity. The second image was collected on October 10, 2017, when it was at 27 percent capacity. Notice the tan “bathtub ring” of exposed sediment around the edges of the basin—an indication of lowered water levels.
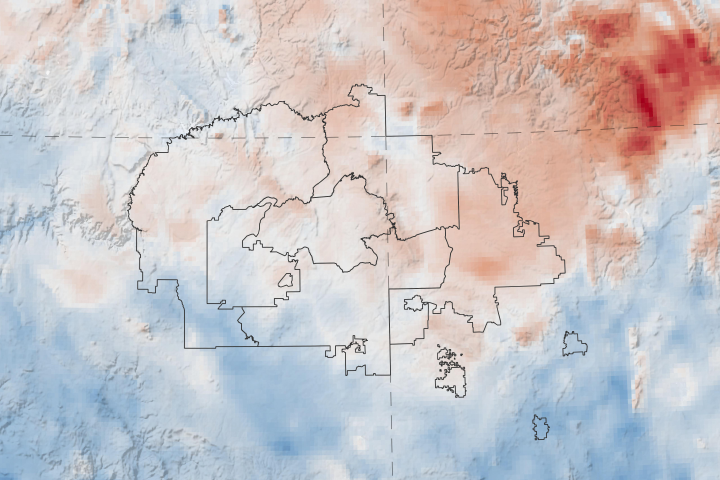
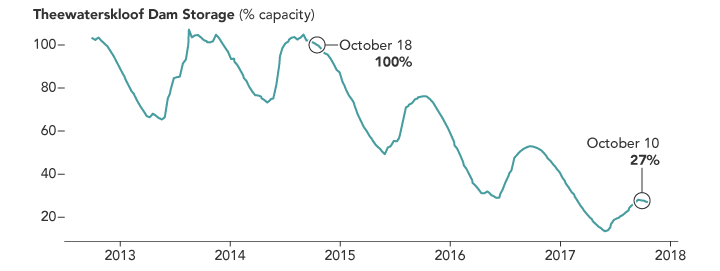
The line chart below details how water levels have changed since 2013. Trouble first emerged when rains faltered in 2015, a year when the weather station at Cape Town airport tallied only 280 millimeters (11 inches) of rain by November (450 mm is normal). The next year was even worse—the total was 206 mm. In 2017, just 135 mm of rain had fallen by November.
Cape Town authorities have put tight restrictions on residential water usage even as they pursue efforts to recycle more water, establish new desalinization facilities, and drill for new sources of groundwater.
Guidelines for water usage released in September banned all use of drinking water for non-essential purposes and urged people to use less than 87 liters (23 gallons) of water per person, per day. Among the suggestions for achieving this: reducing showers to less than two minutes, reusing shower water elsewhere around the house, and fixing leaks. Authorities also urged people to stop hosing paved surfaces, washing vehicles, and using portable play pools.
NASA Earth Observatory images by Jesse Allen, using Landsat data from the U.S. Geological Survey and water level chart by Joshua Stevens using data from South Africa’s Department of Water and Sanitation. Story by Adam Voiland.