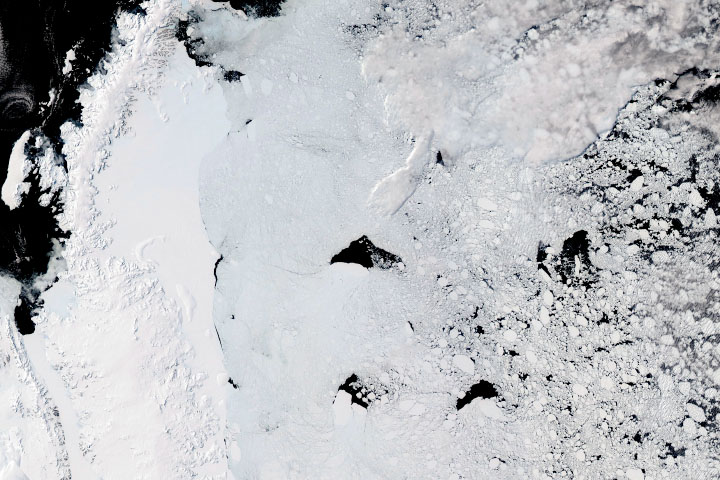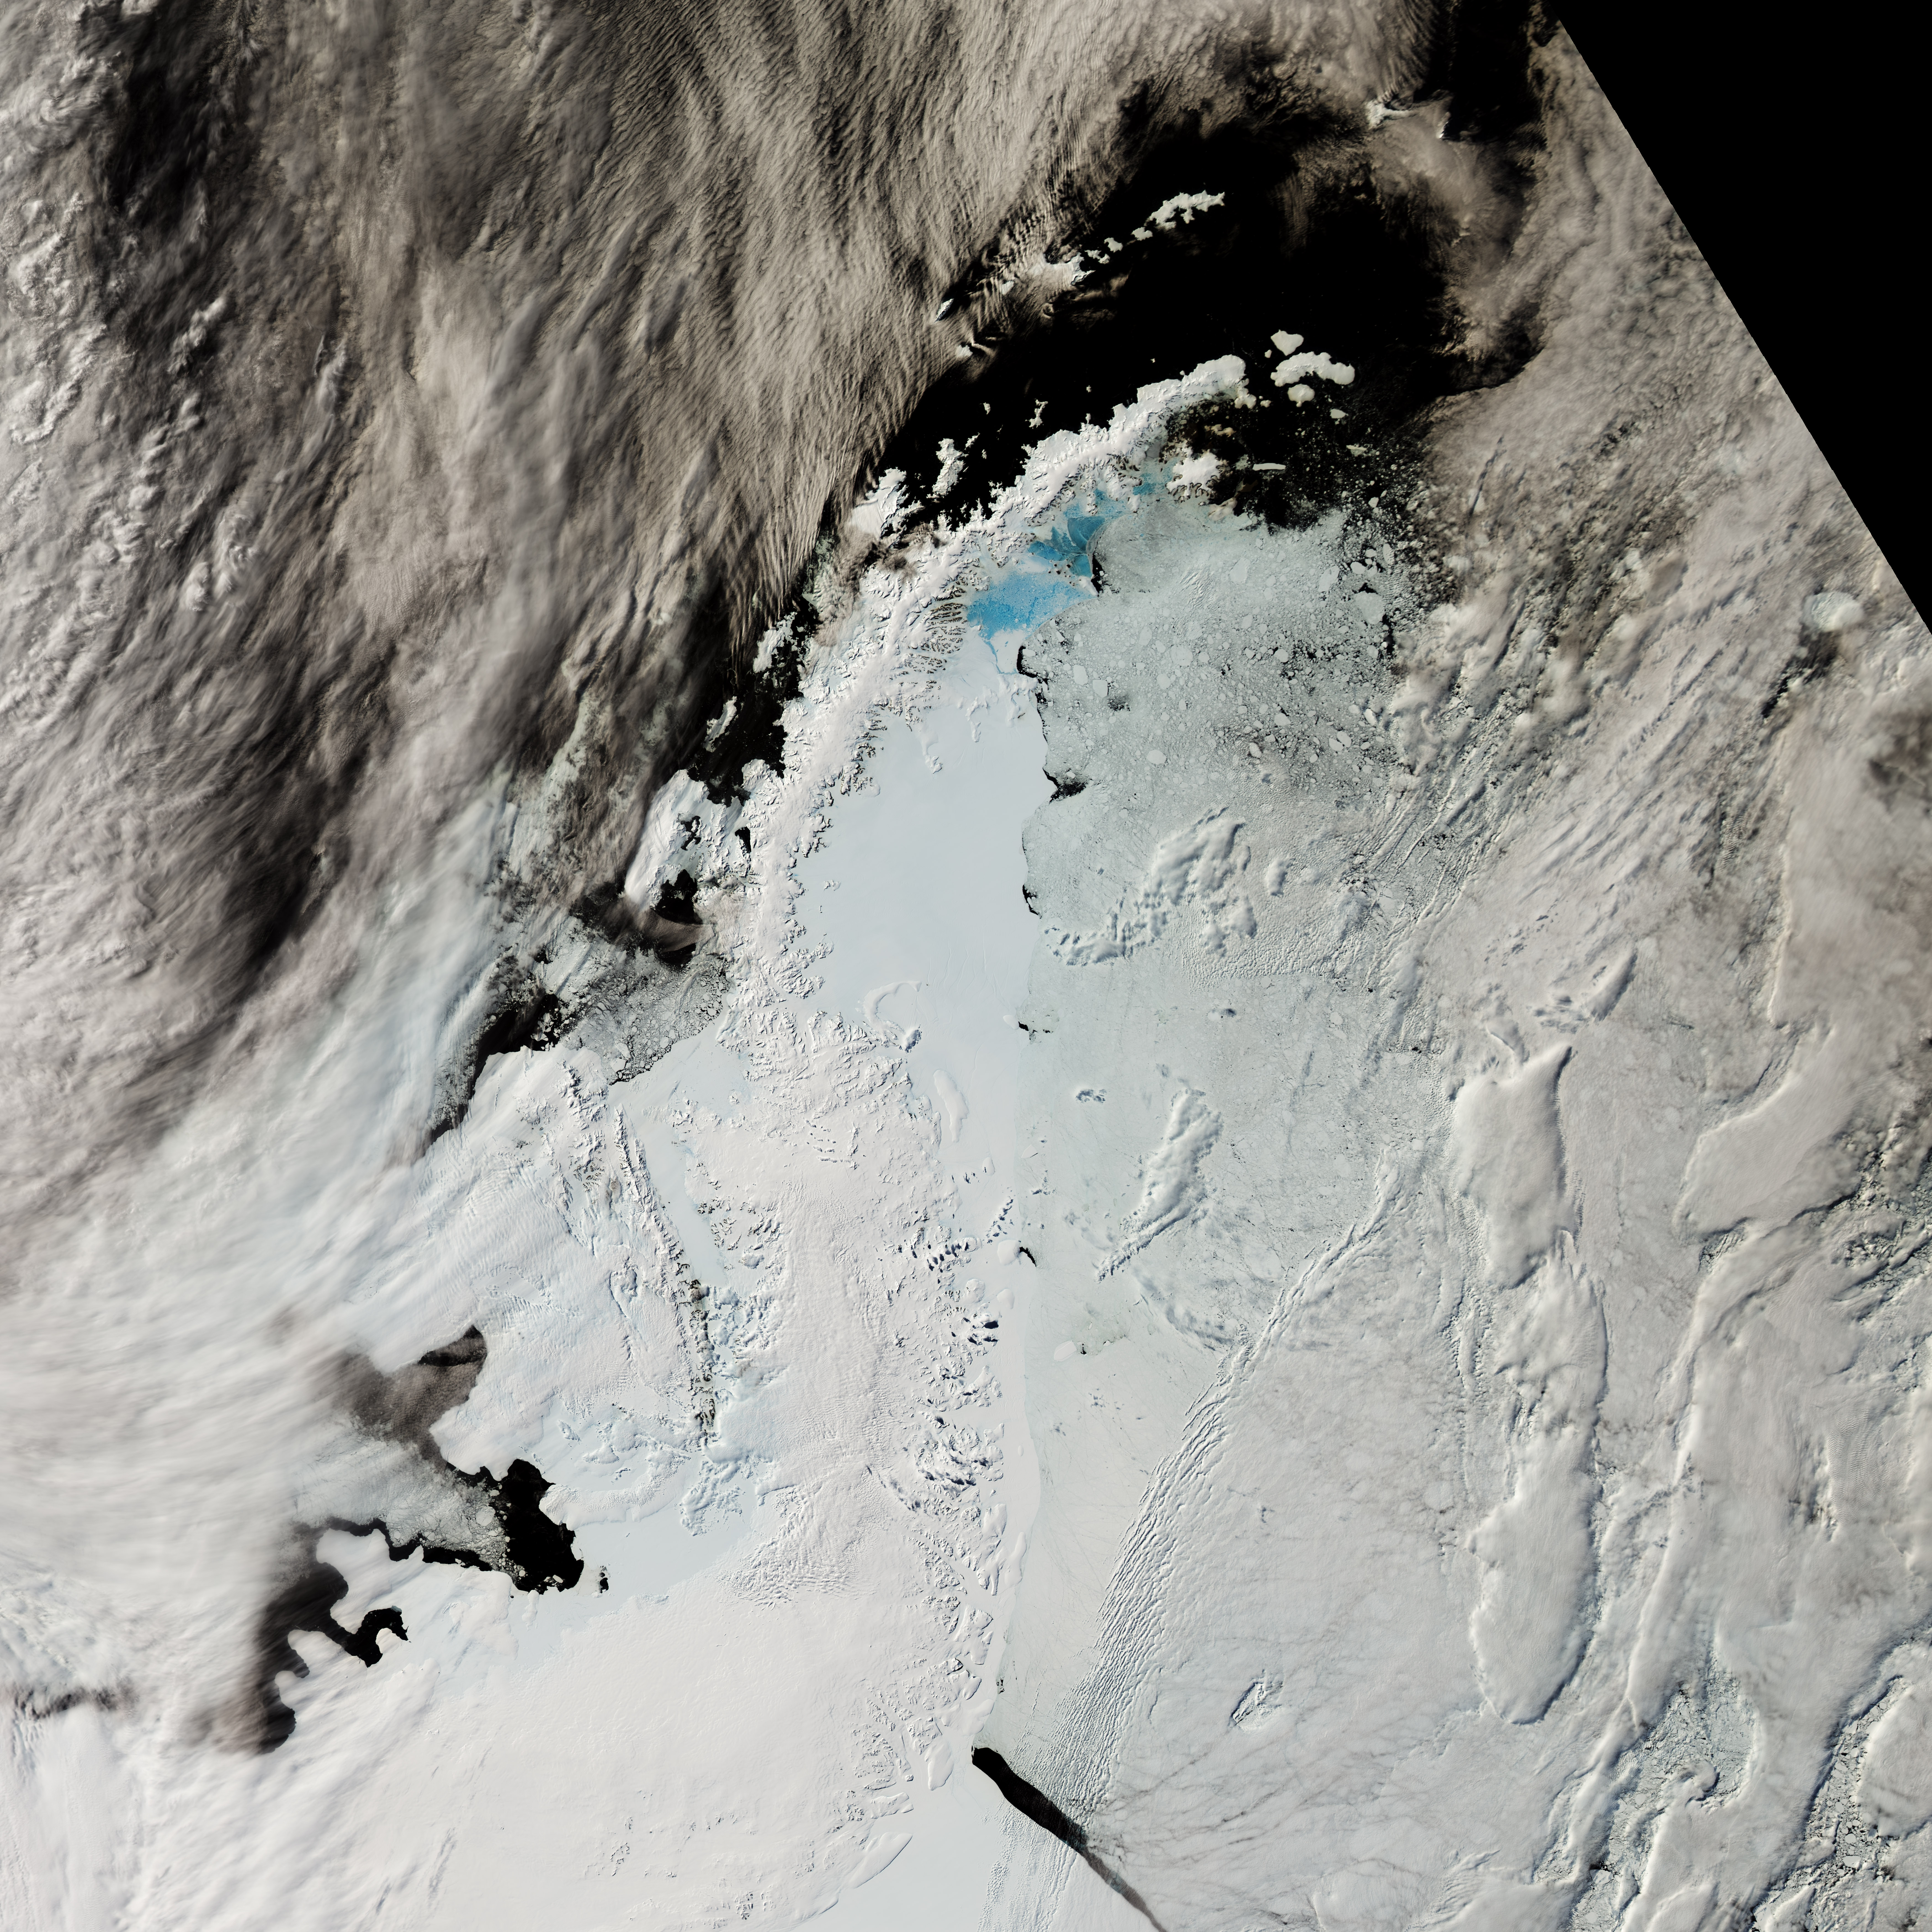
It is rare for satellites to get a clear view of the whole Antarctic Peninsula, the northernmost arm of the continent and one of the largest contributors to sea level rise during the past half-century. In the winter, darkness hides much of this rocky, ice-covered strip; in the summer, clouds usually block the view.
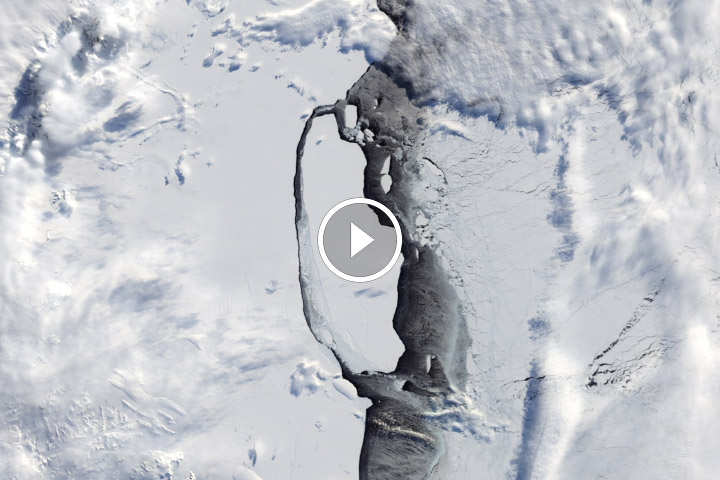
But every now and then, usually in January or February, there is enough of a break in the clouds to get a good glimpse. That is what happened on January 8, 2016, when the Moderate Resolution Imaging Spectroradiometer (MODIS) on NASA’s Aqua satellite captured this remarkably clear view of the peninsula.
The ice-covered and mountainous peninsula stretches 1,300 kilometers (800 miles) into the Southern Ocean. Some geologists think that millions of years ago the mountains may have connected to the Andes. An arcing underwater ridge connects the tip of the peninsula with several small islands (South Georgia, South Sandwich, and South Orkney) then continues to Tierra del Fuego, the southernmost point of South America.
As with most of Antarctica, the feature that dominates the peninsula and the ocean surrounding it is ice. There is ice on land: the glaciers and ice sheets. There are thick slabs of floating ice that fan out along the coasts: the ice shelves. There are blocky chunks of floating ice that break off, or calve, into the sea—icebergs. Finally, there is often a thin crust of sea ice that forms on the ocean surface in cold weather.
Just a few percent of the peninsula’s land area is ice-free, and in some places the ice is as much as 500 meters (1,600 feet) thick. The rare exposed areas (brown) are mainly isolated crags and mountain peaks—nunataks—that poke up through the ice layer.
In recent decades, weather stations have measured fluctuating temperatures on the Antarctic Peninsula. Between 1951 and 2000, temperatures rose by 2.8°C (5°F), faster than anywhere else in the world. However, air temperatures then began an equally rapid swing in the opposite direction, dropping by roughly 1°C (2°F) between 2000 and 2014. Meanwhile, surrounding ocean temperatures have been warming since the 1990s, particularly on the western side of the peninsula opposite the Larsen C Ice Shelf.
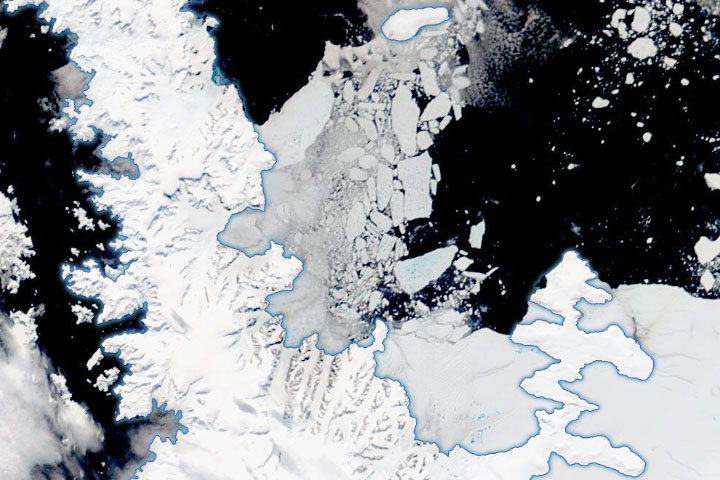
While changing air temperatures may have had some effects on the ice, scientists increasingly believe that warming waters have changed the peninsula’s ice shelves and glaciers the most. Alison Cook and David Vaughan of the British Antarctic Survey analyzed satellite images and aerial photographs dating back to the 1960s and concluded that seven of the twelve ice shelves along the coasts had gotten smaller between the 1960s and 2010.
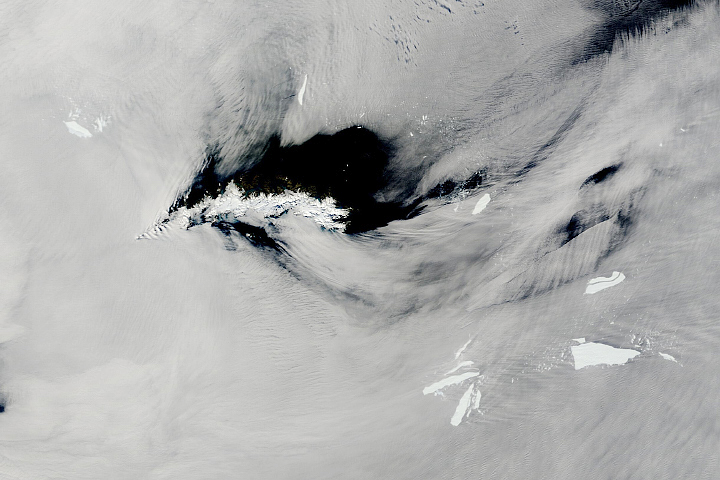
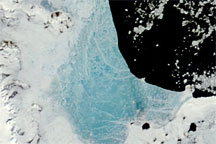
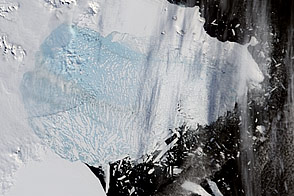
Larsen A (3,736 square kilometers in the 1960s), Larsen B (11,958 square kilometers in the 1960s), and Wordie (1,917 square kilometers in the 1960s) have changed the most, losing much of their ice. Note that when this image was captured sea ice—not the thick ice of an ice shelf—was present in Wordie Bay. George VI had lost some ice, but it remained about 92 percent of the size it was in 1947. Larsen C was relatively stable in 2010, but it is now poised to calve an iceberg the size of Delaware. Larsen D, which expanded by 4 percent, was the only ice shelf that grew larger, according to Cook and Vaughan’s analysis.
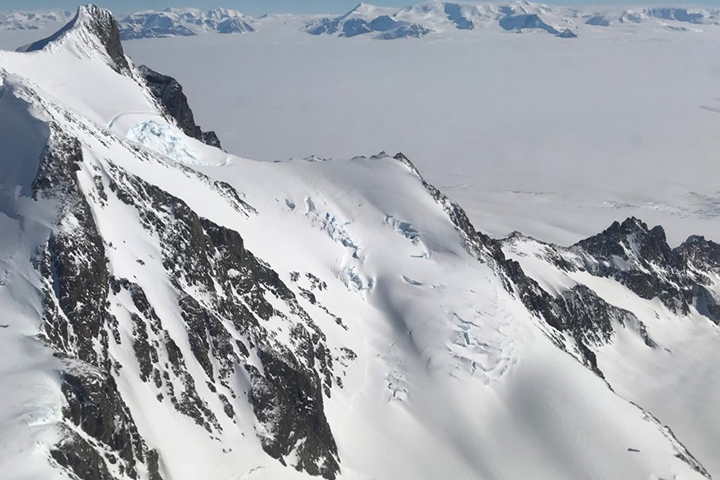
A similar story played out on the glaciers. Of the 860 glaciers on the peninsula, Cook and Vaughan found that 90 percent of them had retreated between the time they were first photographed roughly a half-century ago and 2010. Of these, 30 glaciers lost more than 10 square kilometers of ice, 190 lost between 1 and 10 square kilometers, and 558 lost 1 square kilometer or less. Eighty-two glaciers advanced, most by less than 1 kilometer.
The Fleming, Hariot, and Prospect glaciers—which flow off the peninsula into Wordie Bay—retreated the most during that time period. Hektoria, Crane, and Jorum—glaciers that flow into the Larsen B embayment—also retreated significantly. All of these glaciers saw rates of ice loss accelerate significantly when adjacent ice shelves, which helped hold them in place, broke up.
NASA Earth Observatory image by Jesse Allen, using data from the Level 1 and Atmospheres Active Distribution System (LAADS). Caption by Adam Voiland