
In January 1841, James Clark Ross was leading an expedition to find the South Magnetic Pole when he encountered a nearly perpendicular cliff that extended as far as the eye could see. Though there were mountains beckoning to him in the distance, “We might with equal chance of success try to sail through the cliffs of Dover, as to penetrate such a mass,” the British naval officer wrote in his account of the expedition.
What Ross had encountered was the edge of an ice shelf—one of the many enormous slabs of floating ice along Antarctic coastlines. These shelves form as glaciers flow off the land into cold seawater, float, and fan out on the water surface in thick slabs. There are twelve major ice shelves in Antarctica. Although some have thinned in recent decades, many would look roughly similar today to what Ross and his crew would have seen when they explored much of Antarctica’s coastlines between 1841 and 1843.
Of those twelve, the Larsen Ice Shelf, which was named after Carl Anton Larsen, would stand out to early explorers of Antarctica for showing dramatic change. Larsen is situated along the northeastern coast of the Antarctic Peninsula, one of the fastest-warming places on the planet. In the past three decades, two large sections of the ice shelf (Larsen A and B) have collapsed. A third section (Larsen C) seems like it may be on a similar trajectory, with a new iceberg poised to break away soon.
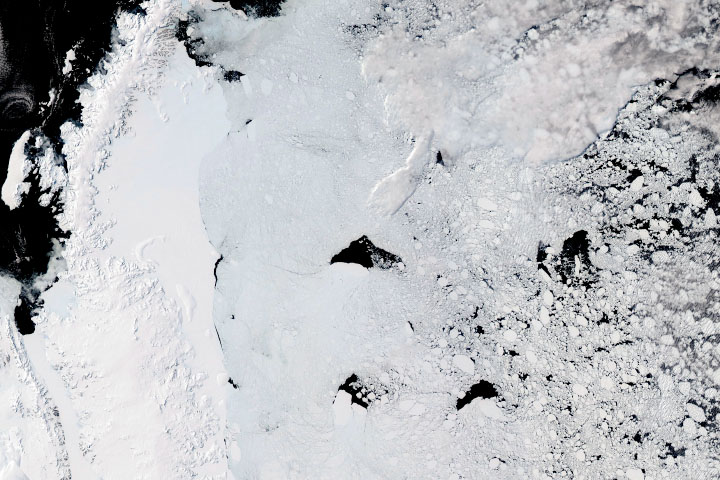
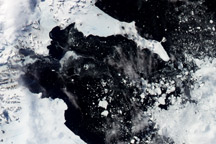
The mosaic above, centered on the northern part of Larsen Ice Shelf, is comprised of four natural-color satellite images captured by the Operational Land Imager (OLI) on Landsat 8 on January 6 and 8, 2016. It shows the remnant of Larsen B, along with the Larsen A and smaller embayments to the north covered by a much thinner layer of sea ice. The remaining shelf appears white with some deep rifts within it.
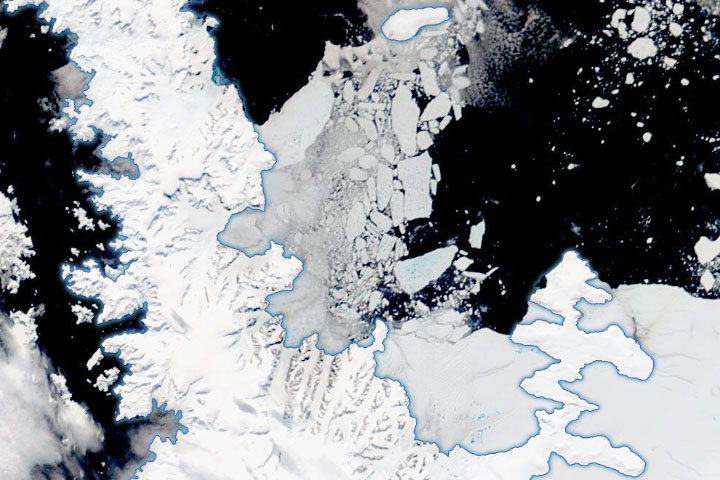
Areas with sea ice anchored to the coastline or ice shelf—fast ice—are light blue where covered with melt water and white where covered by wind-blown snow. The colored lines on the image show where the edges of the glaciers and ice shelf were in 2016 (purple), 2002 (red), and 1986 (yellow) as observed by Landsat satellites. The ocean is dark, nearly black, where it is not covered by sea ice. The white areas near where glaciers meet the sea have multitudes of small icebergs called bergy bits that broke off from land ice.
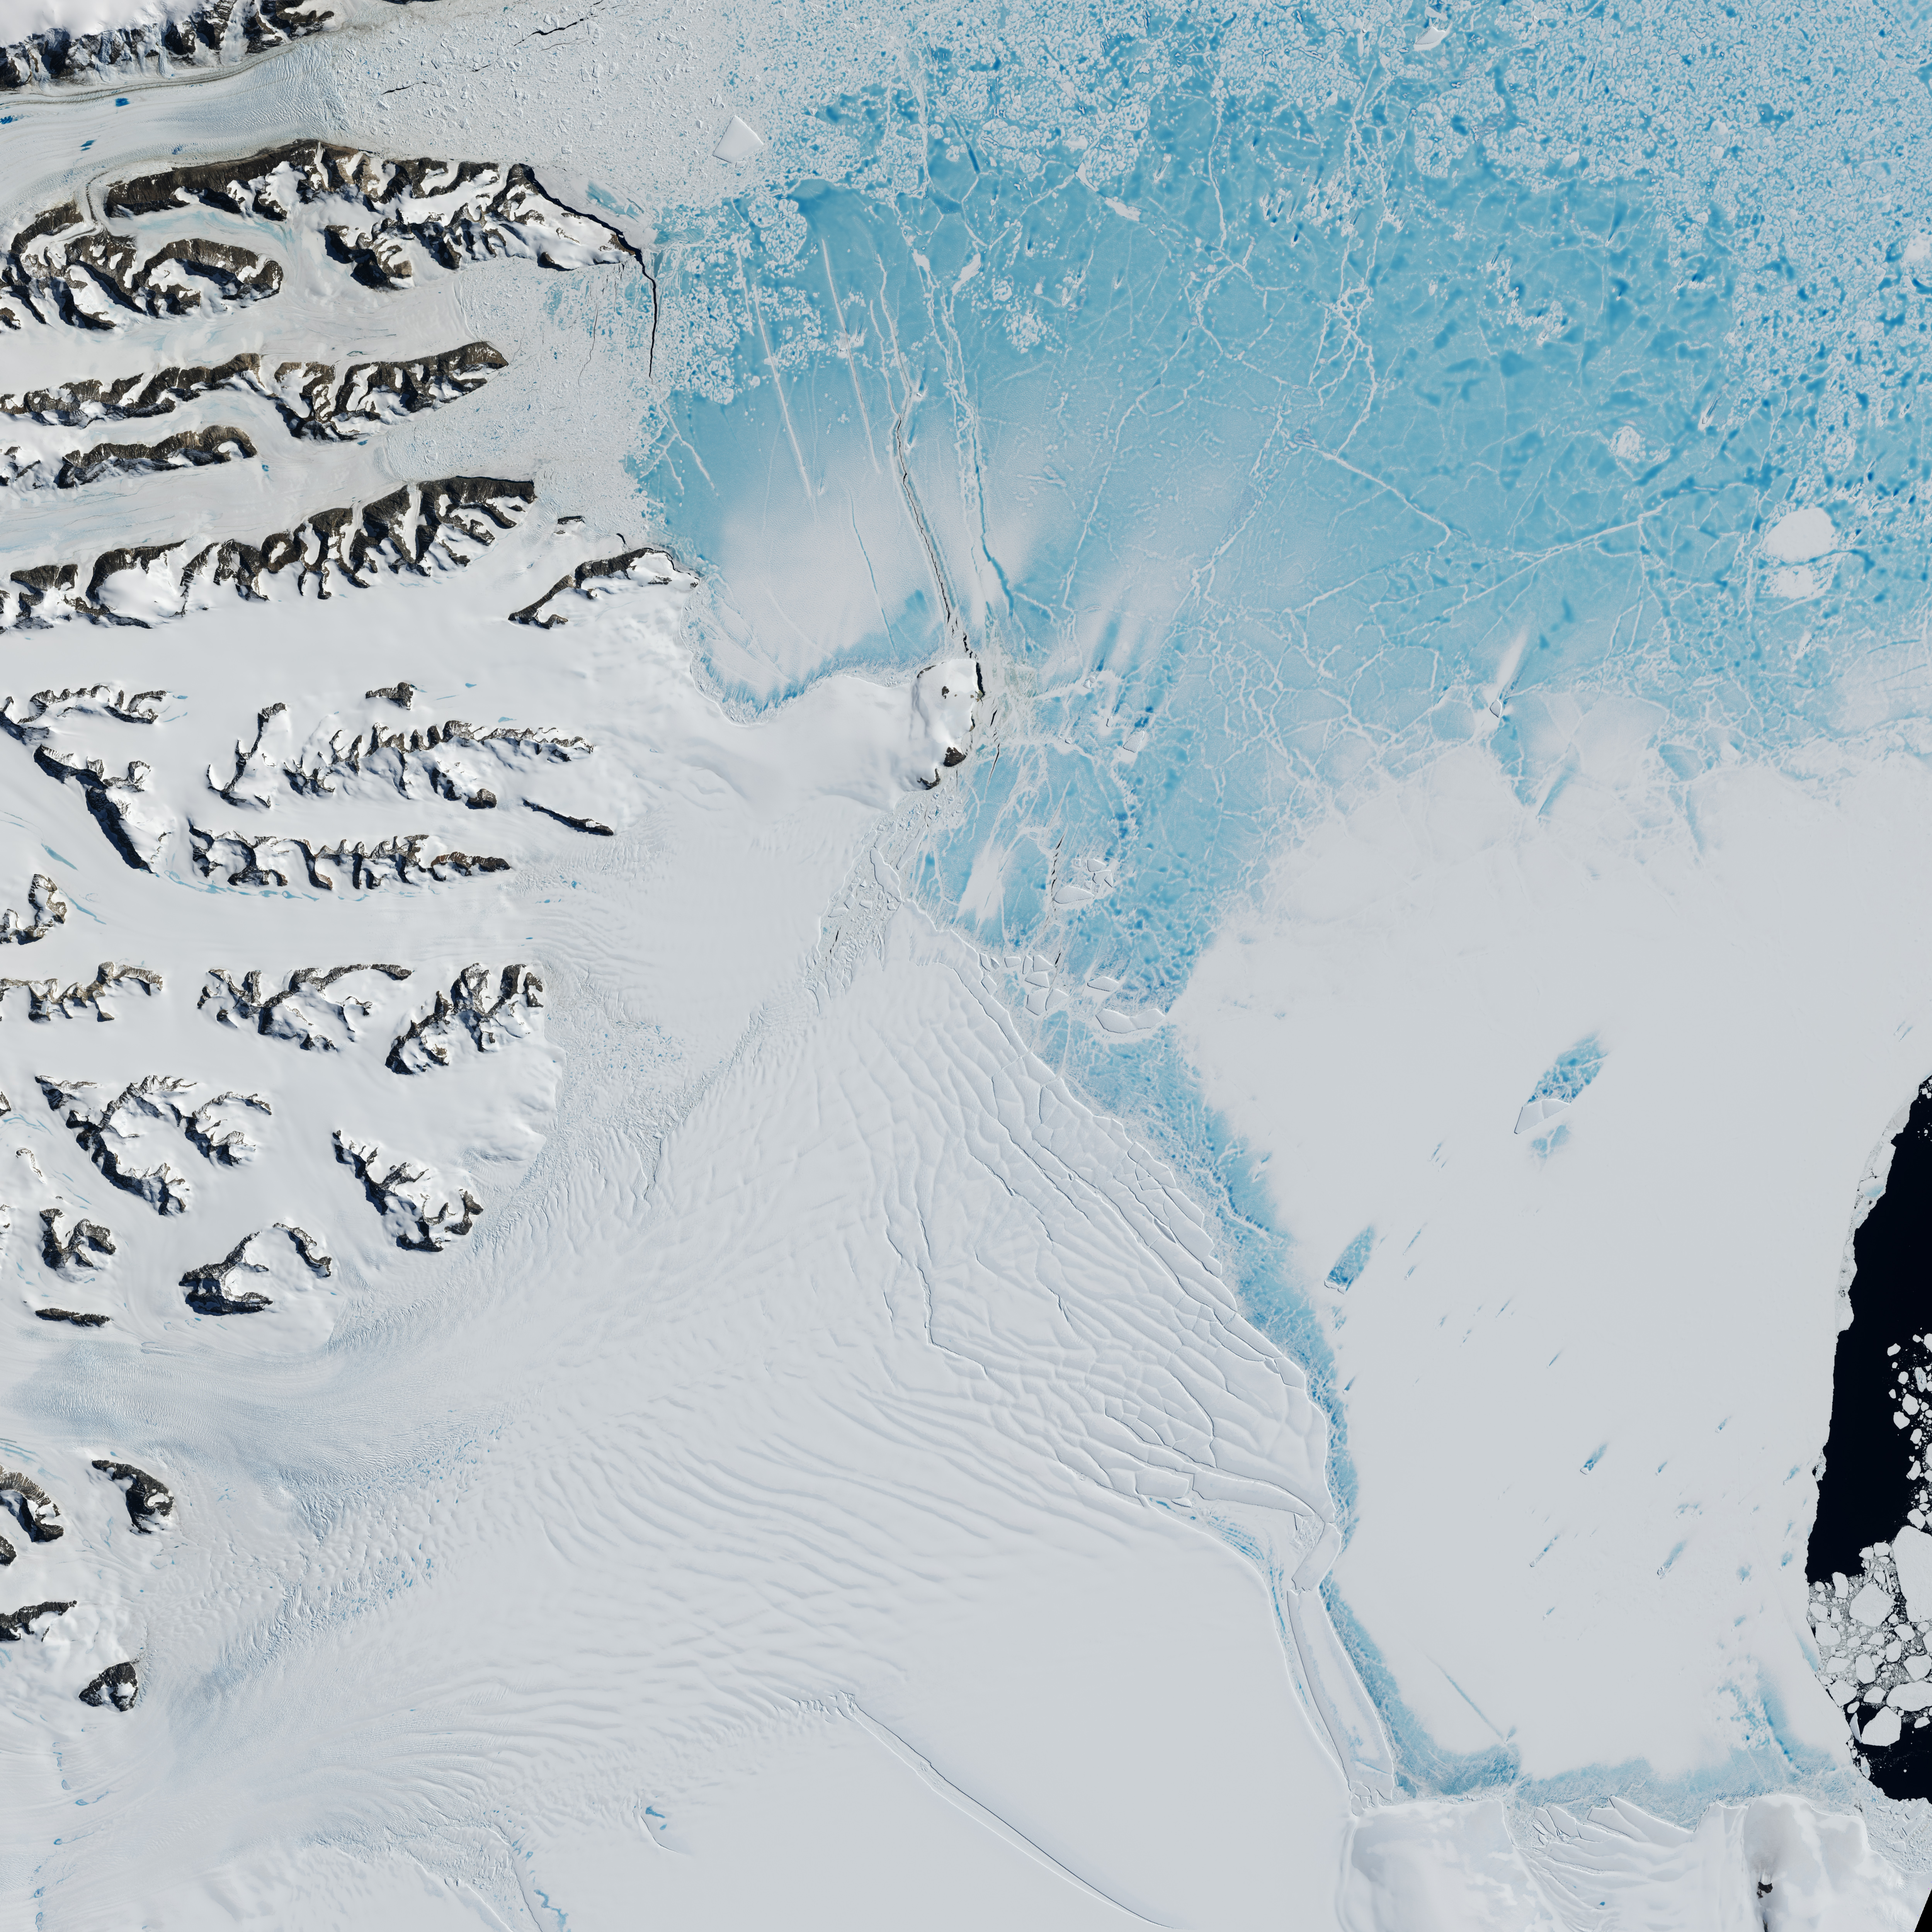
The northernmost section, Larsen A, was fed mainly by glaciers that flowed from the Detroit Plateau. The larger Larsen B section was sustained by Green, Crane, and several other glaciers. A series of ice-covered islands called the Seal Nunataks separated Larsen A and B. (Note: The Landsat image above does not show the rest of the Larsen Ice Shelf, which hugs the coast for several hundred kilometers to the south. See the inset map for the full extent of the ice shelf.)
In January 1995, about 1,500 square kilometers of Larsen A broke apart. In January 2002, about 3,250 square kilometers of Larsen B—an area greater than that of Luxembourg—collapsed within a month. A portion of the Larsen B, known now as the Scar Inlet Ice Shelf, remained after the 2002 collapse.
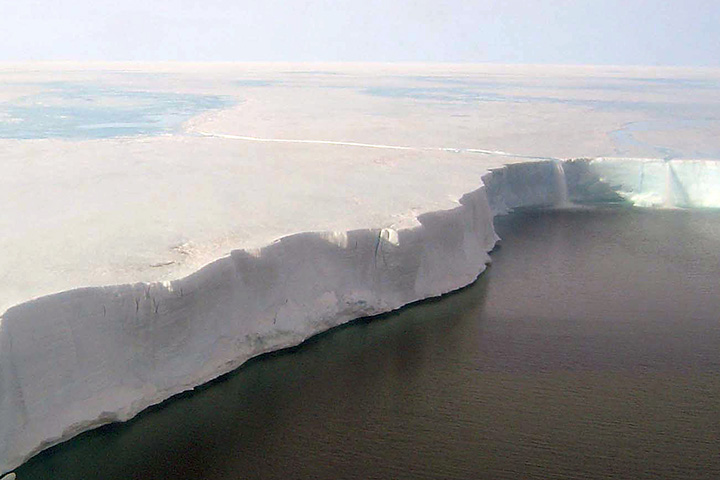
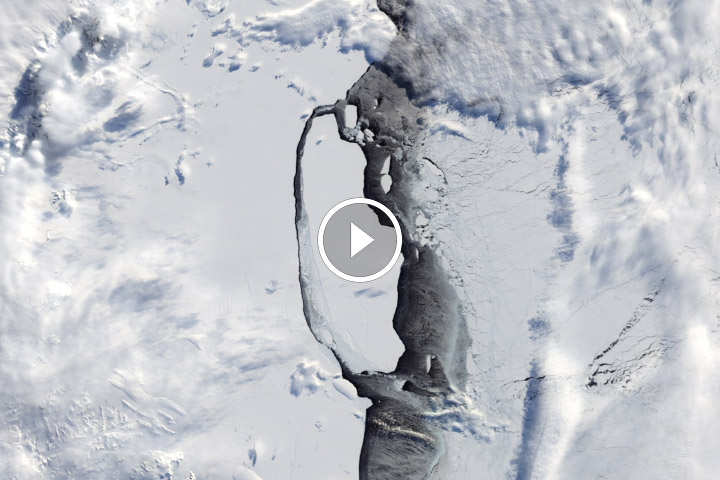
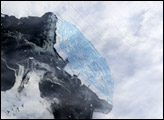
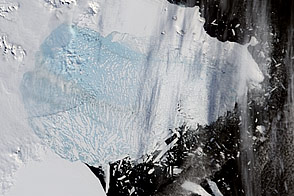
While the boundary between an ice shelf and sea ice can be subtle when viewed at the resolution of the top image, it is easier to see in the more detailed view of the Scar Inlet Ice Shelf, the southern remnant of Larsen B. The third image (below), an aerial photograph taken by scientists from the National Snow & Ice Data Center on February 11, 2006, offers an even closer view of the cliff-like edges of the shelf. Note the two 25-meter (82-foot) waterfalls, which are fed by melt ponds on the surface of the ice.
A team of scientists, including Christopher Shuman of NASA’s Goddard Space Flight Center, scrutinized three decades of Landsat images going back to Landsat 5 to work out where the ice edges have stood since 1986. The largest ice area losses occurred between 1986 and 2002, but what remains of Larsen A and B (the Seal Nunataks Ice Shelf) and Larsen B (the Scar Inlet Ice Shelf) have generally retreated since 2002.
What is not apparent from this image is that the thickness of the remaining ice shelves has also changed. In September 2016, Shuman published a study showing that the Seal Nunataks Ice Shelf thinned at a rate of 2 to 3 meters (6 to 9 feet) per year between 2003 and 2009.
“The thinning is partly due to warm air melting the ice shelf from above and partly from warm ocean water melting it from below,” said Shuman. Most scientists think the combination of warming air and water were responsible for the 1995 and 2002 collapses. Shuman noted that the shelf remnants are still losing ice as icebergs break off into the sea in glacial calving events.
Since Larsen A and B floated on the water to start with, sea level did not increase when these parts of the ice shelf broke apart. But Shuman and colleagues have found that after Larsen A and B collapsed, feeder glaciers on land thinned and began to lose ice at a faster rate, a process that continues today.
“You can think of the Larsen or really any ice shelf like it is a cork in the neck of a champagne bottle lying on its side,” Shuman said. “Once you pop that cork, the wine inside—all that glacial ice sitting on land—will start flowing out. And that’s worrisome because such thinning land ice is directly increasing global sea levels. With other floating ice thinning and retreating elsewhere in Antarctica, it sure looks like many corks are ready to pop.”
NASA Earth Observatory image by Jesse Allen, using Landsat data from the U.S. Geological Survey. NSIDC aerial photograph courtesy of Ted Scambos and Rob Bauer, and ice shelf extent data from Christopher Shuman (UMBC JCET). Caption by Adam Voiland.


