“The ocean is dynamic, and changes happen on very short time scales—from minutes to hours,” said Antonio Mannino of NASA’s Goddard Space Flight Center. “We know there is going to be variability through the day because of the tides, the dynamics of surface currents, and the activity of the living organisms within the ocean. The question is: what sensitivity do satellite sensors need in order to detect it?”
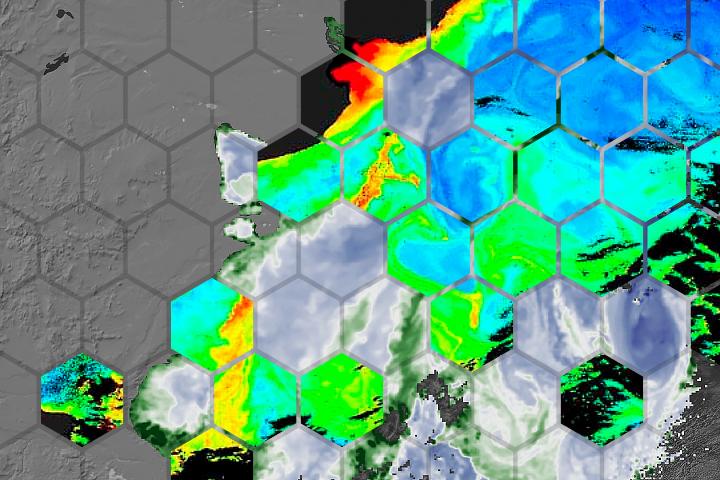
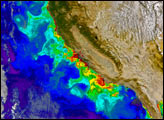
The animated map above shows chlorophyll concentrations in the waters off of South Korea and Japan on May 12, 2016. The data were collected by the Geostationary Ocean Color Imager (GOCI), an instrument on South Korea’s Communication, Ocean and Meteorological Satellite (COMS). The animation shows fluctuations—both in abundance and location—of chlorophyll-rich phytoplankton as it evolved over eight hours that day. The brightest yellows and greens depict the highest concentrations of chlorophyll, while dark gray areas over the ocean were masked by clouds.
According to Kyung-Ae Park of Seoul National University, a key feature in the center of the images is the East Korea Warm Current. Phytoplankton, which float near the water surface, trace out the motion of warm waters that move north along the east coast of Korea and then turn eastward and meet cold water that is moving south. The interactions of these water masses creates “fronts” that promote blooms. Similar current interactions appear to be occurring near the top of the images as well.
GOCI is the first and only ocean color sensor in geostationary orbit, so it can collect measurements hourly, unlike most existing ocean-color sensors that only get one look per day. NASA scientists are keenly interested in the instrument because they are developing the next generation of their own ocean color-monitoring satellites, and they would like to learn from the Korean experience. NASA and the Korea Institute of Ocean Science & Technology (KIOST) recently signed an agreement to allow NASA’s Ocean Biology Processing Group to process and distribute GOCI data and to create data products from it.
The two agencies also just completed a collaborative 18-day campaign—the Korea-United States Ocean Color (KORUS-OC) mission—in the East Sea (Sea of Japan), South Sea, and Yellow Sea to study ocean color and dynamic from ships, planes, and the GOCI satellite. From May 20 to June 6, 2016, researchers cruised on two Korean vessels in the waters offshore from South Korea. They took samples and measurements from the ocean, while also sampling the air quality near the water surface. Those measurements will be correlated to observations made on the same days by GOCI and by airborne instruments flown over the seas surrounding Korea.
In the KORUS-OC campaign, scientists sought to better understand how oxygen and carbon flow between the ocean and atmosphere; the role that phytoplankton play in these processes; and what affects air quality in the region. They also investigated how different species of phytoplankton absorb different wavelengths of light and how blooms evolve at different times of day. This will help NASA optimize instrument capabilities as they develop sensors for future ocean color missions, such as the Geostationary Coastal and Air Pollution Events (GEO-CAPE) satellite.
NASA Earth Observatory images by Jesse Allen, using Geostationary Ocean Color Imager (GOCI) data from the Communication, Ocean, and Meteorological Satellite (COMS). Data hosted on the NASA Ocean Color data archive through a cooperative agreement between NASA and the Korean Institute of Ocean Science and Technology. Caption by Mike Carlowicz, based in part on a story by Kate Ramsayer.