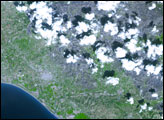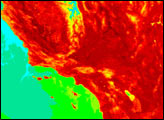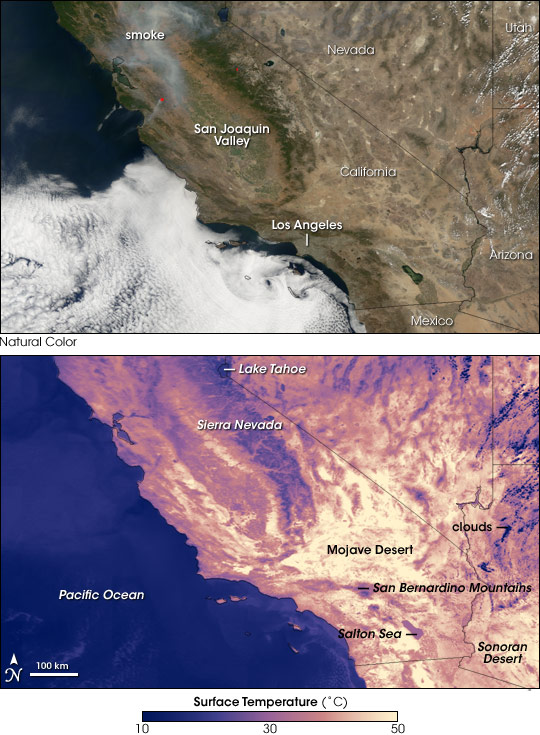
September 5, 2007, marked the end of a week-long heat wave that led to 31 deaths and triggered power outages across southern California, reported the L.A. Times. Temperatures climbed above 38 degrees Celsius (100 Fahrenheit) when a high-pressure system blocked cool air from the Pacific. The effect of the heat wave on different locations in the Southwest is shown in this pair of images, taken on September 5, at 11:25 a.m. local time (18:25 UTC) by the Moderate Resolution Imaging Spectroradiometer (MODIS) flying on NASA’s Terra satellite. The photo-like, natural-color image (top) and corresponding land surface temperature image (bottom) illustrate the relationship between land cover, elevation, and temperature.
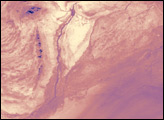
The images show much of California and Nevada, and a smaller portion of Arizona and Utah. Not surprisingly, the hottest areas, shown in yellow, correspond with sparsely vegetated desert regions. In the natural-color image, the brush-covered Mojave Desert on the California-Nevada border is tan with splashes of pink where iron-rich sandstone is exposed. The small-leafed, woody vegetation provides little shade, allowing the Earth’s surface to be exposed to the Sun. The rock-and-dirt desert absorbs sunlight, and temperatures climb (yellow areas of bottom image). The other hot spots in the image occur in the cactus-dotted Sonoran Desert, which encompasses the southernmost portions of inland California and southwestern Arizona, and the much smaller Colorado Desert west of the Salton Sea. Irrigated land south of the Salton Sea and along the Colorado River is a web of brown-green. The presence of water and vegetation in these irrigated areas makes the land cooler. Elevation also plays a role in the surface temperatures of the Sonoran Desert. Pockets of low-elevation land are much warmer than the lines of mountains that separate them, particularly in southwestern Arizona.
The coolest parts of California, shown in purple and blue, are in the mountains, most prominently the Sierra Nevada, but also the San Bernardino Mountains east of Los Angeles. In the photo-like images, the mountain ranges are dark green, colored by trees. The vegetation cover and the high elevation keep the land cooler than surrounding low-elevation sites. The other significant cool spot in the image is the San Joaquin Valley. Like the irrigated farm land bordering the Salton Sea and the Colorado River, this area is kept cool by the presence of water and plants. The coldest areas in the image appear to be in Arizona, Utah, and Nevada, which are marked by streaks of dark purple. These cold signatures are from clouds.
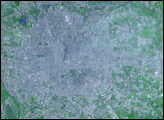
The final correlation between land cover and temperature can be seen in urban areas along the coast. In the photo-like image, Los Angles sprawls as a silver-gray patch from the coast to the San Bernardino Mountains. Since urban surfaces absorb heat, Los Angles is slightly warmer in the surface temperature image than the surrounding landscape. In the north, the San Francisco urban area is similarly warmer than its surroundings.
Though the extreme temperatures raised the fire danger in Southern California, MODIS did not detect any fires in the region. Fires, marked with red dots, were burning in Central California south and east of San Francisco. Smoke from a large fire in Northern California filters down from the top edge of the scene.
NASA image created by Jesse Allen, using data obtained from the Goddard Land Processes data archives (LAADS).